Proceeding Paper

Exploration of Glacier Surface FaciesMapping Techniques Using Very High Resolution Worldview-2 Satellite Data †

by
Shridhar D. Jawak
1,
Sagar F. Wankhede
2,* and
Alvarinho J. Luis
1
1
Polar Remote Sensing Section, Polar Sciences Group, Earth System Science Organization (ESSO), National Centre for Antarctic and Ocean Research (NCAOR), Ministry of Earth Sciences (MoES), Government of India, Headland Sada, Vasco-da-Gama, Goa 403804, India
2
Department of Geoinformatics, Mangalore University, Mangalore, Karnataka 574199, India
*
Author to whom correspondence should be addressed.
Presented at the 2nd International Electronic Conference on Remote Sensing, 22 March–5 April 2018; Available online: https://sciforum.net/conference/ecrs-2.
Proceedings 2018, 2(7), 339; https://doi.org/10.3390/ecrs-2-05152
Published: 22 March 2018
(This article belongs to the Proceedings of The 2nd International Electronic Conference on Remote Sensing)

Abstract

:
Glaciers exhibit a wide range of surface facies that can be analyzed as proxies for mass balance studies. Along with hydrological implications, these are in turn quintessential indicators of climate change. Moderate-to-high-resolution (MHR) data for mapping glacier facies have been used previously; however, the use of very high-resolution (VHR) data for this purpose has not yet been fully exploited. This study uses WorldView-2 (WV-2) VHR data to classify available glacier surface facies on the Samudra Tapu glacier, located in the Himalayas. Traditional methods of facies classification using conventional multispectral data involve band rationing and/or supervised classification. This study explores glacier surface facies classification by using the unique bands available in the multispectral range of WV-2 to develop customized spectral index ratios (SIRs) within an object-oriented domain. The results of this object-oriented classification (OOC) are then compared with five popular supervised classification algorithms using error matrices to determine the classification accuracies. The overall accuracy achieved by the object-based image analysis (OBIA) approach is 97.14% (κ = 0.96), and the highest overall accuracy among the pixel-based classification methods is 74.28% (κ = 0.70). The present results show that the object-based approach is far more accurate than the pixel-based classification techniques. Further studies should test the robustness of the object-oriented domain for the classification of glacier surface facies using customized sensor-specific as well as transferable indices, and the resultant accuracies.

1. Introduction

Glaciers metamorphose according to climatic variations. The geometrical changes associated with these variations are often used to describe the recession or advancement of a glacier [1]. These parameters are then used to calculate the mass balance of the glacier by assessment of the net gain (net accumulation) or net loss (net ablation). Glacier facies represent regional differences in diagenetic stratification on a glacier, owing to summer melt and winter accumulation characteristics [2]. Therefore, glacier facies are described as zones of snow identified on a glacier having a particular set of factors unique to that zone [3]. A recent study [4] analyzed the effects of glacier facies changes on the dimensional variations of glaciers, including recession, deglaciation, as well as the impact of climatic variables on glacial parameters. Thus, the changes in glacier facies can be considered as the direct visual implication of the changes that the glacier as a whole is experiencing. Very high resolution sensors offer the opportunity to study glacial and cryospheric applications as a whole with highly accurate results [5,6,7]. The extraction of information from remotely sensed images can be performed by image classification. This study utilizes pixel-based classification (PBC) and object-oriented classification (OOC) to offer a comparative analysis to determine which strategy is superior for this specific application. While, previously, the extraction of facies has been performed on data acquired in the ablation season, this study aims to map the available facies using a dataset acquired during early winter. The accuracy of the classification is measured using error matrices.

2. Experiments

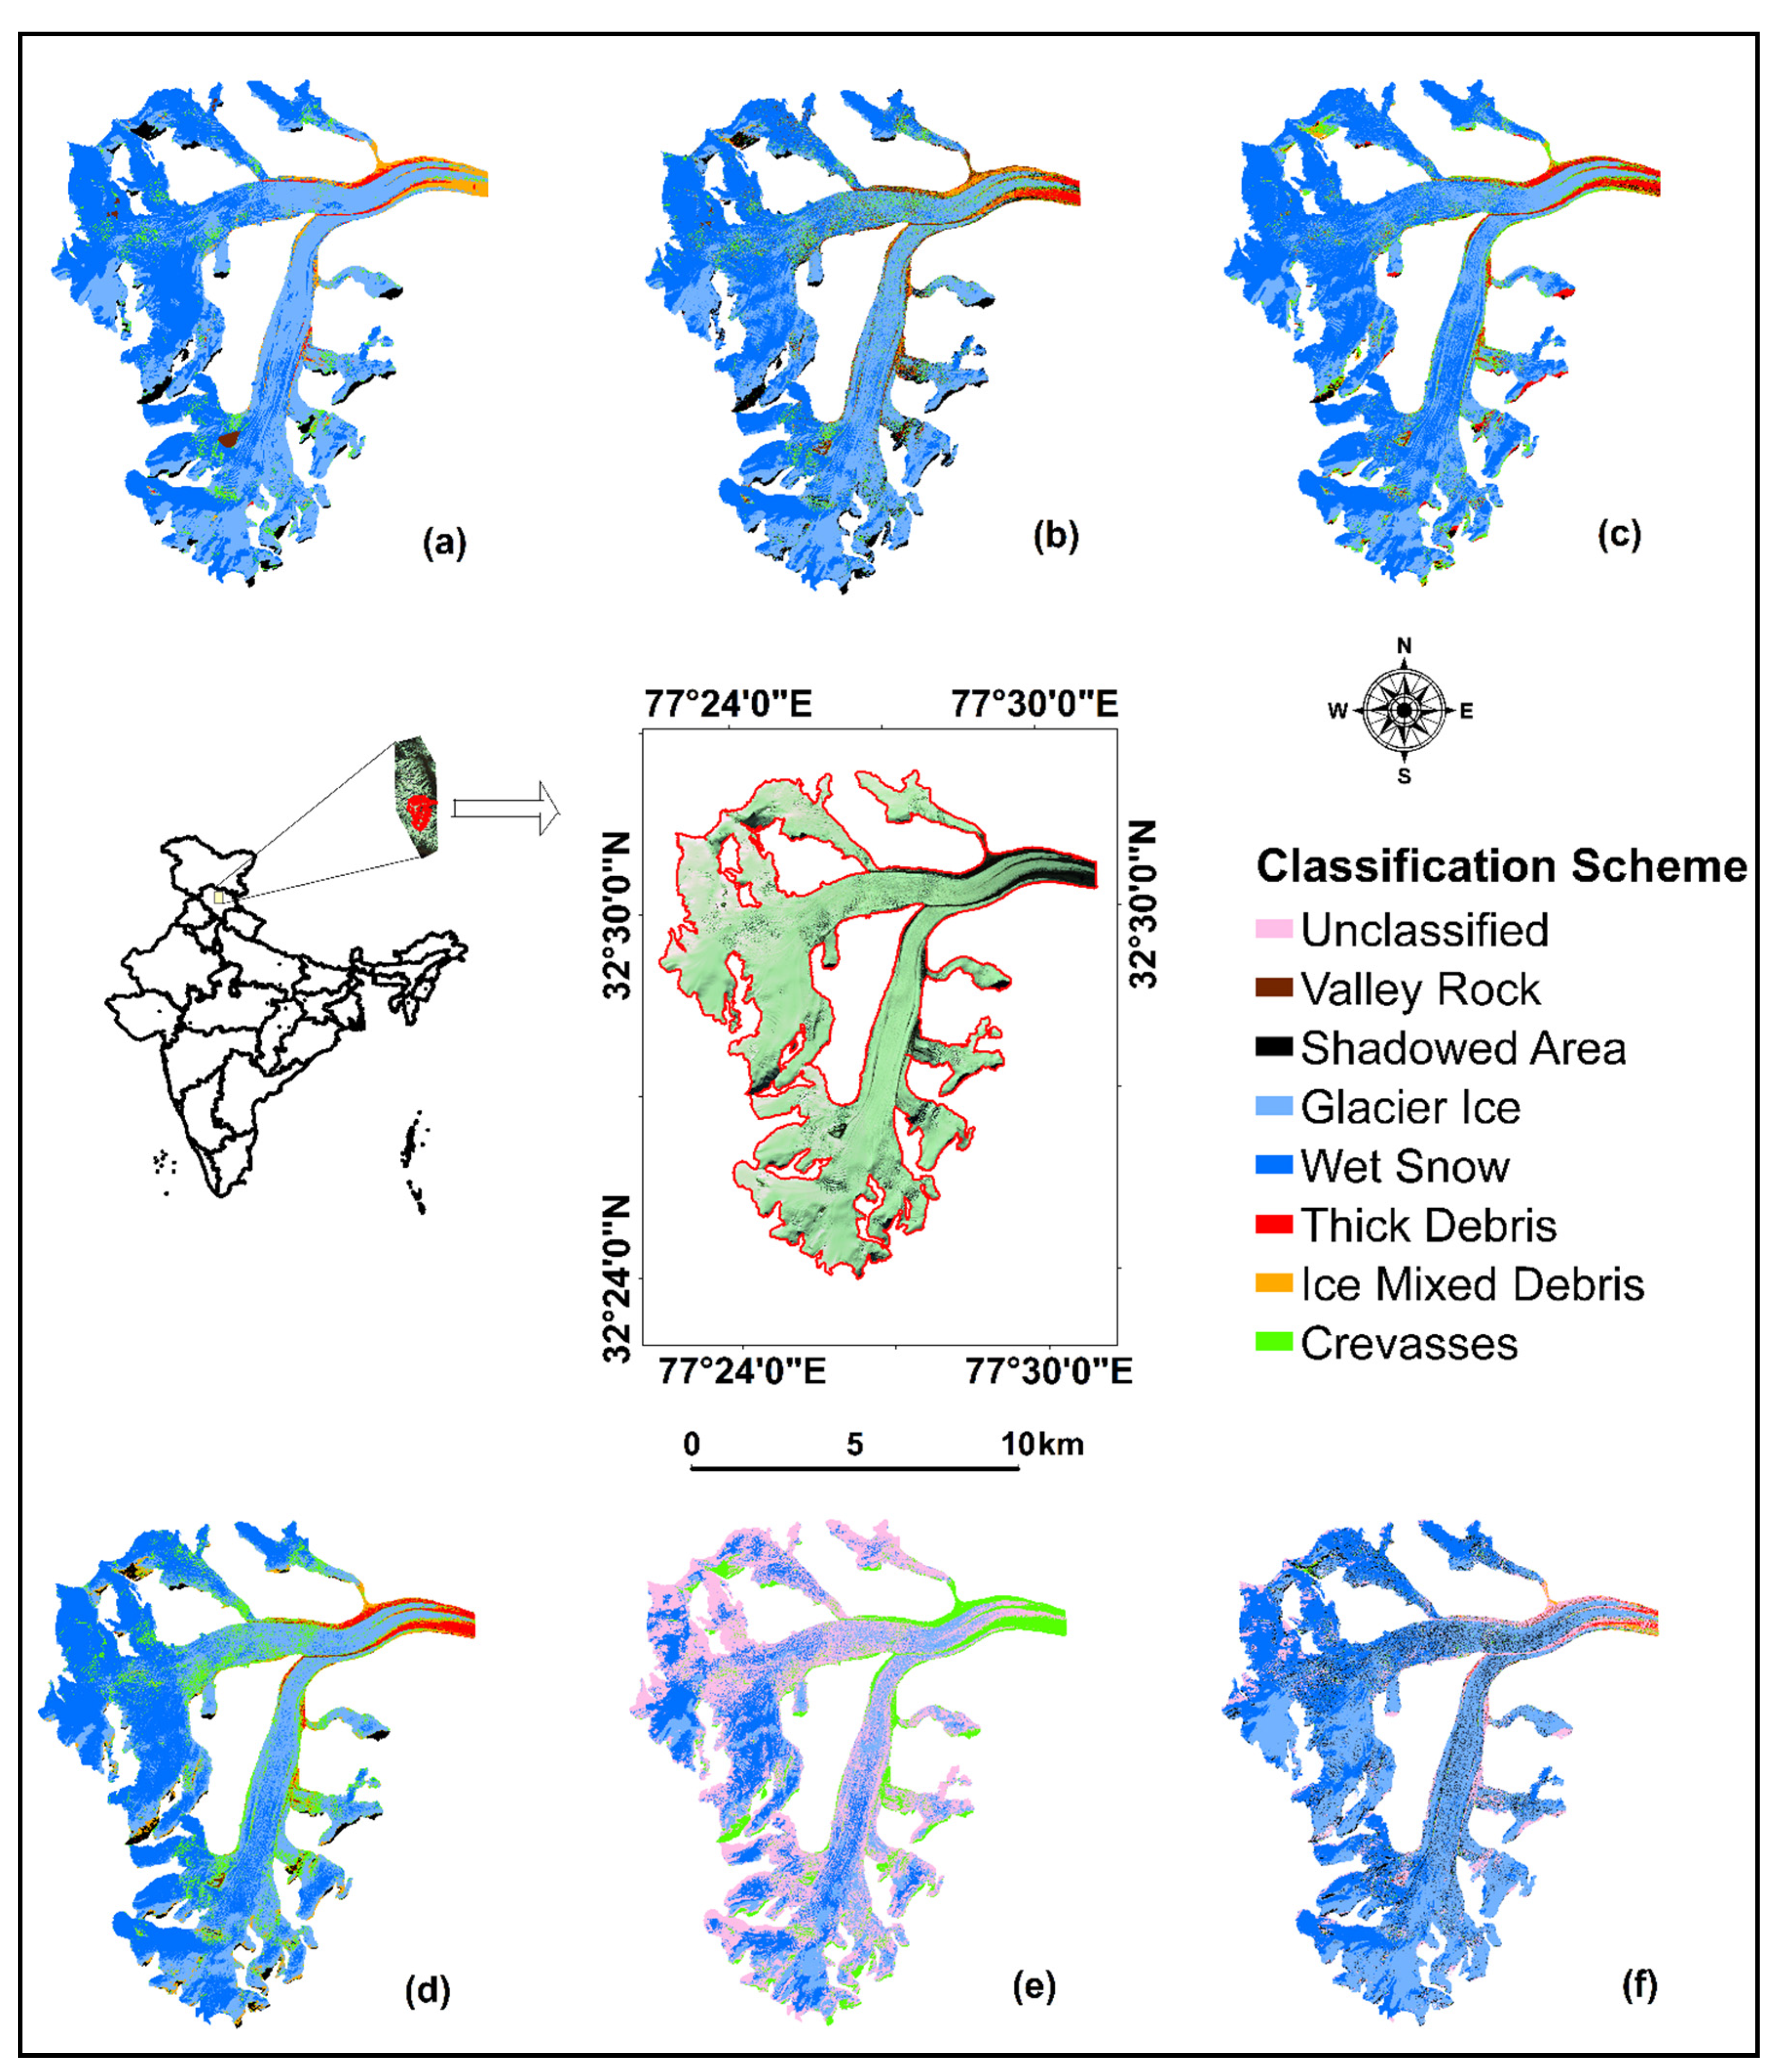
2.1. Study Area and Data

This study focuses on the Samudra Tapu glacier which is situated in the upper Chandra basin of the Himalayas, in the district of Lahaul and Spiti, Himachal Pradesh. Samudra Tapu is the second largest glacier in the upper Chandra basin. For this study, we used WorldView-2 (WV-2) data. The multispectral (MS) range of this data product consists of new bands in addition to the traditionally MS bands, namely, Coastal (0.40–0.45 µm), Blue (0.45–0.51 µm), Green (0.51–0.58 µm), Yellow (0.565–0.625 µm), Red (0.63–0.69 µm), Red Edge (0.705–0.745 µm), NIR-1 (0.770–0.895 µm), and NIR-2 (0.86–1.04 µm). The MS product has a 2m spatial resolution, while the panchromatic product has a 0.5m resolution. An Aster GDEM (Global Digital Elevation Model) was also used in this study.

2.2. Methodology

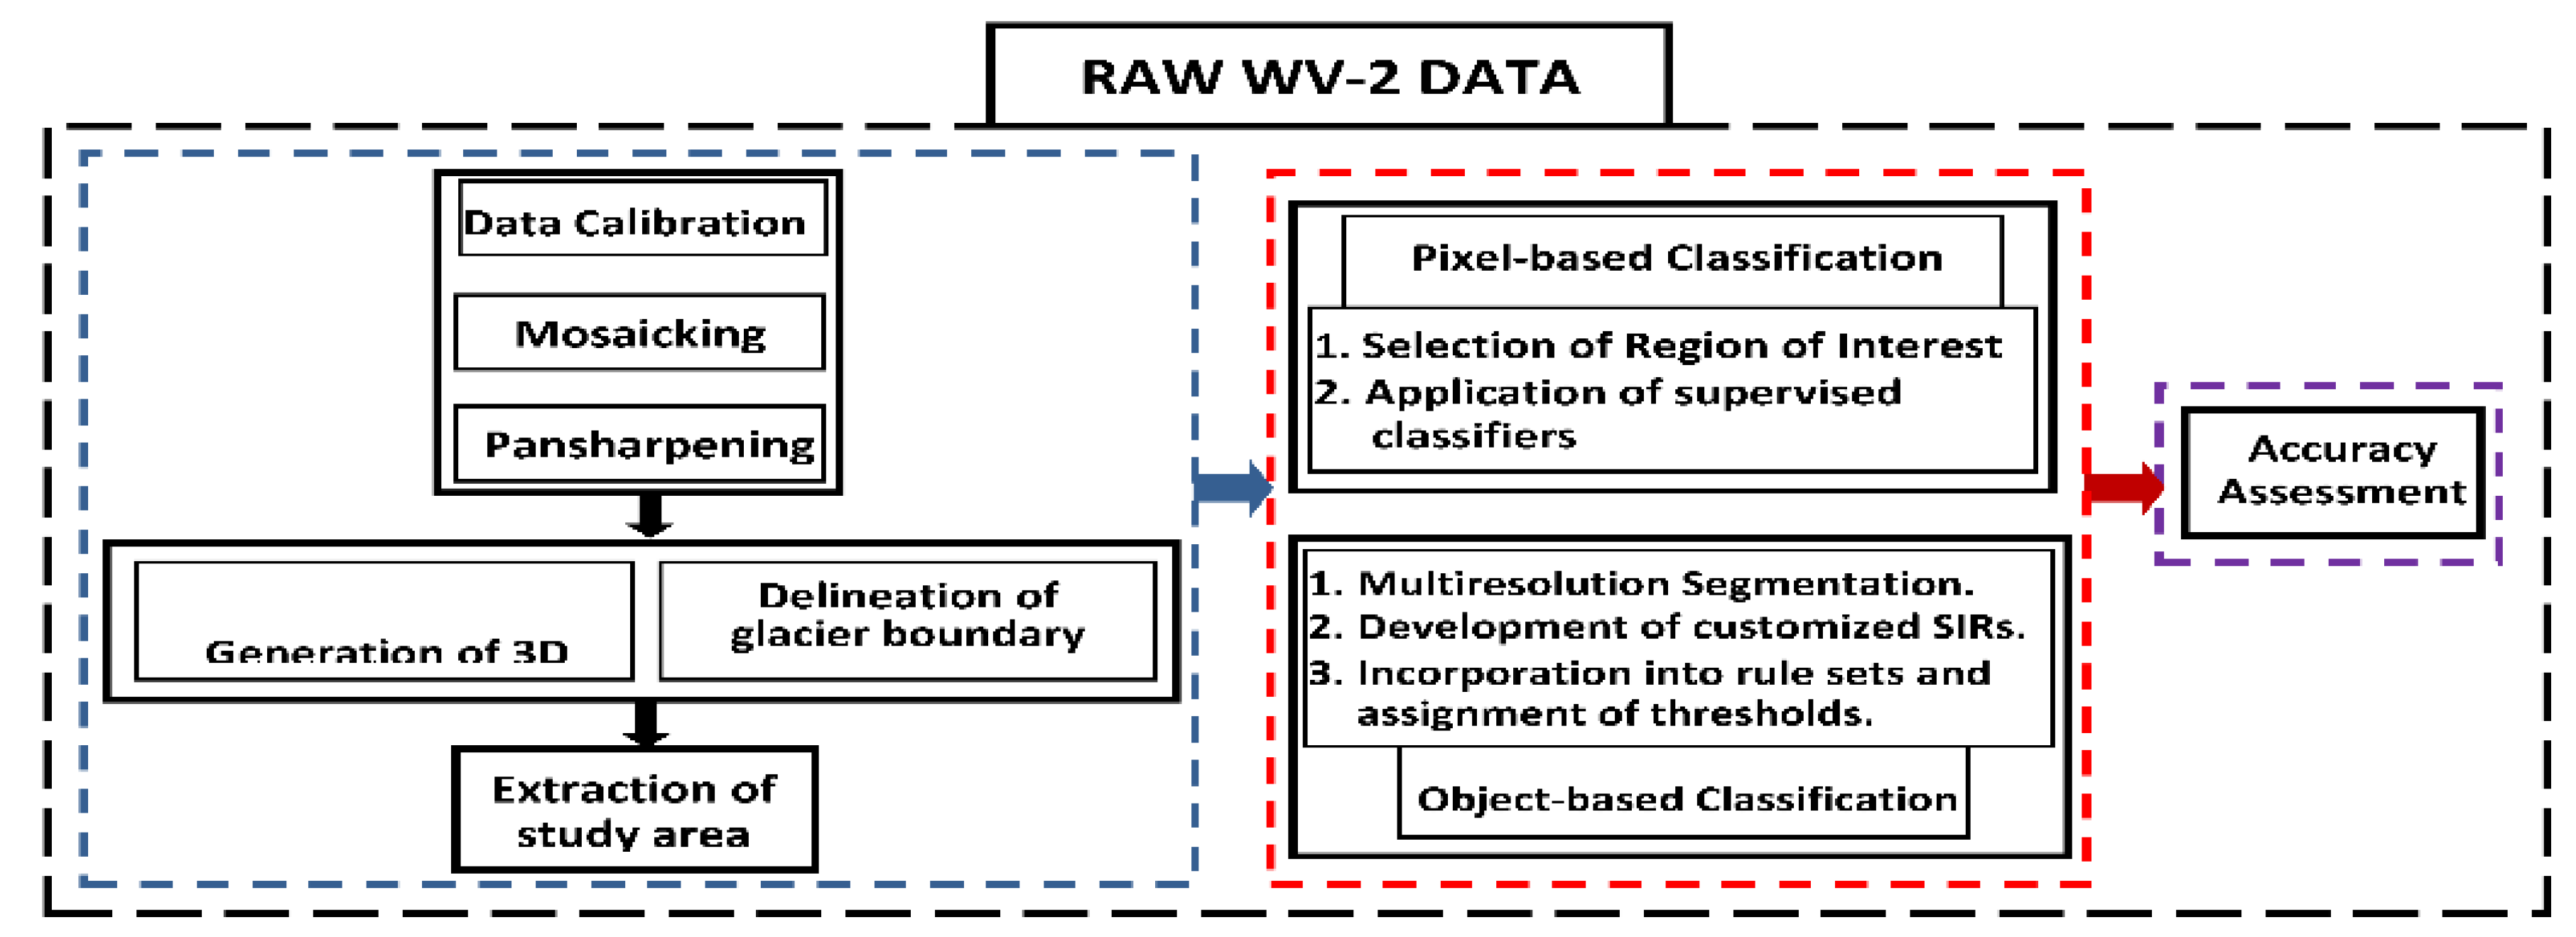
2.2.1. Preprocessing

We followed the preprocessing procedure [8] of image rectification and restoration in order to prepare the image for the extraction of targeted information. The preprocessing performed in this study is depicted in Figure 1, and consisted of five steps: (a) Data calibration; (b) Mosaicking; (c) Pan sharpening; (d) Generation of 3D surface; (e) Extraction of glacier area. The raw data was obtained from DigitalGlobe in the form of 21 individual tiles. These tiles were already geometrically corrected to the projection system of UTM WGS 84 43N and the geographic co-ordinate system of GCS WGS 1984. Data calibration was carried out in two steps: (1) The conversion of raw DN values to sensor spectral radiance; (2) The conversion of sensor radiance to sensor or surface reflectance [9]. The latter is also known as atmospheric correction and was performed by using the FLAASH atmospheric correction module available in ENVI 5.3. Mosaicking of the calibrated data was performed by using seamless mosaicking (ENVI 5.3) to append each of the 21 tiles to produce a single image of the region. Following reference [10], we pansharpened the calibrated data by using Gram Schmidt (GS) which is the optimal method for land-cover classification. To extract the test glacier, a precise delineation of the glacier boundary was crucial. To achieve greater accuracy, the pansharpened image was draped on a 3-dimensional surface model of the study area generated from Aster GDEM v2 with 30 m spatial resolution. The delineated boundary was then used to clip the study area from the whole region. This procedure was carried out in ArcGIS 10.3.

2.2.2. Pixel-Based Classification

The supervised classification performed in this study was undertaken using the TERCAT (Terrain Categorization) tool provided by ENVI 5.3. This tool is available under the SPEAR (Spectral Processing Exploitation and Analysis Resource) automated workflow tools. TERCAT was selected for classification purposes as it generates the output of multiple classification algorithms from a single input. The steps involved in this process include the selection of the regions of interests (ROIs) (pertaining to the kind of detectable facies), the application of supervised classifiers, and the generation of output maps. Five supervised classifiers were considered for this study, which are: (a) Mahalanobis Distance (MHD); (b) Minimum Distance to Mean (MD); (c) Maximum Likelihood (MXL); (d) Parallelepiped (PP); and (e) Spectral Angle Mapper (SAM) (Figure 2).

2.2.3. Object-Based/Oriented Classification

ECognition Developer 64 was employed for classification using the object based image analysis (OBIA) method. The classification was carried out through a series of steps involving multiresolution segmentation, development of customized spectral indices, establishment of thresholds, and incorporation of these indices into rule sets. The multiresolution segmentation increases the overall homogeneity, while reducing the average heterogeneity [11]. User-defined parameters, such as image layer weights, scale parameter, shape/color, and compactness, were used to carry out the segmentation. The following layer weights were assigned: Coastal=2, Blue=1, Green=2, Yellow=1, Red=1, Red Edge=2, NIR1=4, NIR2=3. The nature of the objects generated through segmentation depends on the values given to the scale parameter, shape, and compactness, which were 200, 0.4, and 0.8, respectively. The segmented image was subsequently utilized for developing customized spectral index ratios (SIRs) (Table 1) to facilitate the optimal identification and extraction of the facies. The bands used to develop the indices were selected after a repetitive trial-and-error method to achieve the best possible combination in accordance to the spectral response pattern of the various targets (facies) and the band characteristics. The utilization of indices to extract facies creates the need for assigning thresholds. Therefore, one particular threshold from a single index or a combination of thresholds from more than one index can be considered to be a unique specification of the spectral characteristics of a particular facies [12]. The facies extracted using these combinations were wet snow, glacier ice, ice mixed debris, thick debris, and crevasses.
Shadow areas are not all well discriminated by the proposed indices because much of the shadowed areas are a composite of varying spectral characteristics. This implies that the shadowed areas differ spectrally from each other as well as within themselves. Thus, the extraction of shadowed areas was carried out using digitization within the ArcGIS 10.3 domain. A minute portion of exposed valley rock within the glacier was also digitized. Therefore, the total identifiable facies, including valley rock, were seven. The original image with the shadowed areas was used in eCognition for facies classification. This caused overestimation of certain facies in the shadowed region. Masking of the shadowed areas would result in errors when calculating the areas of facies of the output generated from eCognition. Therefore, using the Erase tool in ArcGIS 10.3, the shadowed areas were erased from each of the individual facies to obtain shape files having no overestimation in the shadowed region. The same procedure was repeated for facies having any overestimation in the region of valley rock.
Y E L L O W N I R 1 + N I R 2 2 R E D   E D G E N I R 1 + N I R 2 2 B L U E N I R 1 + N I R 2 2

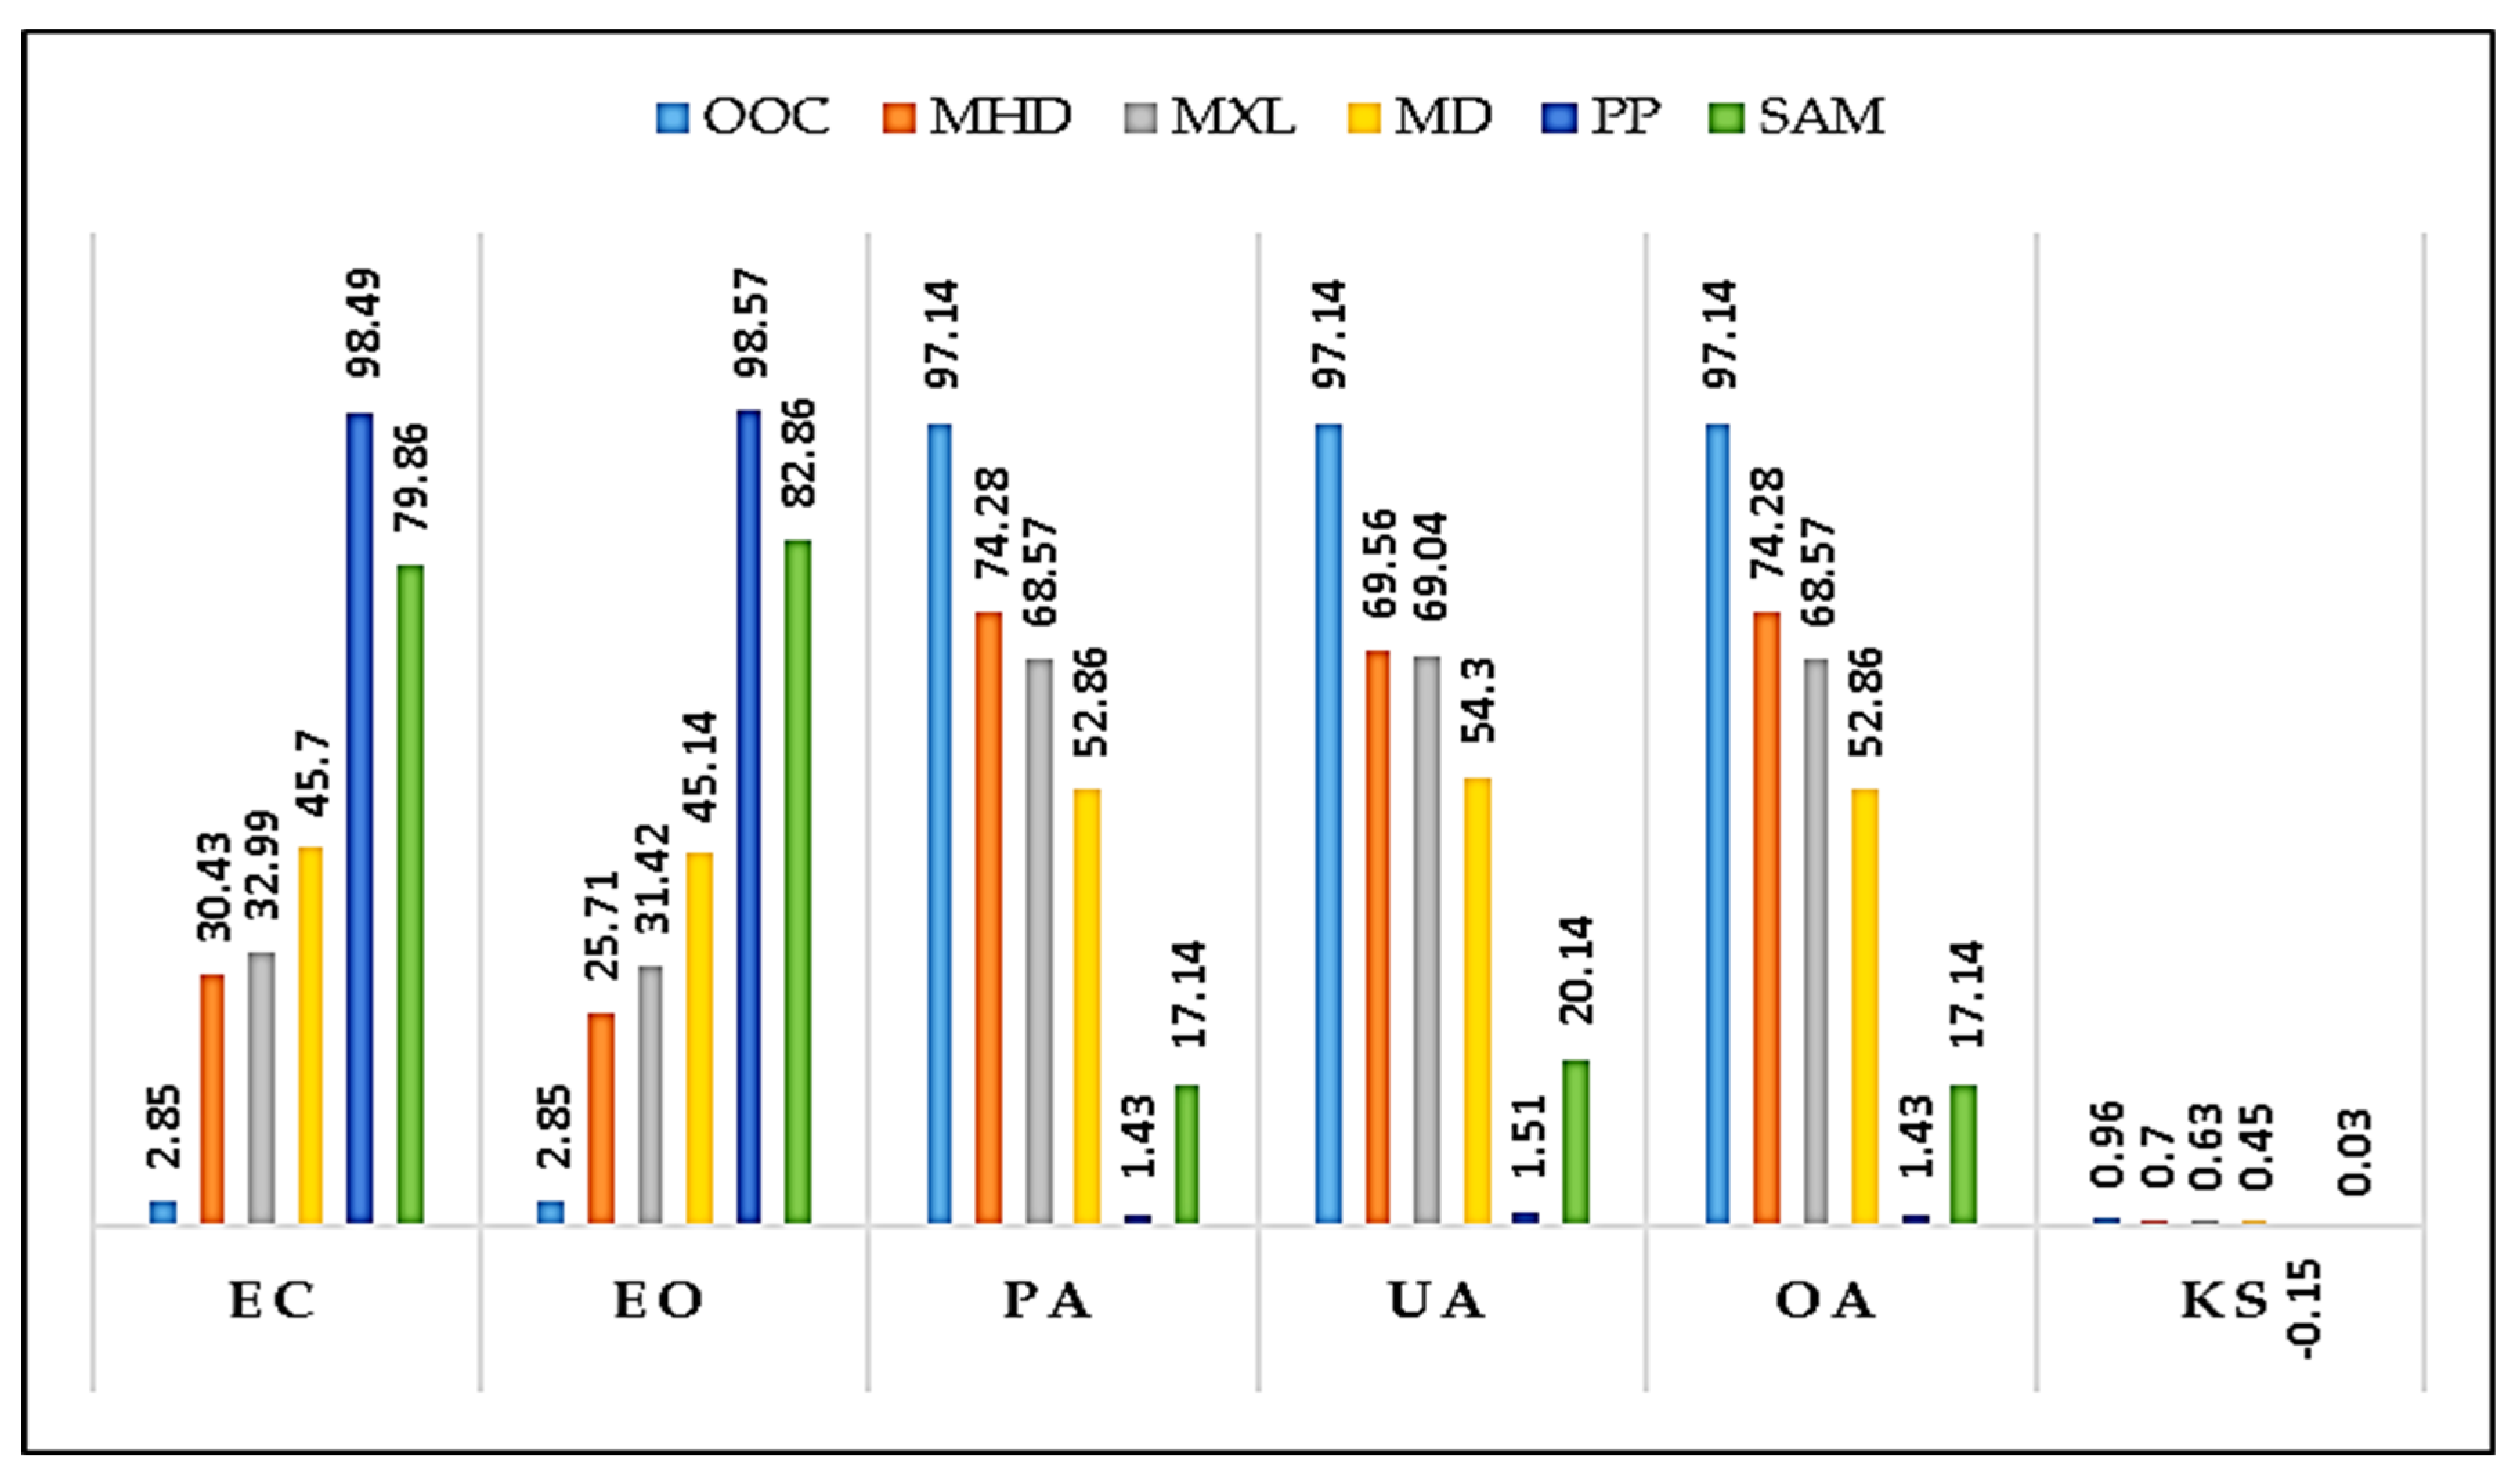
2.2.4. Accuracy Assessment

A total of 70 sample points were equally distributed through seven classes by visual scrutiny and analysis of the spectral plots of the various targets on the image. The measures used to determine accuracy were: (i) error of commission (EC); (ii) error of omission (EO); (iii) producer’s accuracy (PA); (iv) user’s accuracy (UA); (v) overall accuracy (OA); (v) kappa statistics (κ).

3. Results and Discussion

The reference points were selected using visual interpretation and analysis of spectral plots of the target spectra. Error matrices were employed to measure the accuracy (Figure 3) of the classification outputs. On comparative analysis of the results obtained, it is evident that the pixel-based methods were inferior to the object-based techniques. The parallelepiped classifier (Figure 2e) was the most inaccurate of the supervised classifiers tested in this study. This classifier obtained the highest over-estimation, as most of the reference pixels were classified incorrectly. This classifier also resulted in the greatest under-estimation, as it produced the largest amount of unclassified area. The Kappa statistics (Figure 3) obtained by the PP classifier rendered a negative value (−0.15). This could be due to the large areas left unclassified. Among the other supervised classifiers, the performance of the SAM (Figure 2f) was only marginally better than that of the PP. However, the MXL (Figure 2d) and the MD (Figure 2c) delivered below acceptable standards of accuracy, with overall accuracies of 68.57% (ĸ = 0.63) and 52.86% (ĸ = 0.45), respectively. The MHD (ĸ = 0.7) achieved the lowest error of commission (30.43%) and omission (25.71%) (Figure 3), while delivering the highest overall accuracy of 74.28% among the pixel-based classifiers. The OOC method (Figure 2a) was outstanding, as it achieved remarkably low errors of inclusion and exclusion (2.85% each), while delivering an overall accuracy of 97.14%. With a kappa index of 0.96, this proved to be the most accurate and reliable classification scheme (Figure 3).

4. Conclusions

The generation of a 3D surface to facilitate the delineation of ROIs greatly improved the understanding of the topography, thus increasing the precision of delineation. One of the key features of this study is the creation of the new customized SIRs to extract facies within the OBIA domain. These indices proved to be excellent not only in establishing spectral thresholds but also in aiding the utilization of contextual features. Although post-classification adjustments were necessary to extract the maximum possible details for the OOC scheme, the results are unmatched. The pixel-based classifiers yielded sub-par levels of accuracy and were clearly not suitable for the unique conditions offered by the data used. A significant feature of this study is that it was able to map glacier facies without the use of short wave infrared (SWIR) bands. The band combinations from the MS range of WV-2 can be examined further for the generation of more unique indices. The current SIRs can also be tested to determine their transferability.

Author Contributions

S.D.J. and A.J.L. conceived and designed the experiments; S.D.J. and S.F.W. performed the experiments; S.D.J. and S.F.W. analyzed the data; A.J.L. contributed in revising manuscript; S.D.J. and S.F.W. wrote the paper. All authors have read and agreed to the published version of the manuscript.

Acknowledgments

The authors thank DigitalGlobe for providing the imagery used in this study. Theyalso acknowledge Rajan, former Director, ESSO-NCAOR, and M. Ravichandran, Director, ESSO-NCAOR, for their encouragement and motivation for this research.

Conflicts of Interest

The authors declare no conflict of interest.

Abbreviations

The following abbreviations are used in this manuscript:
OBIAObject Based Image Analysis
GDEMGlobal Digital Elevation Model
NIRNear Infrared
SIRSpectral Index Ratios
SWIRShort Wave Infrared

References

  1. Paul, F.; Kääb, A.; Haeberli, W. Recent glacier changes in the Alps observed by satellite: Consequences for future monitoring strategies. Glob. Planet. Chang. 2007, 56, 111–122. [Google Scholar] [CrossRef]
  2. Benson, C.S. Stratigraphic Studies in the Snow and FIRN of the Greenland Ice Sheet. No. RR70. Cold Regions Research and Engineering lab Hanover NH. 1962. Available online: http://acwc.sdp.sirsi.net/client/en_US/search/asset/1001392;jsessionid=351D596A6CE87F45BAEB04E7B9ECE897.enterprise-15000 (accessed on 3 January 2018).
  3. Pope, A.; Rees, G. Using in situ spectra to explore Landsat classification of glacier surfaces. Int. J. Appl. Earth Obs.Geoinf. 2014, 27, 42–52. [Google Scholar] [CrossRef]
  4. Ali, I.; Shukla, A.; Romshoo, S. Assessing linkages between spatial facies changes and dimensional variations of glaciers in the upper Indus Basin, western Himalaya. Geomorphology 2017, 284, 115–129. [Google Scholar] [CrossRef]
  5. Fugazza, D.A.; Senese, A.N.; Azzoni, R.S.; Smiraglia, C.L.; Cernuschi, M.A.; Severi, D.A.; Diolaiuti, G.A. High-resolution mapping of glacier surface features. The UAV survey of the Forni Glacier (Stelvio National Park, Italy). Geogr. Fis. Din.Quat. 2015, 38, 25–33. [Google Scholar]
  6. Jawak, S.D.; Luis, A.J. A semiautomatic extraction of Antarctic lake features using worldview-2 imagery. Photogramm. Eng. Remote Sens. 2014, 80, 939–952. [Google Scholar] [CrossRef]
  7. Jawak, S.D.; Luis, A.J. High Resolution 8-Band worldview-2 Satellite Remote Sensing Data for Polar Geospatial Information Mining and Thematic Elevation Mapping of Larsemann Hills, East Antarctica. In Proceedings of the 11th International Symposium on Antarctic Earth Sciences, East Antarctica, Edinburgh, Scotland, 10–16 July 2011; pp. 10–16. [Google Scholar]
  8. Lilliesand, T.M.; Kiefer, R.W.; Chipman, J.W. Remote Sensing and Image Interpretation, 5th ed.; John Wiley & Sons: Hoboken, NJ, USA, 2004; pp. 492–493. [Google Scholar]
  9. Jawak, S.D.; Luis, A.J. Geospatial mapping of Antarctic coastal oasis using geographic object-based image analysis and high resolution satellite imagery. In Proceedings of the International Society for Optics and Photonics, SPIE Asia-Pacific Remote Sensing, New Delhi, India, 4–7 April 2016; p. 98801. [Google Scholar] [CrossRef]
  10. Jawak, S.D.; Luis, A.J. Very high-resolution satellite data for improved land cover extraction of Larsemann Hills, Eastern Antarctica. J. Appl. Remote Sens. 2013, 7, 73460. [Google Scholar] [CrossRef]
  11. Definiens Developer. Ecognition Reference Book. Definiens Developer: München, Germany, 2012; pp. 34–37. Available online: http://www.imperial.ac.uk/media/imperial-college/medicine/facilities/film/Definiens-Developer-Reference-Book-XD-2.0.4.pdf (accessed on 12 May 2017).
  12. Jawak, S.D.; Wankhede, S.F.; Luis, A.J. Prospective of high resolution worldview-2 satellite data for geospatial surface facies mapping of an alpine glacier. In Proceedings of the Asian Conference on Remote Sensing, New Delhi, India, 23–27 October; 2017. Available online: https://www.dropbox.com/sh/z0pws7ul29n7v1d/AACaV9rFNcF01xNGnWwwgmF_a/177.pdf?dl=0 (accessed on 27 January 2017).
Figure 1. Methodology adopted in the present study.
Proceedings 02 00339 g001
Figure 2. Location map of the study glacier along with classification outputs, i.e., (a) Object-based classification (OOC); (b) Mahalanobis distance (MHD); (c) Minimum distance to mean MD; (d) Maximum likelihood (MXL); (e) Parallelepiped (PP) and (f) Spectral angle mapper (SAM).
Proceedings 02 00339 g002
Figure 3. Measures of accuracy of the supervised classifiers.
Proceedings 02 00339 g003
Table 1. Customized Spectral Index Ratios (SIRs) used in this study.
Index No.SIR1SIR2SIR3
Mathematical
expression
Y E L L O W N I R 1 + N I R 2 2 R E D   E D G E N I R 1 + N I R 2 2 B L U E N I R 1 + N I R 2 2
Publisher’s Note: MDPI stays neutral with regard to jurisdictional claims in published maps and institutional affiliations.

