Large Scale, Long-Term, High Granularity Measurement of Active Travel Using Smartphones Apps †

Abstract
:1. Introduction
The findings from this study are a clear call for political action on active commuting, which has the potential to improve public health by preventing common (and costly) non-communicable diseases. A shift from car to more active modes of travel will also decrease traffic in congested city centres and help reduce air pollution, with further benefits for health.[5]
- Lacking long-term data describing physical activity and travel behaviours.
- Having limited generalizability due to geographically limited scope.
- Being open to potential bias by relying on self-reported data.
2. Methods
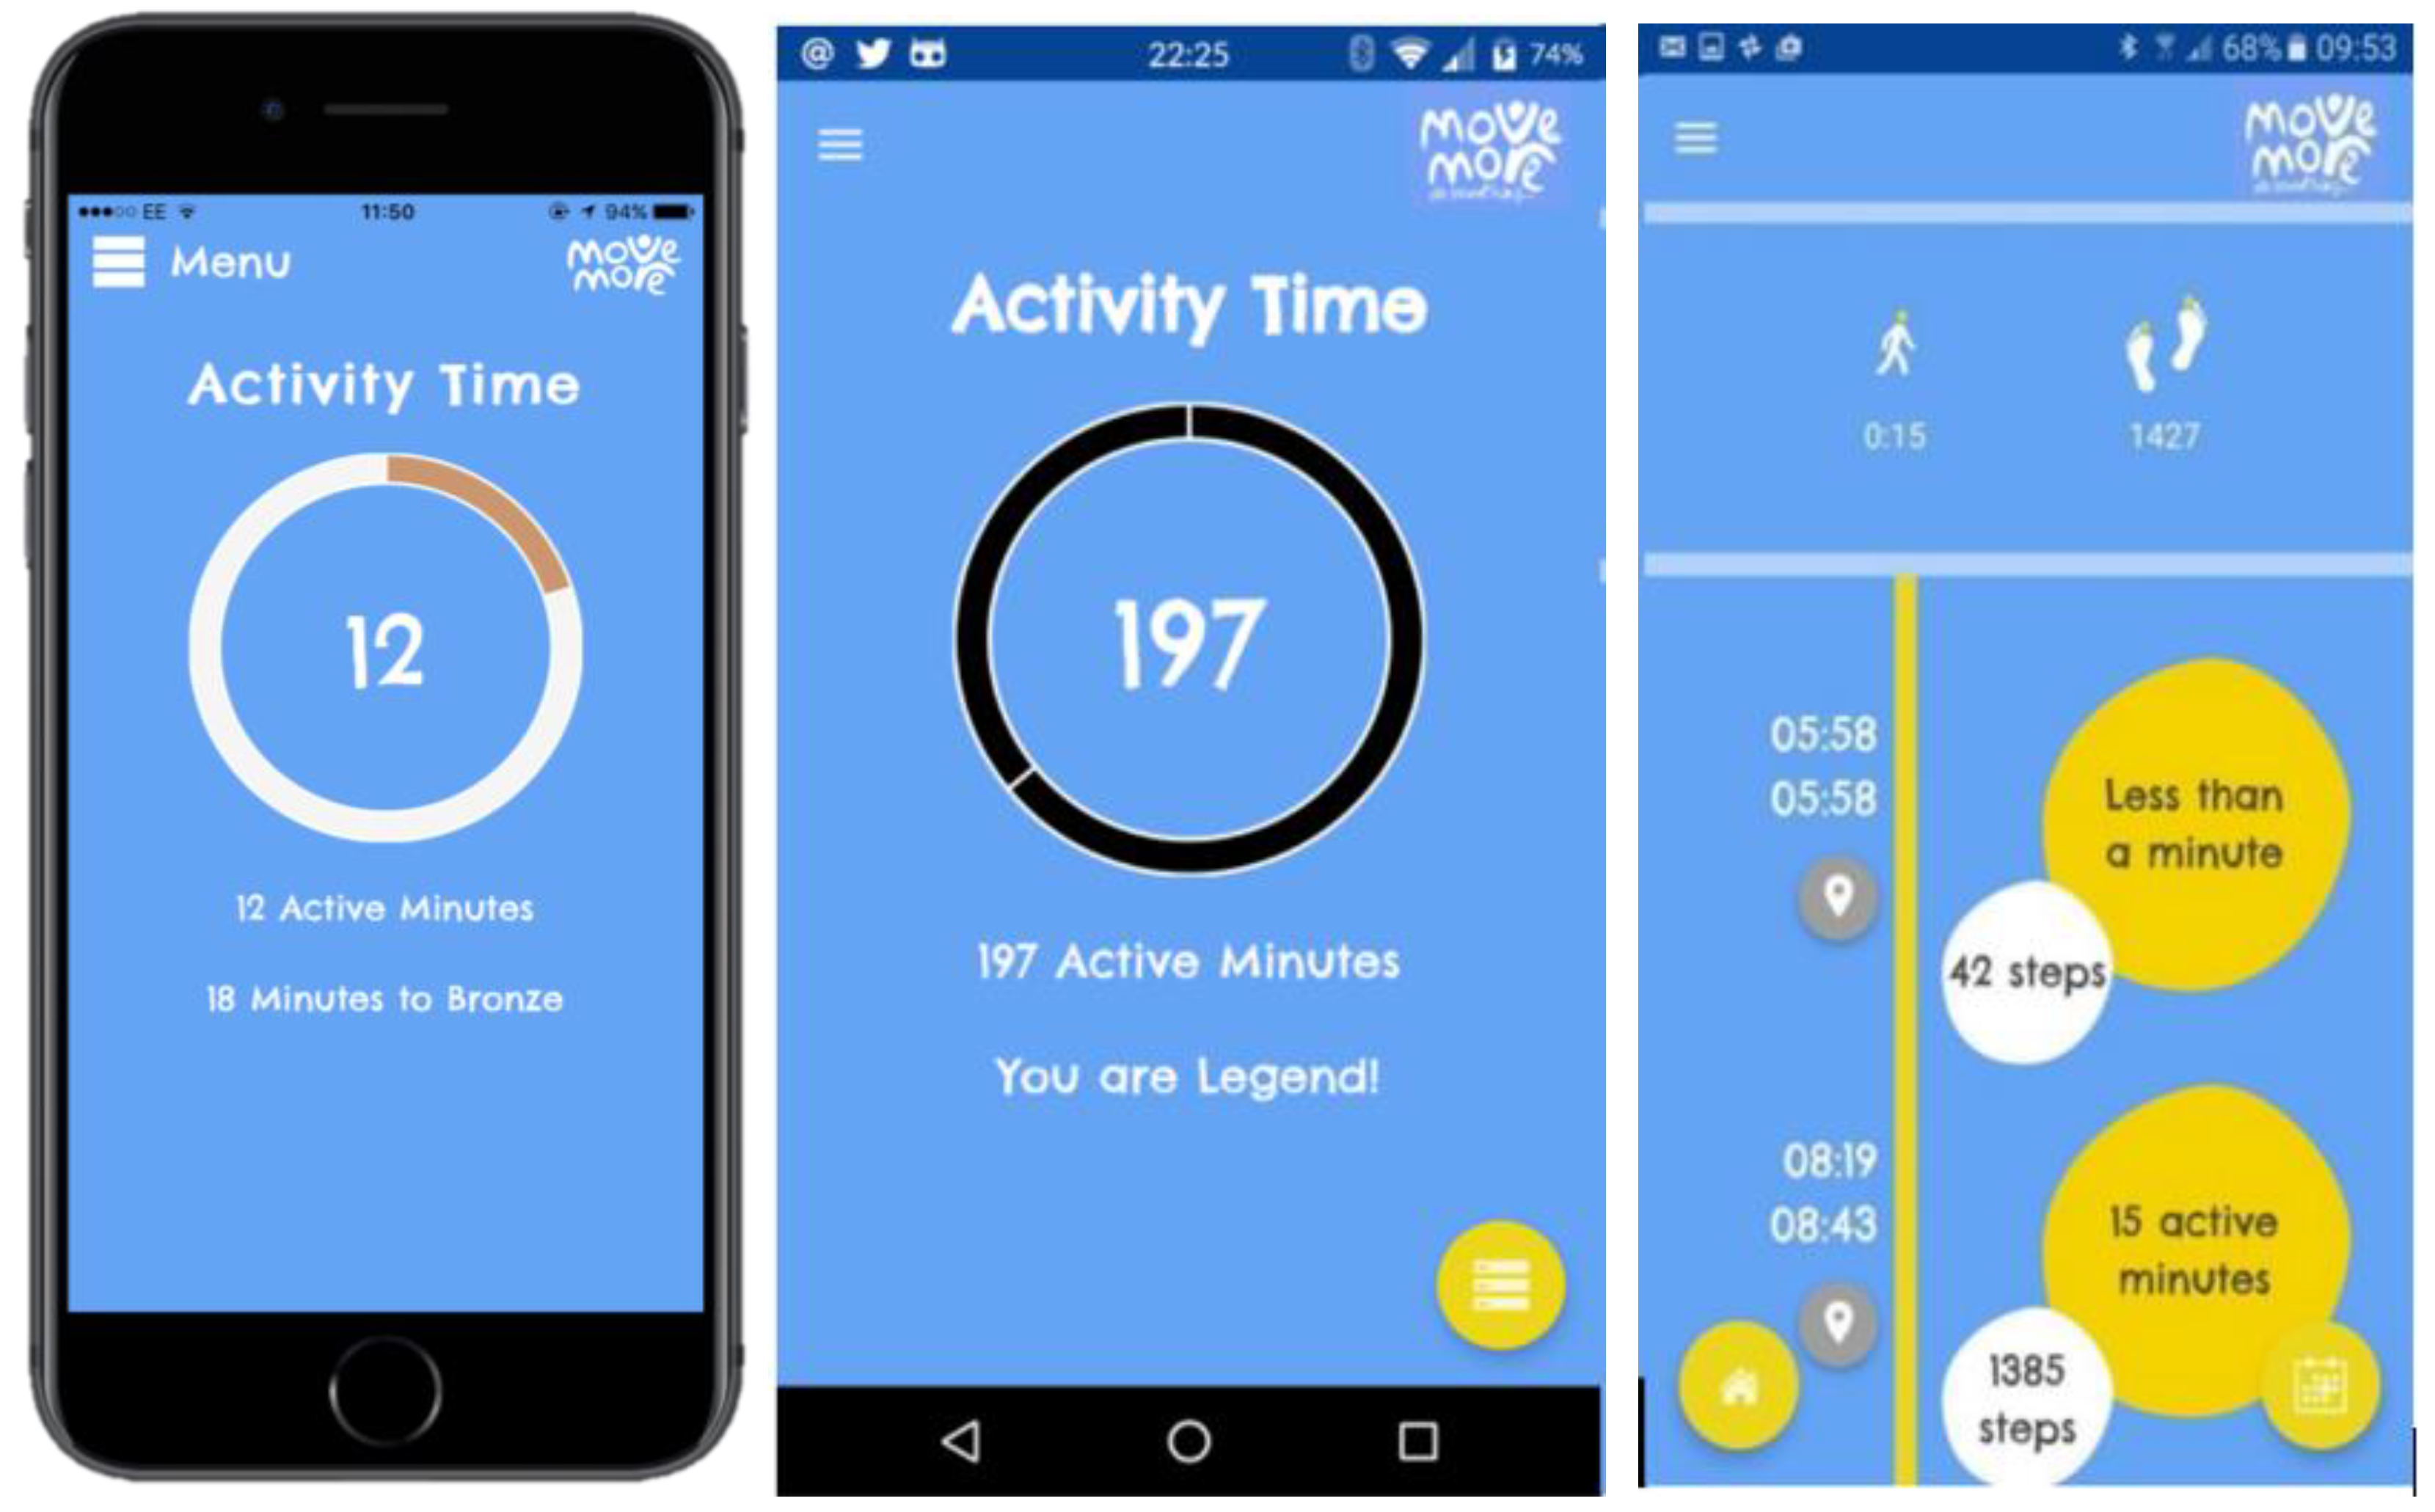
2.1. System
- Bronze 30 min
- Silver 45 min
- Gold 60 min
- Black 90 min
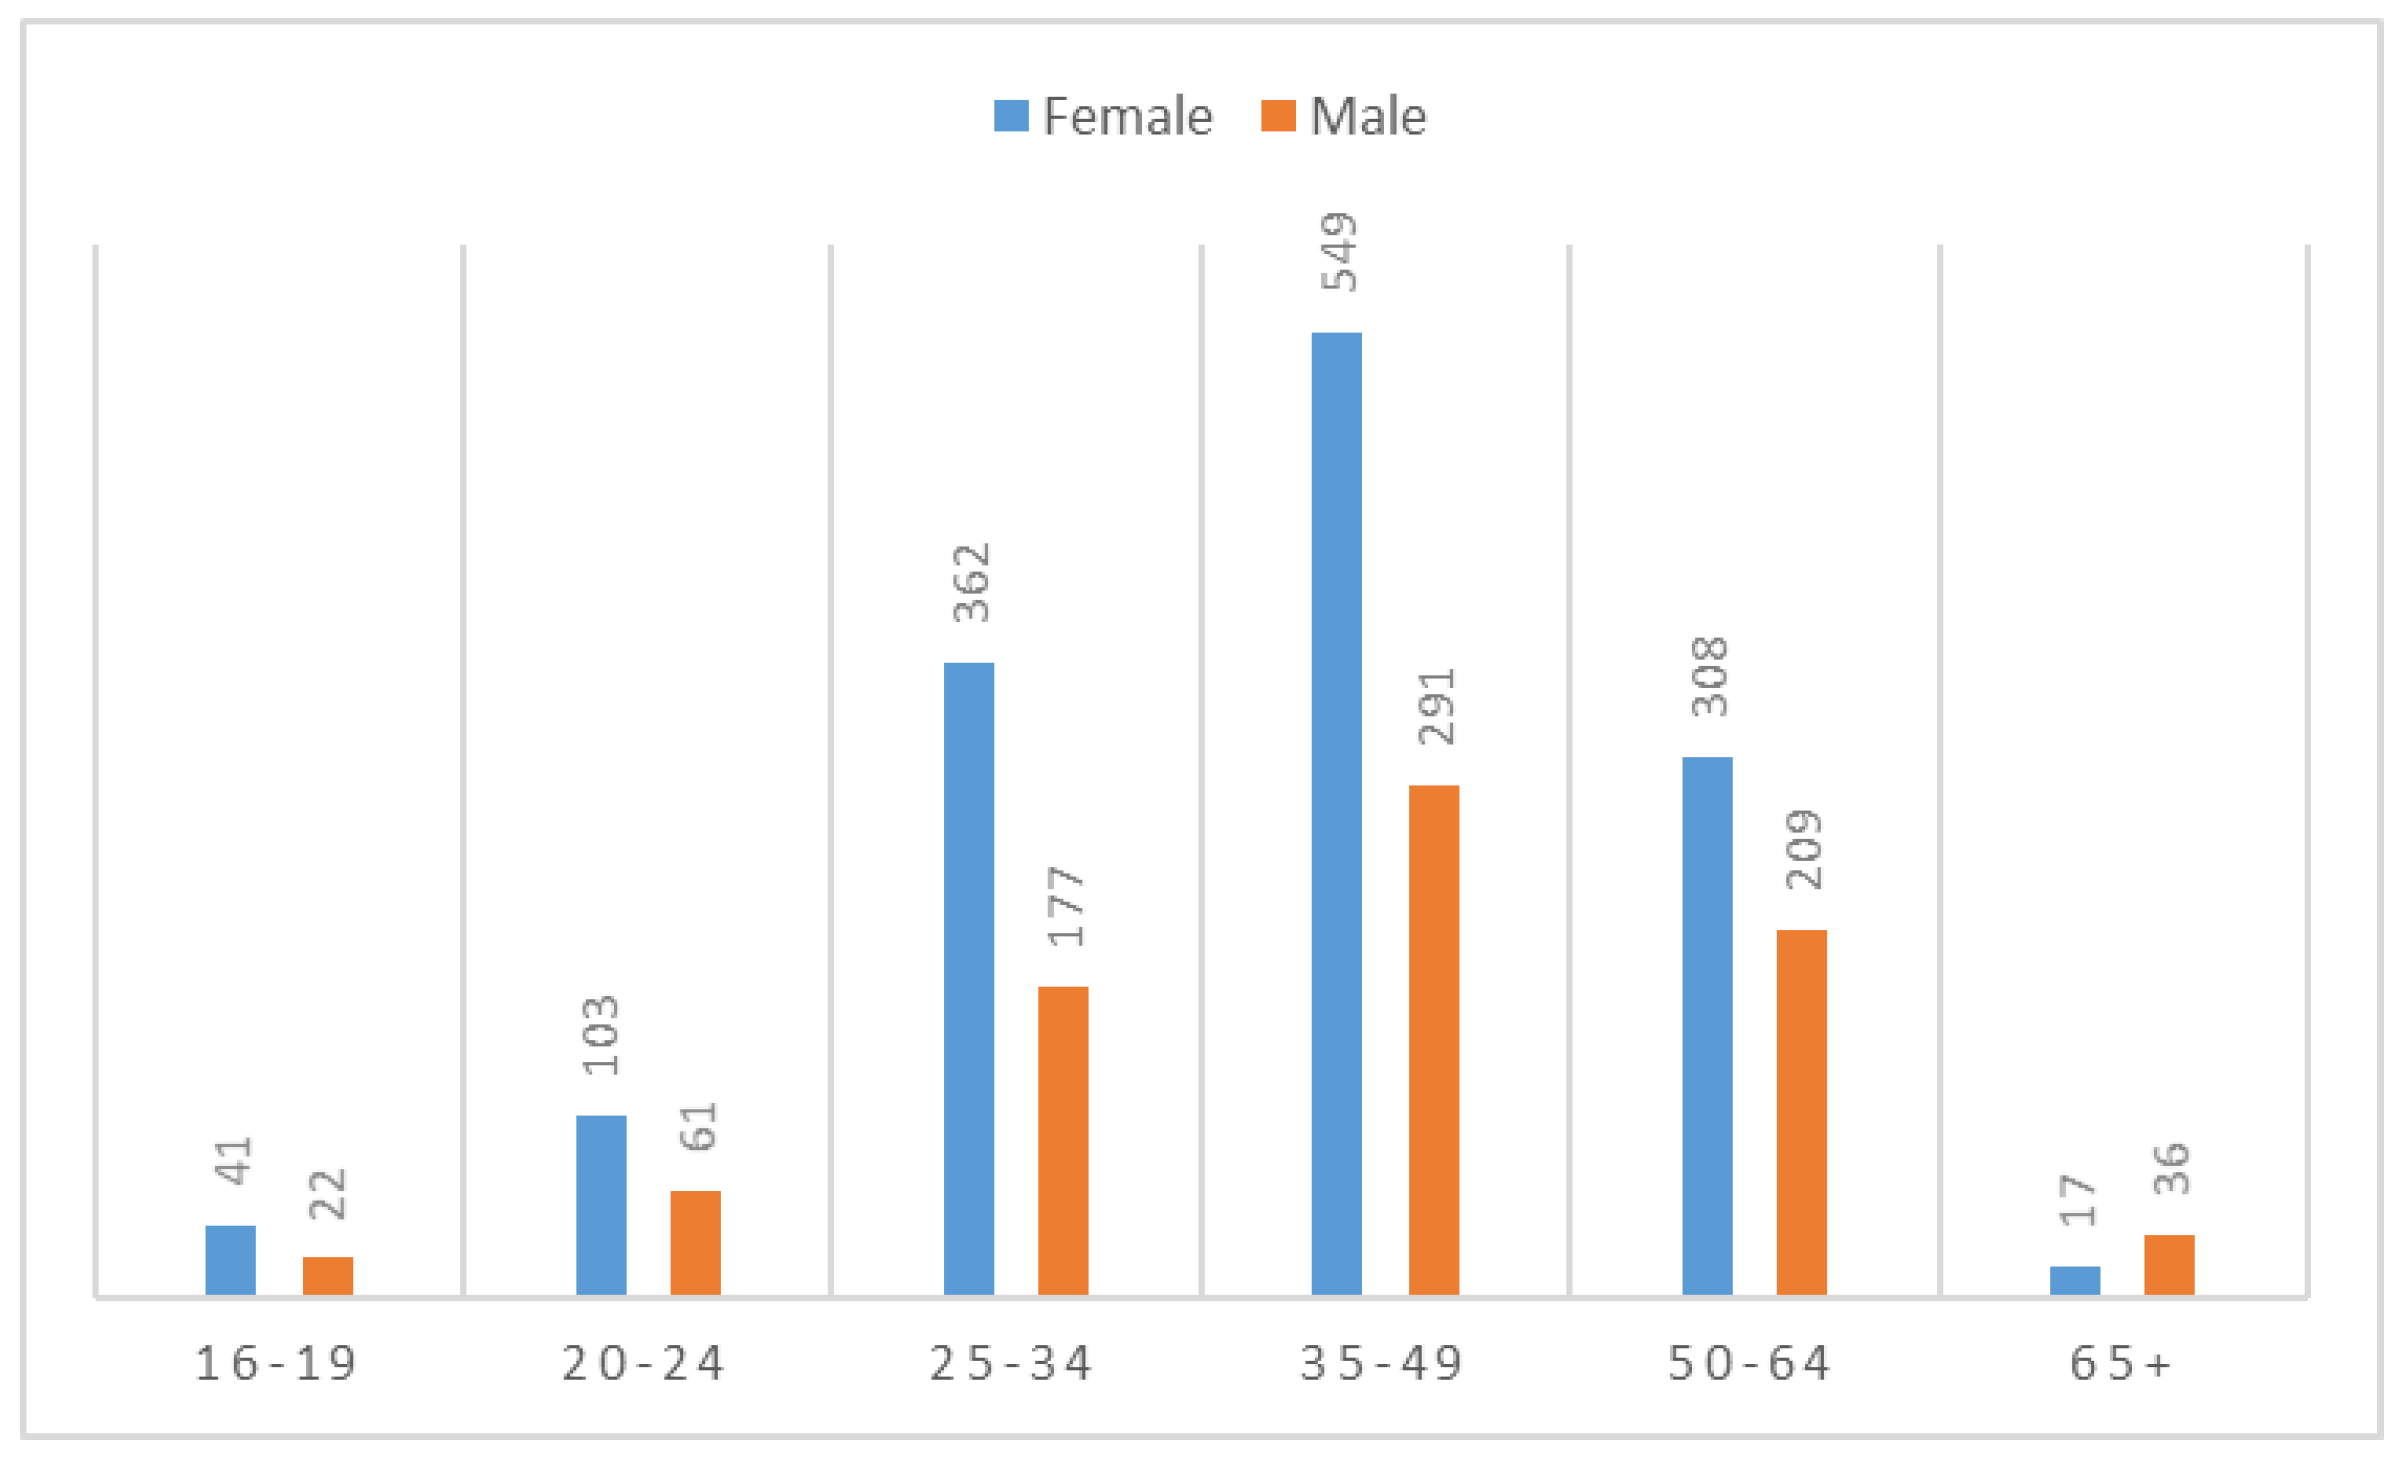
2.2. Participants
2.3. Data Storage
2.4. Data Analyses
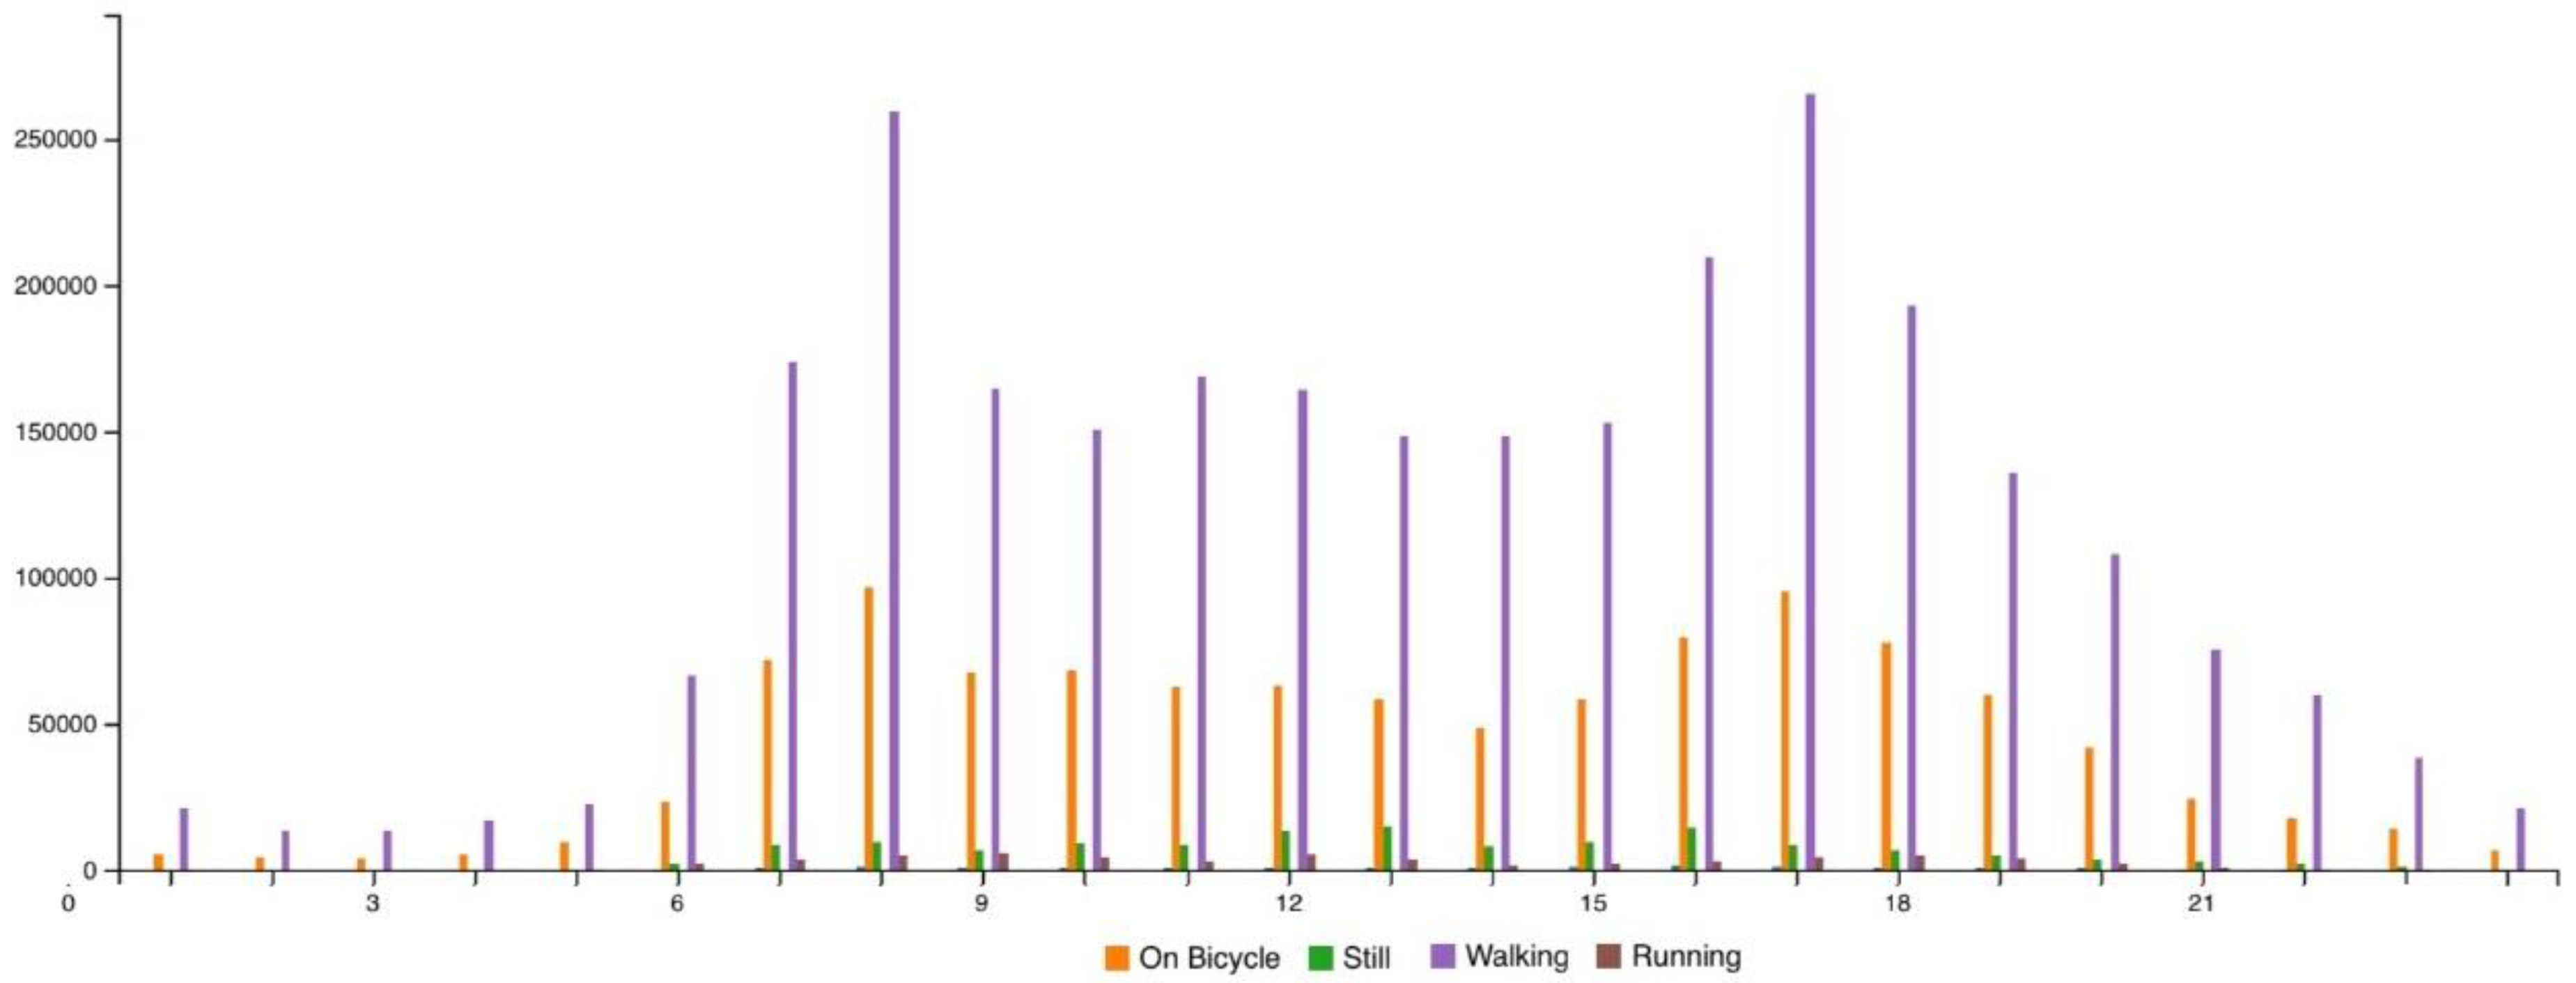
3. Results
4. Discussion
- Very high scalability: collection can be easily made from thousands of participants with little additional effort.
- Low cost: once the apps are written the additional cost per user is effectively zero.
- High reliability: users are already motivated to charge their phones and carry them with them.
- Low reactivity: activity detection is automatic and users do not need to interact with the app.
- Smartphones are not carried for all activities (e.g., swimming), and so will underestimate activity.
- Not everyone has access to a smartphone, or the digital literacy to be able to use one. This may disproportionally apply to older people.
- There is a cost to the user in battery life and memory. Whilst we have attempted to minimise this, some users will consequently uninstall the app.
- The data are sensitive and must be carefully secured against unauthorised access.
- The app didn’t work well on all phones, particular iPhones prior to 5 s and older Android OS versions. This often led to users uninstalling the app.
5. Conclusions
Acknowledgments
Conflicts of Interest
References
- Department of Health. Start Active, Stay Active: A Report on Physical Activity for Health from the Four Home Countries Chief Medical Officers; Department of Health: London, UK, 2011. [Google Scholar]
- King, D.M.; Jacobson, S.H. What is driving obesity? A review on the connections between obesity and motorized transportation. Curr. Obes. Rep. 2017, 6, 3–9. [Google Scholar] [PubMed]
- Celis-Morales, C.A.; Lyall, D.M.; Welsh, P.; Anderson, J.; Steell, L.; Guo, Y.; Maldonado, R.; Mackay, D.F.; Pell, J.P.; Sattar, N.; et al. Association between active commuting and incident cardiovascular disease, cancer, and mortality: Prospective cohort study. BMJ 2017, 357, j1456. [Google Scholar] [CrossRef] [PubMed]
- Rojas-Rueda, D.; de Nazelle, A.; Tainio, M.; Nieuwenhuijsen, M.J. The health risks and benefits of cycling in urban environments compared with car use: Health impact assessment study. BMJ 2011, 343, d4521. [Google Scholar] [CrossRef] [PubMed]
- Andersen, L.B. Active commuting is beneficial for health. BMJ 2017, 357, j1740. [Google Scholar] [CrossRef] [PubMed]
- Saunders, L.E.; Green, J.M.; Petticrew, M.P.; Steinbach, R.; Roberts, H. What are the health benefits of active travel? A systematic review of trials and cohort studies. PLoS ONE 2013, 8, e69912. [Google Scholar]
- Oliver, M.; Badland, H.; Mavoa, S.; Duncan, M.J.; Duncan, S. Combining GPS, GIS, and accelerometry: Methodological issues in the assessment of location and intensity of travel behaviors. J. Phys. Act. Health 2010, 7, 102–108. [Google Scholar] [CrossRef] [PubMed]


Publisher’s Note: MDPI stays neutral with regard to jurisdictional claims in published maps and institutional affiliations. |
© 2018 by the authors. Licensee MDPI, Basel, Switzerland. This article is an open access article distributed under the terms and conditions of the Creative Commons Attribution (CC BY) license (https://creativecommons.org/licenses/by/4.0/).
Share and Cite
Heller, B.W.; Mazumdar, S.; Ciravegna, F. Large Scale, Long-Term, High Granularity Measurement of Active Travel Using Smartphones Apps. Proceedings 2018, 2, 293. https://doi.org/10.3390/proceedings2060293
Heller BW, Mazumdar S, Ciravegna F. Large Scale, Long-Term, High Granularity Measurement of Active Travel Using Smartphones Apps. Proceedings. 2018; 2(6):293. https://doi.org/10.3390/proceedings2060293
Chicago/Turabian StyleHeller, Ben W., Suvodeep Mazumdar, and Fabio Ciravegna. 2018. "Large Scale, Long-Term, High Granularity Measurement of Active Travel Using Smartphones Apps" Proceedings 2, no. 6: 293. https://doi.org/10.3390/proceedings2060293
APA StyleHeller, B. W., Mazumdar, S., & Ciravegna, F. (2018). Large Scale, Long-Term, High Granularity Measurement of Active Travel Using Smartphones Apps. Proceedings, 2(6), 293. https://doi.org/10.3390/proceedings2060293