Proceeding Paper

CSMA Neighbors Identification in Body Sensor Networks †

Griffith School of Engineering, Griffith University, Brisbane QLD 4111, Australia
*
Author to whom correspondence should be addressed.
Presented at the 12th Conference of the International Sports Engineering Association, Brisbane, Queensland, Australia, 26–29 March 2018.
Proceedings 2018, 2(6), 291; https://doi.org/10.3390/proceedings2060291
Published: 23 February 2018

Abstract

:
A CSMA algorithm was implemented and tested using 2.45 GHz wearable sensors on five human subjects moving in formation. The algorithm forces the nodes to repeatedly sense the carrier frequency to recognize when other nodes are in/out of coverage. The paper reports different sink nodes location on the body and the effect of transmitter power on the reliability. The results showed 100% successful wireless communications between sink nodes within coverage. Allowing this information to be available in real time have a significant importance on measuring up athlete proximity and performance with respect to time spent on one or multiple locations.

1. Introduction

Wireless Sensors Networks (WSN) features include low-power wireless transmission, advanced sensor technology and highly functional microcontrollers. These devices have facilitated new levels of wireless interaction with the environment and between humans. Within the many applications in which WSN can make a significant contribution, one field, in particular, involves the use of this technology over the human body [1,2]. The ongoing quest for improved athlete performance has resulted in the adoption of these sensors as an assessment tool for training accuracy and monitoring players motion [3]. Sensor nodes collect relevant information, transmit the data and perform computational operations. An example of real-time physical monitoring networks is presented in [4], in which the system help classifies the body activity by recognizing the angles calculated from the acceleration segments. Another body network uses a unique method for measuring the angular motion of an arm swing in golf by placing an accelerometer sensor at the grip end of the club [5].
Careful consideration of important characteristics of Body Sensor Network (BSN), such as sensing accuracy, long lifetime and network latency, is essential as weak wireless links and node failures reduce BSN reliability. Moreover, node physical design and dimensions allow the network to be more user-friendly by overcoming any hindrance to the natural movement of the body and support the nodes placement on the body [6]. One important problem associated with BSN is the negative effect of body movement on the wireless connection. For example, the absorption of a wireless signal through the body, and the distortion resulted from body parts entering the path between transmit and receive units [7].

2. System and Measurement Settings

2.45 GHz wireless nodes with accelerometer sensors were used as sink nodes. These sink nodes are capable of controlling the transmissions of other nodes attached to the player body [8,9]. Additional details with regards to the node hardware design and functionality can be found in [10]. All measurements were conducted in an outdoor environment to minimize possible multipath effects from nearby objects. The nodes were configured to transmit and receive data at different power levels and body locations to identify cell coverage. Figure 1a shows the sink nodes attached to a participant’s chest, shoulder and head. It also shows another node located on the sport field ground that acts as an access point and transfers the captured information to a laptop through the SPI peripherals while the results are displayed.

3. Sink Node Coverage and Location Selection

During the coverage tests, the Tx node was programmed to transmit information at a fixed rate of 100 Hz while changing the node locations and transmitting power. The Rx node recorded the information and calculated the percentage of packets lost for every second of transmission. These percentages are used to measure the link reliability between the transmitting and receiving nodes. Throughout the tests, the Tx node was attached to a human subject who was asked to walk past the Rx node which was either attached to another participant body or fixed on the ground. The difference in distance between the nodes started from a negative value (−6 m) when the two participants are facing each other, and reaches a zero value when the participants are in-line with each other, and end at a positive value (+6 m) when they were back to back as shown in Figure 1b.

3.1. Human to Human Communication

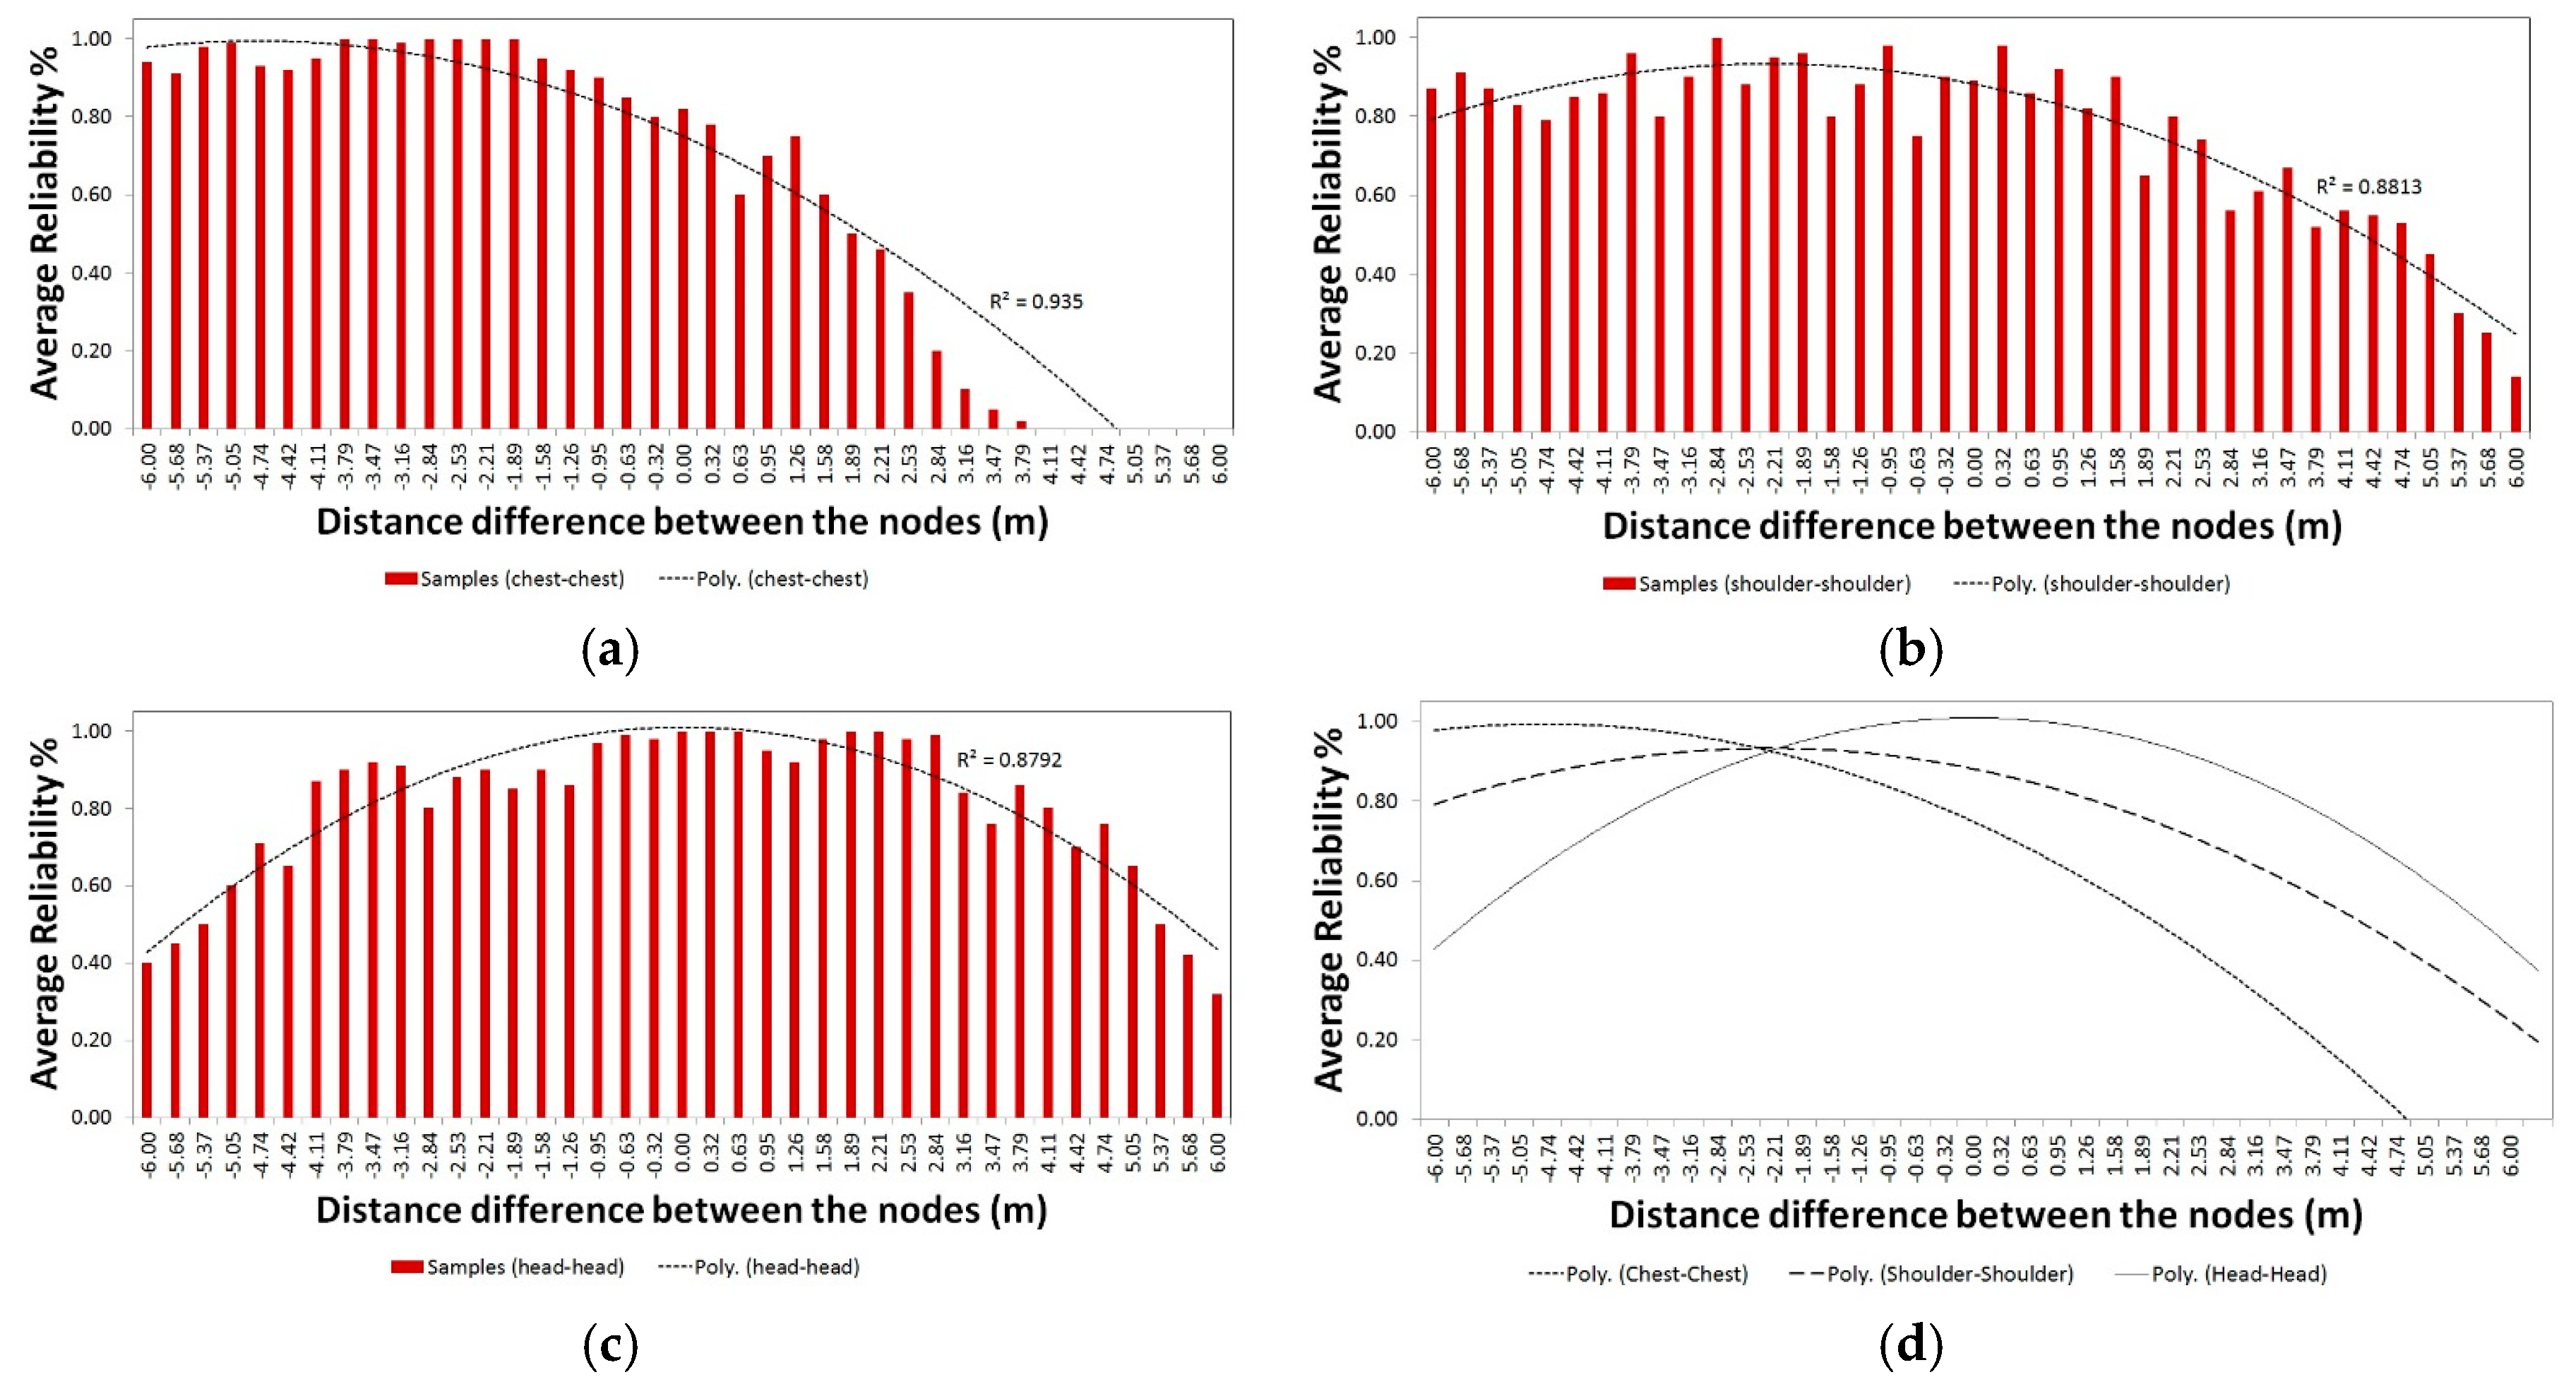
Both the transmitter and receiver nodes were attached to human bodies to validate the off body connection reliability with respect to the nodes coverage as shown in Figure 2. A reliability ratio of “1” indicates no losses in the transmission and all packets were successfully received, while reliability average ratio of “0” indicates 100% data loss and no packets have been received.
The results of placing the nodes on the chest are shown in Figure 2a. A connection reliability ratio of 90–100% was recorded when the two participants face each other, however, this ratio starts to fall to around 75% as the difference in the distance becomes zero. The reliability ratio continues to fall to less than 10% as the line of sight between the sink nodes disappears when the subjects are back to back at a distance of around 4 m. Figure 2b shows the recorded reliability sample ratios with the nodes attached to participant’s shoulder. Similarly, to the chest location, the reliability ratio falls when passing the zero point to reach a value of around 35% at a distance of 6 meters. Placing the sink nodes on the participant’s head shows a bell shape results where the reliability ratio are almost evenly distributed around the zero point distance, with high-reliability values closer to 100% when the distance difference between the sink nodes is minimal. The reliability values fall to around 40% when there is a difference of 6 meters as shown in Figure 2c.
All of the recorded samples in Figure 2 were fitted into polynomial functions of a 2nd order to show the correlation between the reliability and coverage of sink nodes.
The coefficient of determination (R2) showed a good fit for all modules of Figure 2, with values of 0.93, 0.88 and 0.87 for the chest to chest, shoulder to shoulder and head to head connection modules, respectively. By comparing the curve fittings shown in Figure 2d the sink nodes communication placed on the heads shows the most promise location when the athletes are moving. This is mainly because of the average reliability pattern comparable to the normal distribution, which ensures normal operation of wireless transmission within the nodes coverage even when the nodes are not facing each other. Otherwise for fixed wireless operation scenarios when the players are always facing each other, the chest and shoulder location for sink nodes can result in wider coverage boundaries. The node coverage can be defined as a function of the wireless reliability, and therefore different coverage can be obtained for different reliability. Choosing a link reliability of 80% or higher can yield in a node coverage of around 5 meters for the head and chest locations, and 6 meters for the shoulder location.

3.2. Human to Environment Communication

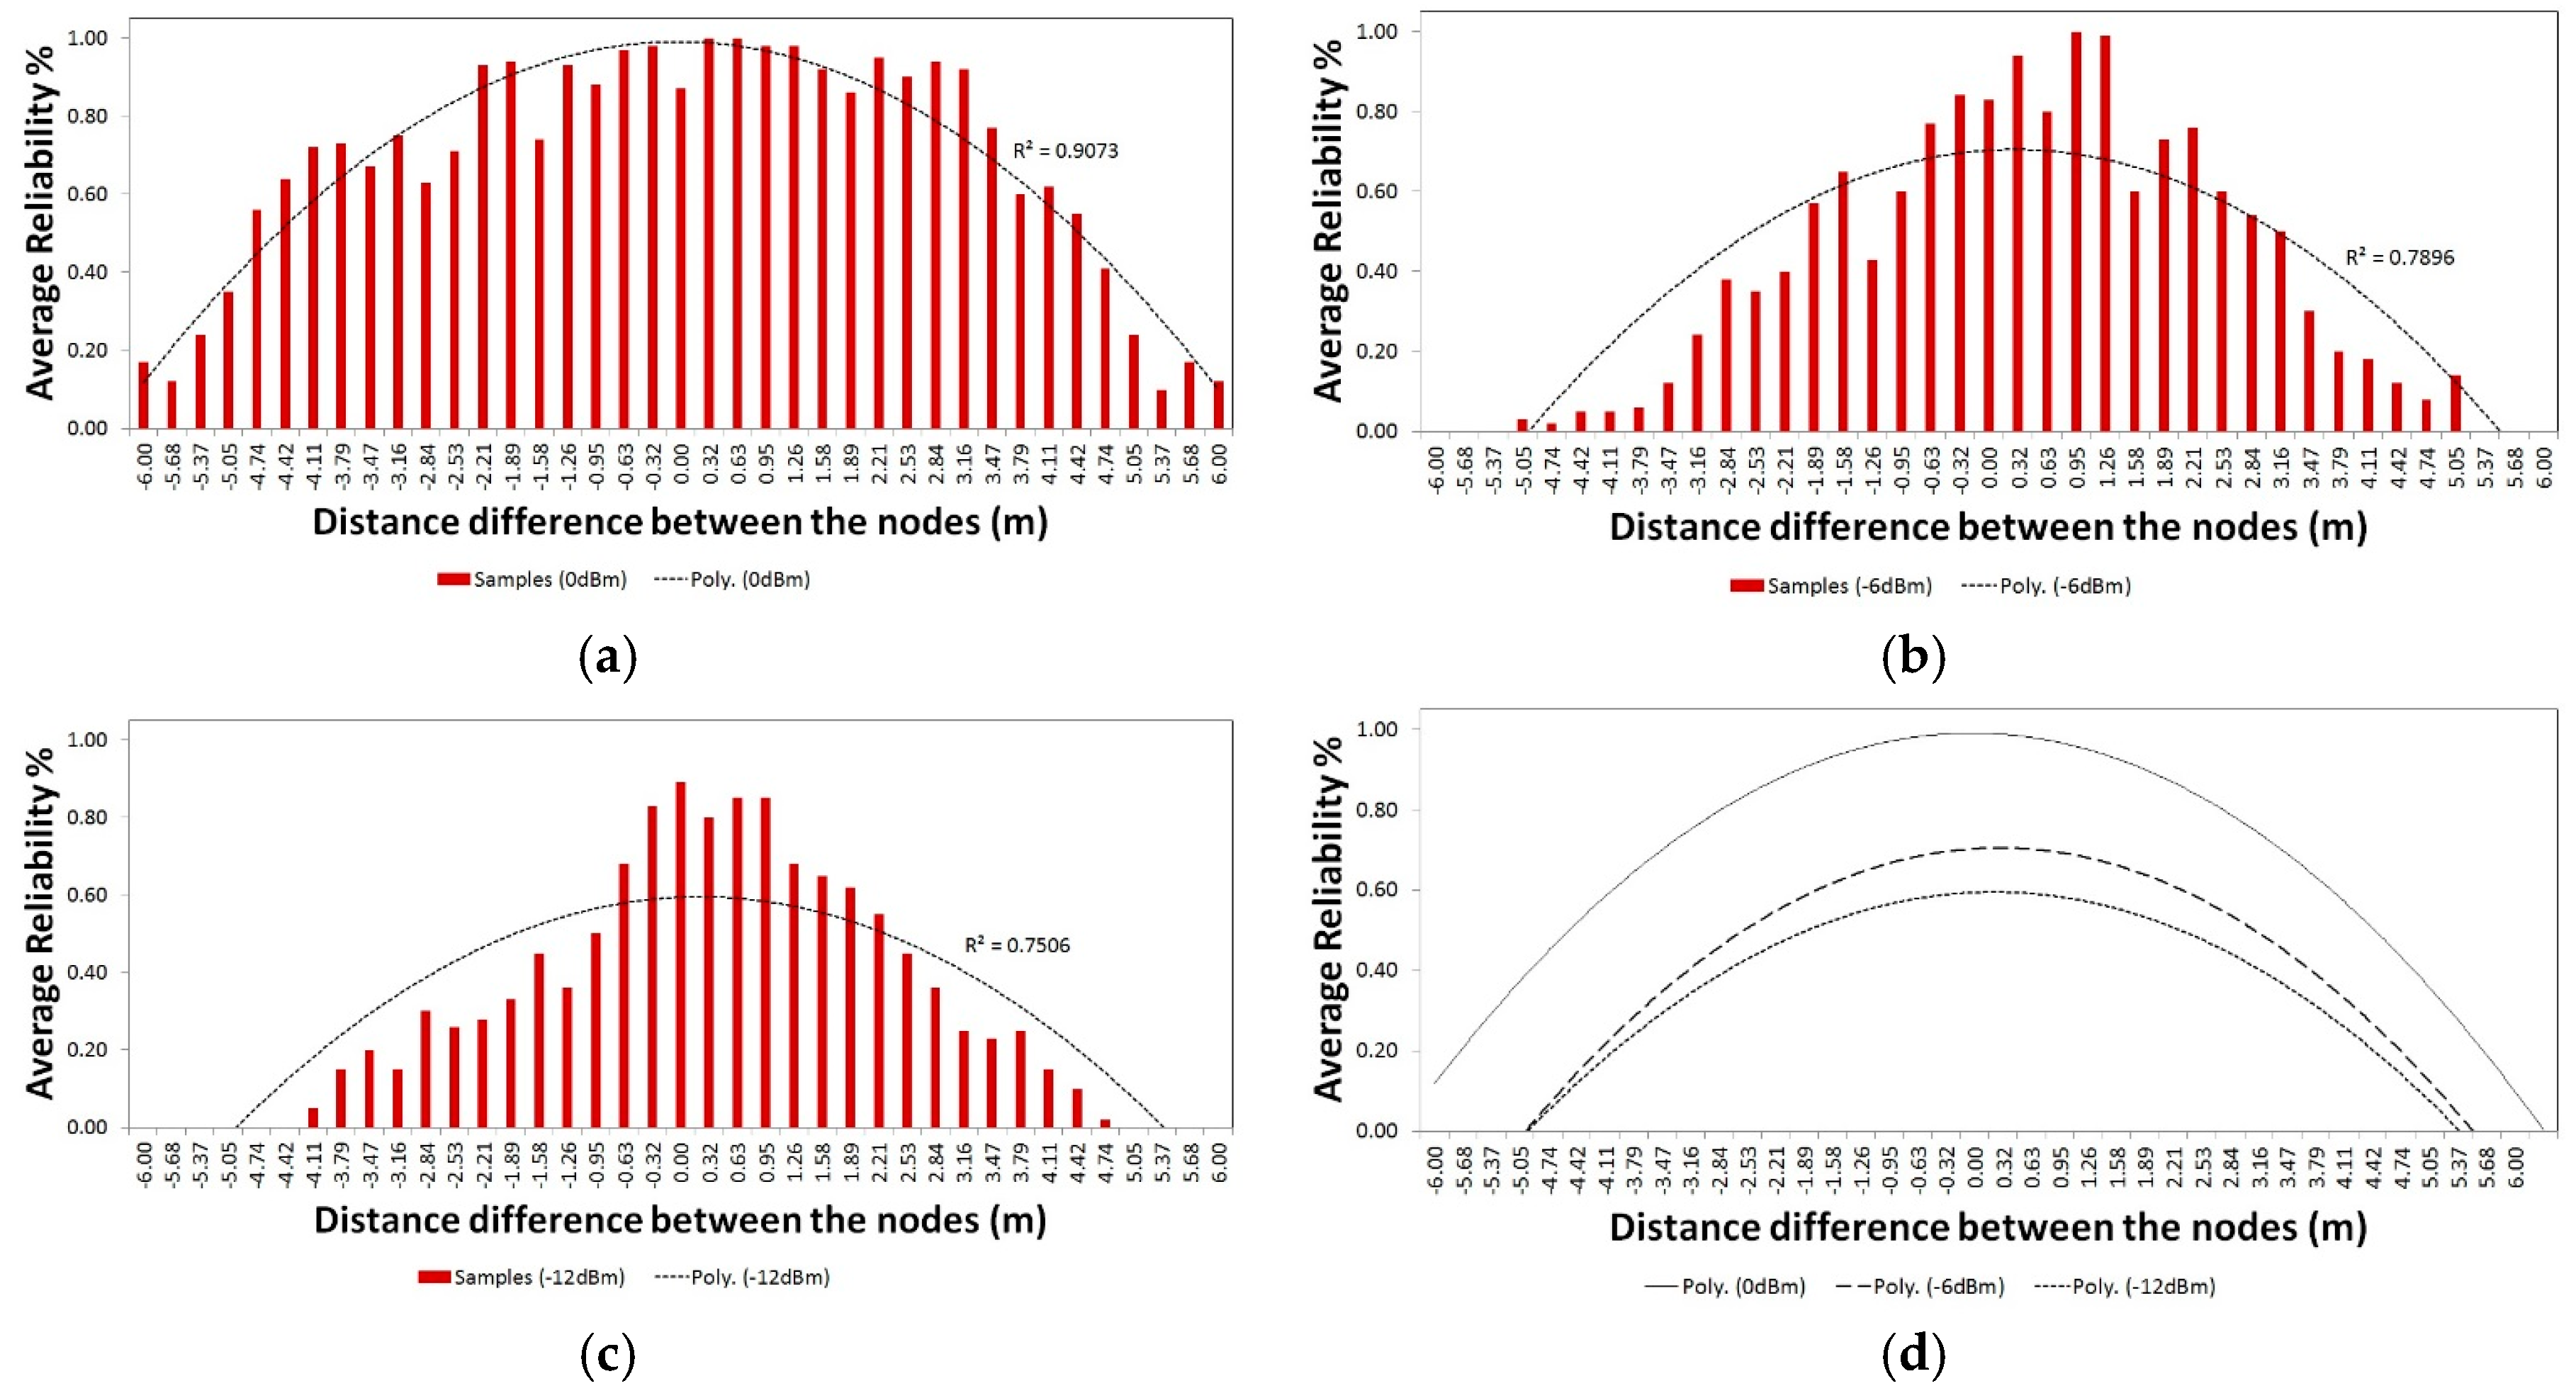
Different transmission power levels were applied when the Tx node was attached to the participant’s head and the Rx node was placed at the field ground to verify the off body connection reliability as shown in Figure 3. Similar to the previous results, polynomial functions of a 2nd order was used as a regression line to approximate the real data points. Three tests were conducted and the Tx node was programmed to work at different power modes; 0 dBm, −6 dBm and −12 dBm, respectively. Because of the height difference between the transmitting and receiving ground node (this was negligible value in the human to human communication tests), Rx node with an external antenna and power amplifier as shown in Figure 1a was used to establish and test the connection for different power levels.
All plots show an approximate normal distribution of the average reliability pattern when the Tx node was attached to the head. The size of the change in link reliability and distance with respect to the power levels is shown in Figure 3a–c. A comparison between the fitted curves of the recorded reliability ratios can be seen in Figure 3d. It shows that a transmitter power of 0 dBm provided a wider node coverage compare to utilizing a −12 dBm power. Moreover, the link reliability was affected greatly when transmitting at low powers. For example, −12 dBm power level resulted in 50% maximum reliability around zero-point distance compared to a 95% maximum reliability when transmitting at the higher power of 0 dBm. This means that there is 50% chance of losing the information even when a player is standing at the point where the Rx node is placed and −12 dBm transmission power is used.
The number of nodes required to establish a network covering a whole sport field depends on the transmission power of these nodes (i.e., node coverage). There are many advantages of transmitting at lower power levels; it can save power consumption of the nodes and provide a longer network lifetime, and increase the resolution in detecting a player position on the field. However, more nodes are required when the coverage area is reduced. Furthermore, the network reliability is reduced at lower power levels and this can decrease the probability of data delivery.

4. Neighbor Identification in Changing Environment

All experiments involved placing the nodes on the head position of five participants. The nodes were programmed to send information with a transmission power of 0 dBm and 100 Hz. This was based on the results of the previous tests which involved selection of the best location of a sink node.
To simulate random movements similar to a training session/actual game on the sport field, the five participants were positioned over a small area in an outdoor sports field and asked to move around to a preconfigured location as shown in Figure 4a. The dynamic movement of these players will result in a constant change in their locations with respect to each other, and therefore, the coverage’s area of new nodes will intersect with some but not others. These dynamic changes result in an adjusted neighbour list that can cause interference problems. To avoid co-channel interference that happens when nodes transmit at the same time, especially when they become within each other’s coverage after a lost connection. A self-awareness algorithm was designed to identify the new/old neighbours for each node, as follows:
  • Each sink node is a smart node that can identify neighbouring nodes in the changing environment. If a sink node goes off the network grid, it will know that other nodes are out of wireless range;
  • The nodes use the CSMA (carrier sensing multiple access) techniques, where each node has a different wait time set up in their initial receive mode before they can switch to transmit their information;
  • The initial receive time for the transceiver nodes are set to be the multipliers of the time required for a single transmission to avoid network conjunction;
  • When transmitting, the nodes send out their new neighbour lists and time of existence of all neighbours, as well as their unique node number to identify where the transmission come from;
  • When listening, the nodes identify where packets come from and save this information. They subtract the preconfigured waiting period of received nodes from their initial waiting period before transmitting, to modify and reduce the total waiting time of all nodes;
  • As the nodes are moving continuously, neighbours are changing for each node. Every change defines a new overall coverage and the number of nodes within range. For every change, the nodes record the times and node information.
  • The nodes were programmed to spend 100 ms to complete carriers sensing and transmitting cycle. This period can increase when increasing the sink nodes in the network, as there may be more carriers to be monitored.
Figure 4a shows three positions for which the participants were asked to move to in a specific order. For instance, participant with sink Node3 started within the coverage range of sink Nodes1 & 2, then moved down the field where there were no nodes in range, and then went to the right part of the field to join Node4. While participant with sink Node1 stayed in his position during the whole test, Nodes2 & 3 moved away from his coverage. During this test all nodes were configured with the neighbor’s identification algorithm. Table 1 shows the information received by each node including the modified neighbors list for all sink nodes at each position, these results confirms the functionality of the algorithm and reflects the expected neighbor for the movements. In the same way, when comparing the movement of sink Node4 from Figure 4 with the neighbor lists in Table 1, shows exactly the anticipated change in the neighbor list as the nodes dynamically change their locations. Figure 4b shows the total time of neighbor existence for all sink nodes during the participant movement through all of the predefined positions in the dynamic neighbor identification experiment. Throughout the test time, results have showed that Node2 has the highest number of neighbors (4) and time of existence of those neighbors (≈8 s) in its list. While Node1 has the least number of neighbors (2) and time of existence (≈3.5 s). All of these successful communications between the participants at each stage of the test and the total time they spent within each other coverage, can help the coach to draw the conclusion that the participant with Node2 had more interaction with the other nodes than participant with Node1.
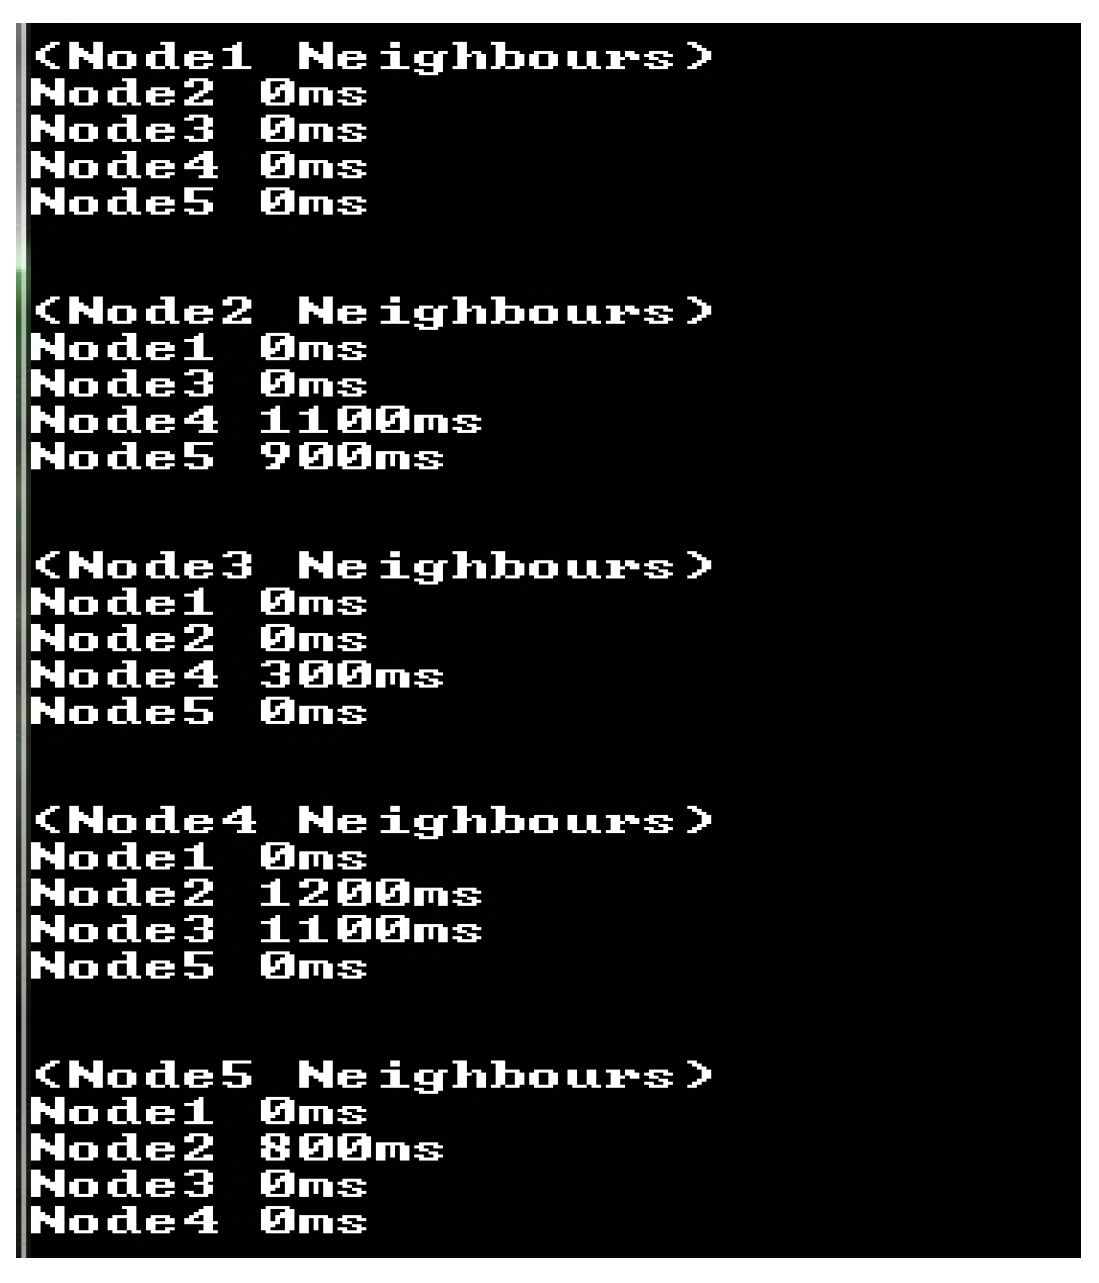
The test also involved the use of a sink node with an external antenna and power amplifier which was placed on the ground to retrieve network information and mark the position of the players on the field. The ground node was connected to a laptop computer to display real-time updates of the neighbours and time of existence in the neighbour list for each node as shown in Figure 5. Once a player is within the ground node coverage all information can be retrieved by the ground node. Employing more ground nodes that act as access points will support identifying a player position on the field. This can help the coach to recognize players are running and playing together while others stand in their position with respect to movement and time. In other cases where there is no access point and only one end communication is set up at a specific location, the nodes can utilize this algorithm to identify nearby neighbours and choose the best route technique to deliver information that is collected through one or multi-hop transmission.

5. Conclusions

The wireless connection reliability was measured at different locations on the human body, namely, chest, shoulder and head. This measurement was used to identify the best sink node position for a human to human/ground communications. A smart adaptation algorithm employed the carrier sensing multiple access (CSMA) techniques to detect moving neighbours in the vicinity of sink nodes. The results presented an effective operation of the designed algorithm that can provide significant feedback to the coaches during training sessions. Future work can include a triangulation calculation scheme that estimates the distance between the players on the field based on their connection reliabilities with other ground sink nodes.

Conflicts of Interest

The authors declare no conflict of interest.

References

  1. Dhamdhere, A.; Hao, C.; Kurusingal, A.; Sivaraman, V.; Burdett, A. Experiments with wireless sensor networks for real-time athlete monitoring. In Proceedings of the 2010 IEEE 35th Conference on Local Computer Networks (LCN), Denver, CO, USA, 10–14 October 2010; pp. 938–945. [Google Scholar]
  2. Merentitis, A.; Kranitis, N.; Paschalis, A.; Gizopoulos, D. Low energy online self-test of embedded processors in dependable WSN nodes. IEEE Trans. Dependable Secure Comput. 2012, 9, 86–100. [Google Scholar] [CrossRef]
  3. Llosa, J.; Vilajosana, I.; Vilajosana, X.; Marques, J. Design of a motion detector to monitor rowing performance based on wireless sensor networks. In Proceedings of the 2009 International Conference on Intelligent Networking and Collaborative Systems, Barcelona, Spain, 4–6 November 2009; pp. 397–400. [Google Scholar]
  4. Wu, J.; Dong, L.; Xiao, W. Real-time physical activity classification and tracking using wearable sensors Information. In Proceedings of the 2007 6th International Conference on Information, Communications & Signal Processing, Singapore, 10–13 December 2007; pp. 1–6. [Google Scholar]
  5. Ueda, M.; Negoro, H.; Kurihara, Y.; Watanabe, K. Measurement of angular motion in golf swing by a local sensor at the grip end of a golf club. IEEE Trans. Hum. Mach. Syst. 2013, 43, 398–404. [Google Scholar] [CrossRef]
  6. Xiong, L.; Soon, L.; Taher, T. Unrestrained measurement of arm motion based on a wearable wireless sensor network. IEEE Trans. Instrum. Meas. 2010, 59, 1309–1317. [Google Scholar]
  7. Varnoosfaderani, M.; Thiel, D.; Lu, J. External parasitic elements on clothing for improved performance of wearable antennas. IEEE Sens. J. 2015, 15, 307–315. [Google Scholar] [CrossRef]
  8. Sabti, H.; Thiel, D. Node position effect on link reliability for body centric wireless network running applications. IEEE Sens. J. 2014, 14, 2687–2691. [Google Scholar] [CrossRef]
  9. Sabti, H.; Thiel, D. A study of wireless communication links on a body centric network during running. Proc. Eng. 2014, 72, 3–8. [Google Scholar] [CrossRef]
  10. Sabti, H.; Thiel, D. Self-calibrating body sensor network based on periodic human movements. IEEE Sens. J. 2015, 15, 1552–1558. [Google Scholar] [CrossRef]
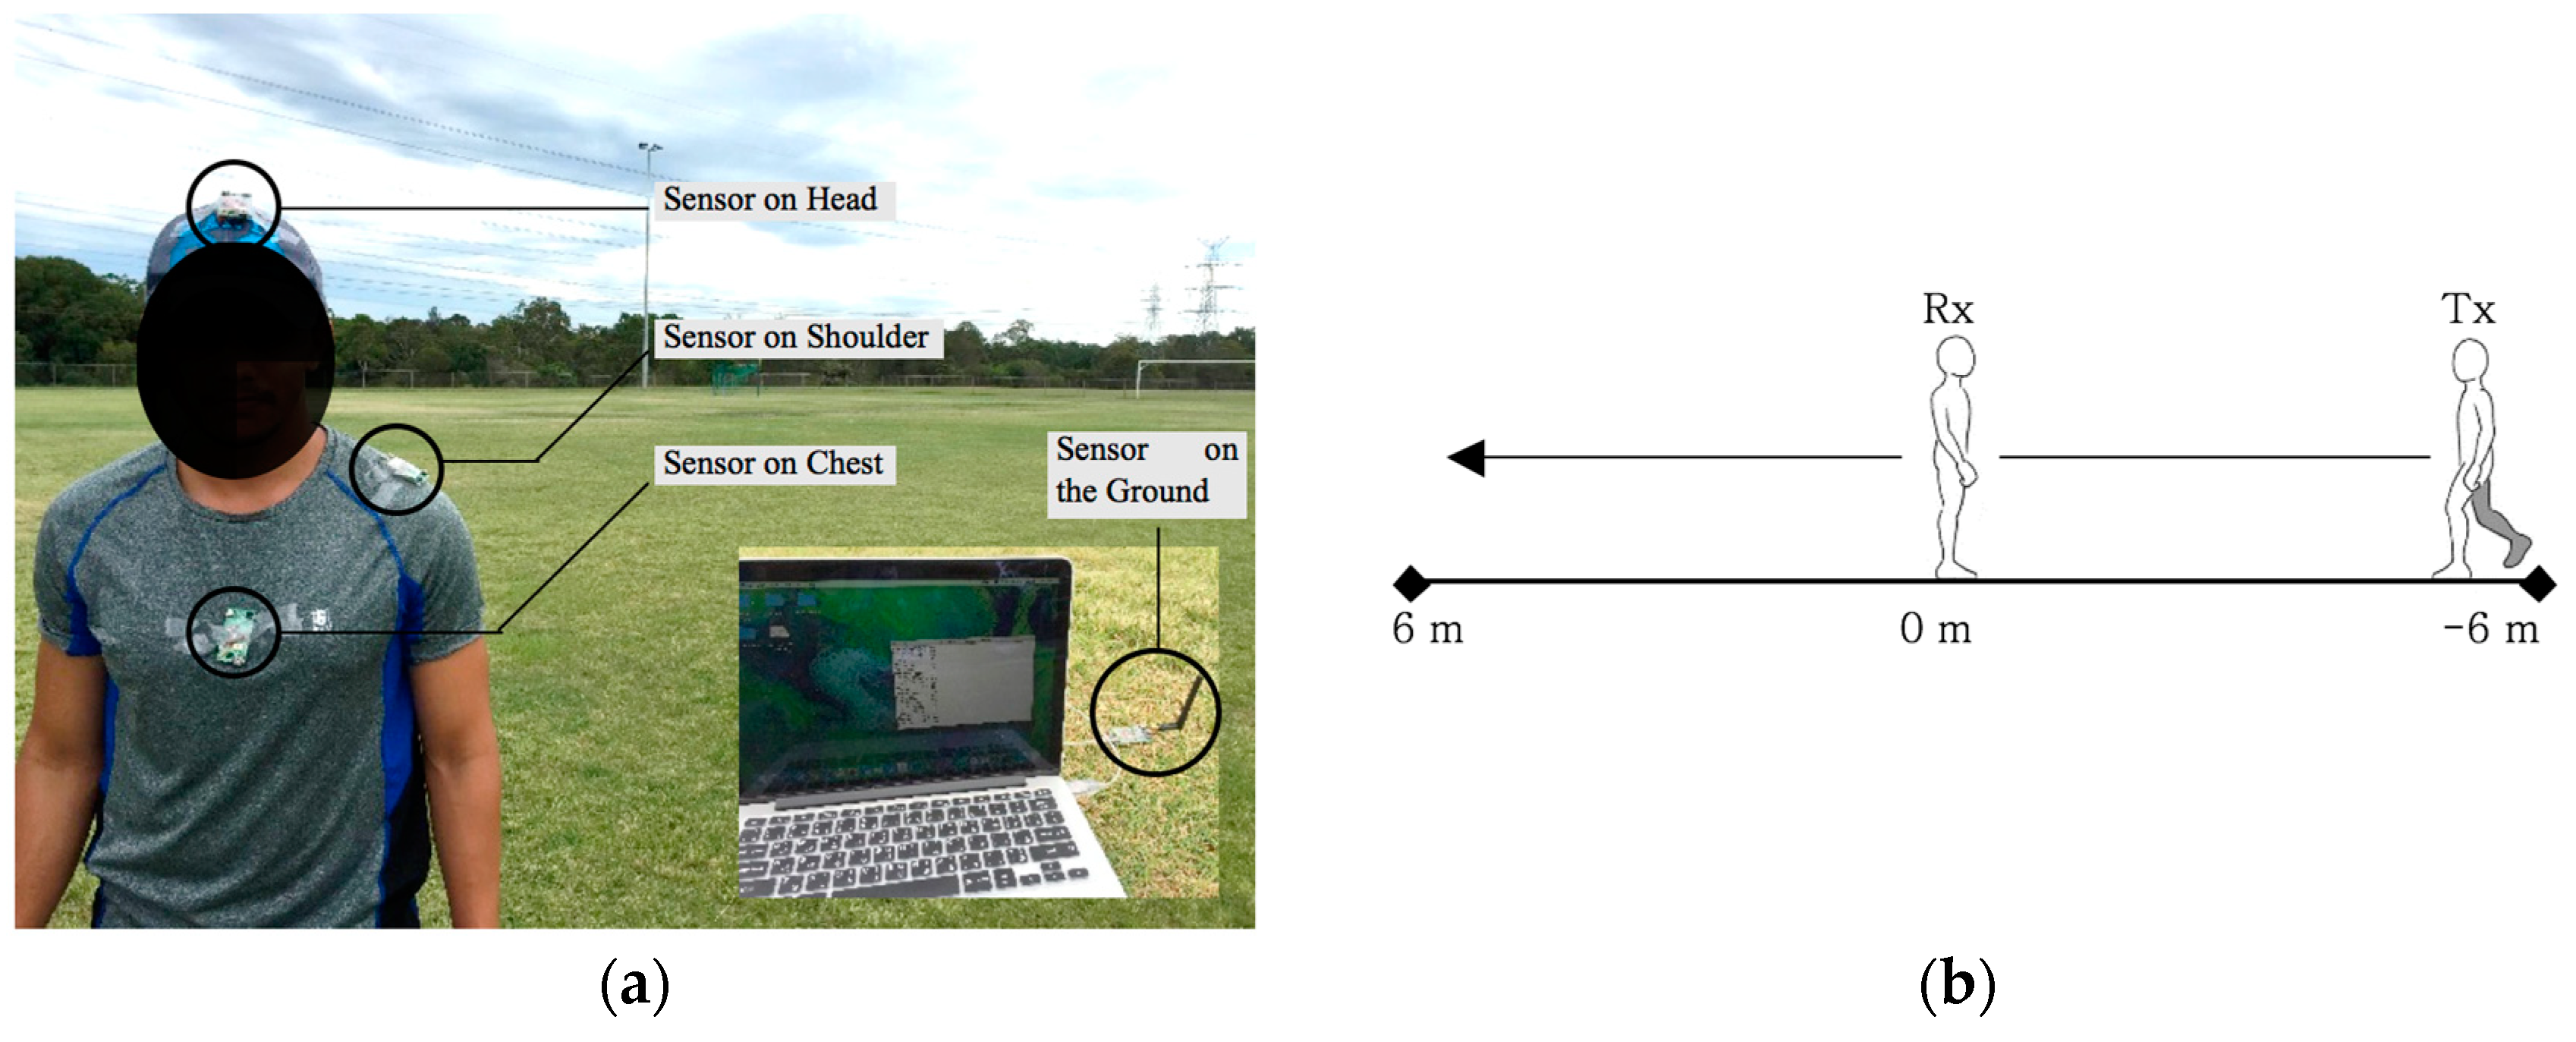
Figure 1. (a) Sink nodes location on a human’s participant and ground sink node implanted in a sport field; (b) Experiment walk path and difference in distance between the transmitting and receiving nodes.
Proceedings 02 00291 g001
Figure 2. Average reliability and 2nd order polynomial fit with respect to the distance difference between sink nodes when attached to the (a) chests; (b) shoulders; (c) heads; (d) comparison.
Proceedings 02 00291 g002
Figure 3. Average reliability and 2nd order polynomial fit with respect to the distance difference between the ground node and sink node attached to a participant’s head while transmitting at a maximum power of (a) 0 dBm; (b) −6 dBm; (c) −12 dBm; (d) comparison.
Proceedings 02 00291 g003
Figure 4. (a) Top view of a plotted sport field shows the dynamic movements of all five nodes for each stage with respect to each other (subjects move in sequence from position 1 to position 2 and position 3); (b) Total time of neighbor list existence for each node during the movement identification experiment.
Proceedings 02 00291 g004
Figure 5. The neighbour’s list and time of existence shown on the ground sink node serial interface.
Proceedings 02 00291 g005
Table 1. Updated list of neighbours identified in all nodes at the three positions.
Node NumberNeighbors at Position 1Neighbors at Position 2Neighbors at Position 3
Node 12,300
Node 21,34,54,5
Node 31,204
Node 452,52,3
Node 542,42
Publisher’s Note: MDPI stays neutral with regard to jurisdictional claims in published maps and institutional affiliations.