The Ring of Fire for in-Field Sport Aerodynamic Investigation †

Abstract
:1. Introduction
2. Methodology
3. Experimental Setup and Procedures
3.1. Experimental Setup
3.2. Data Reduction
4. Results
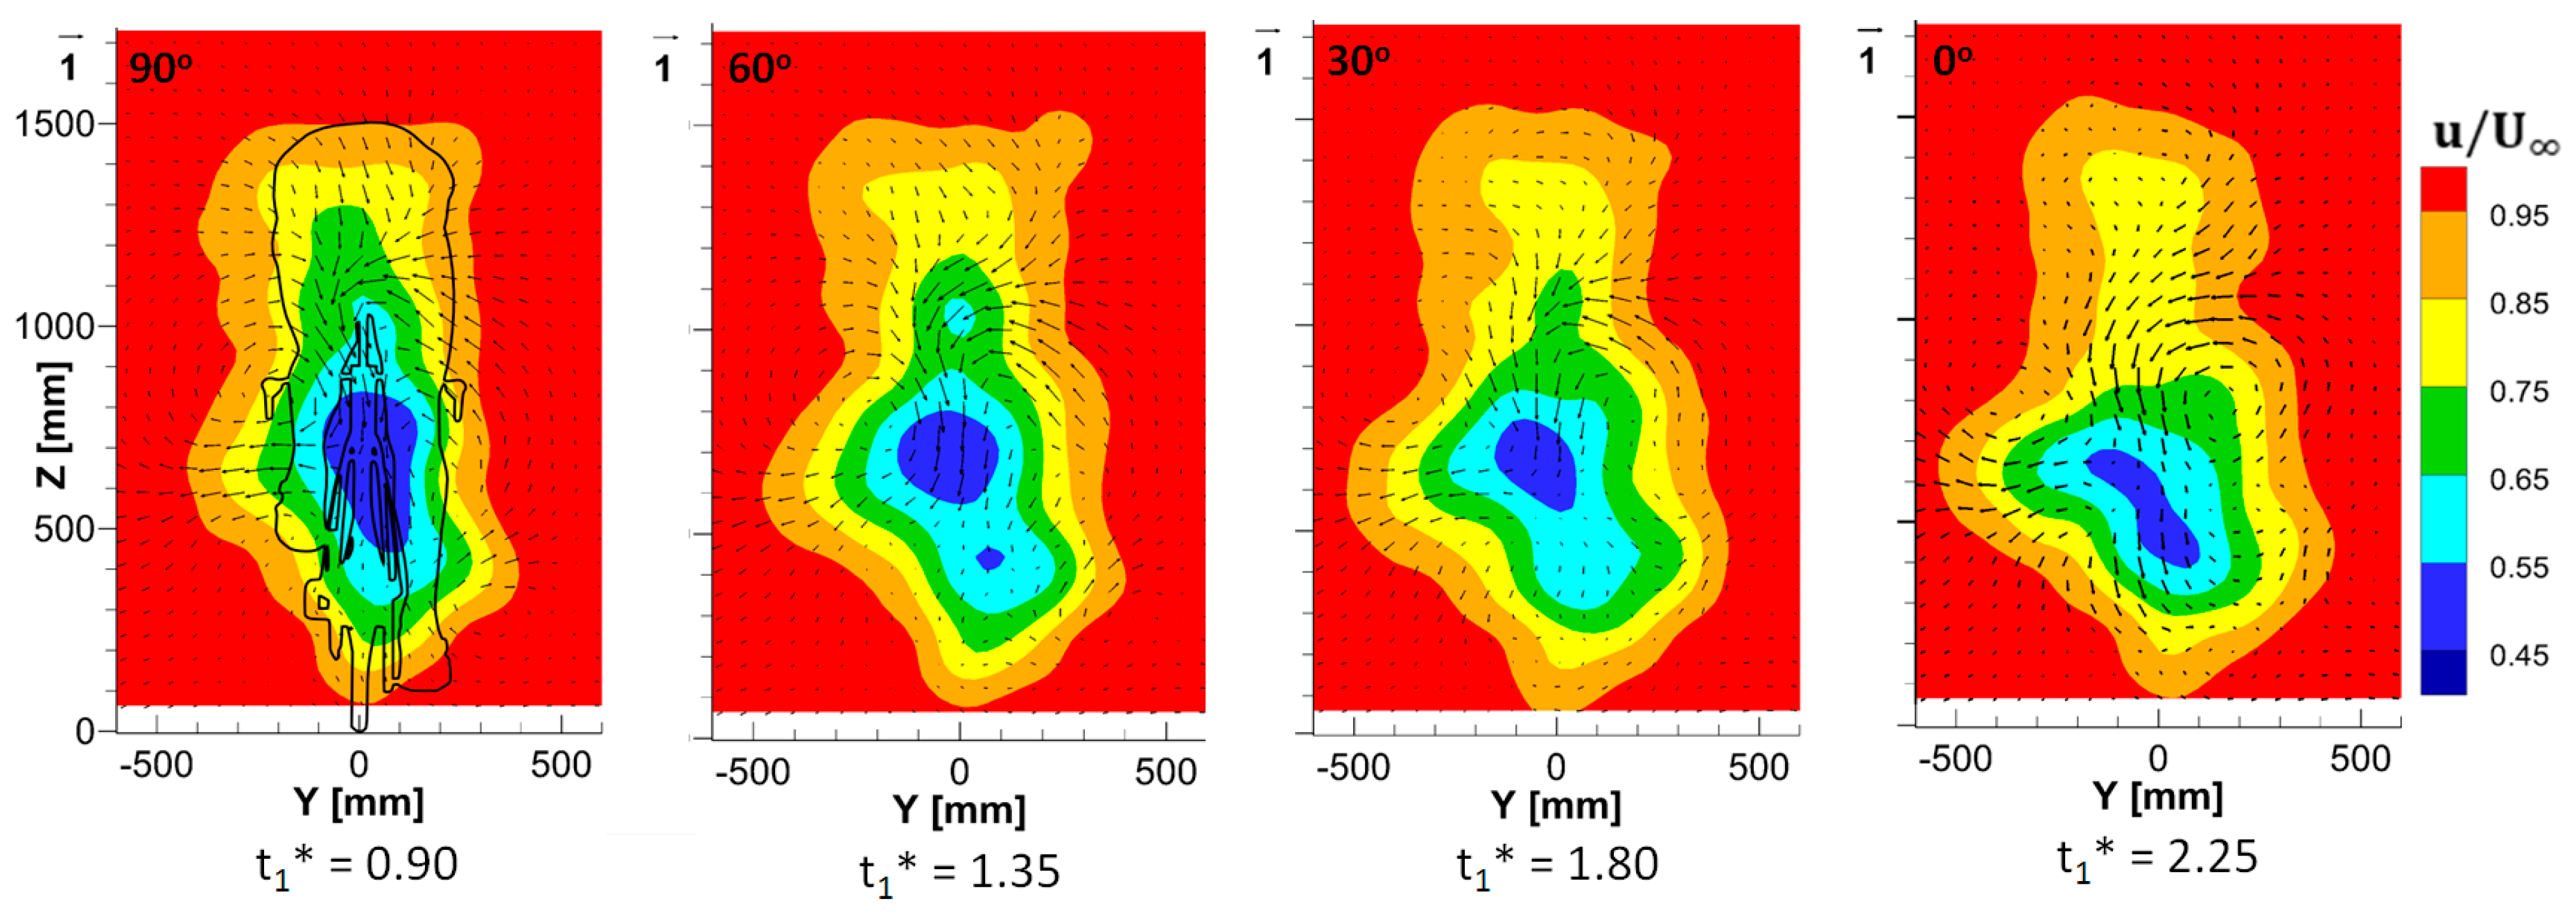
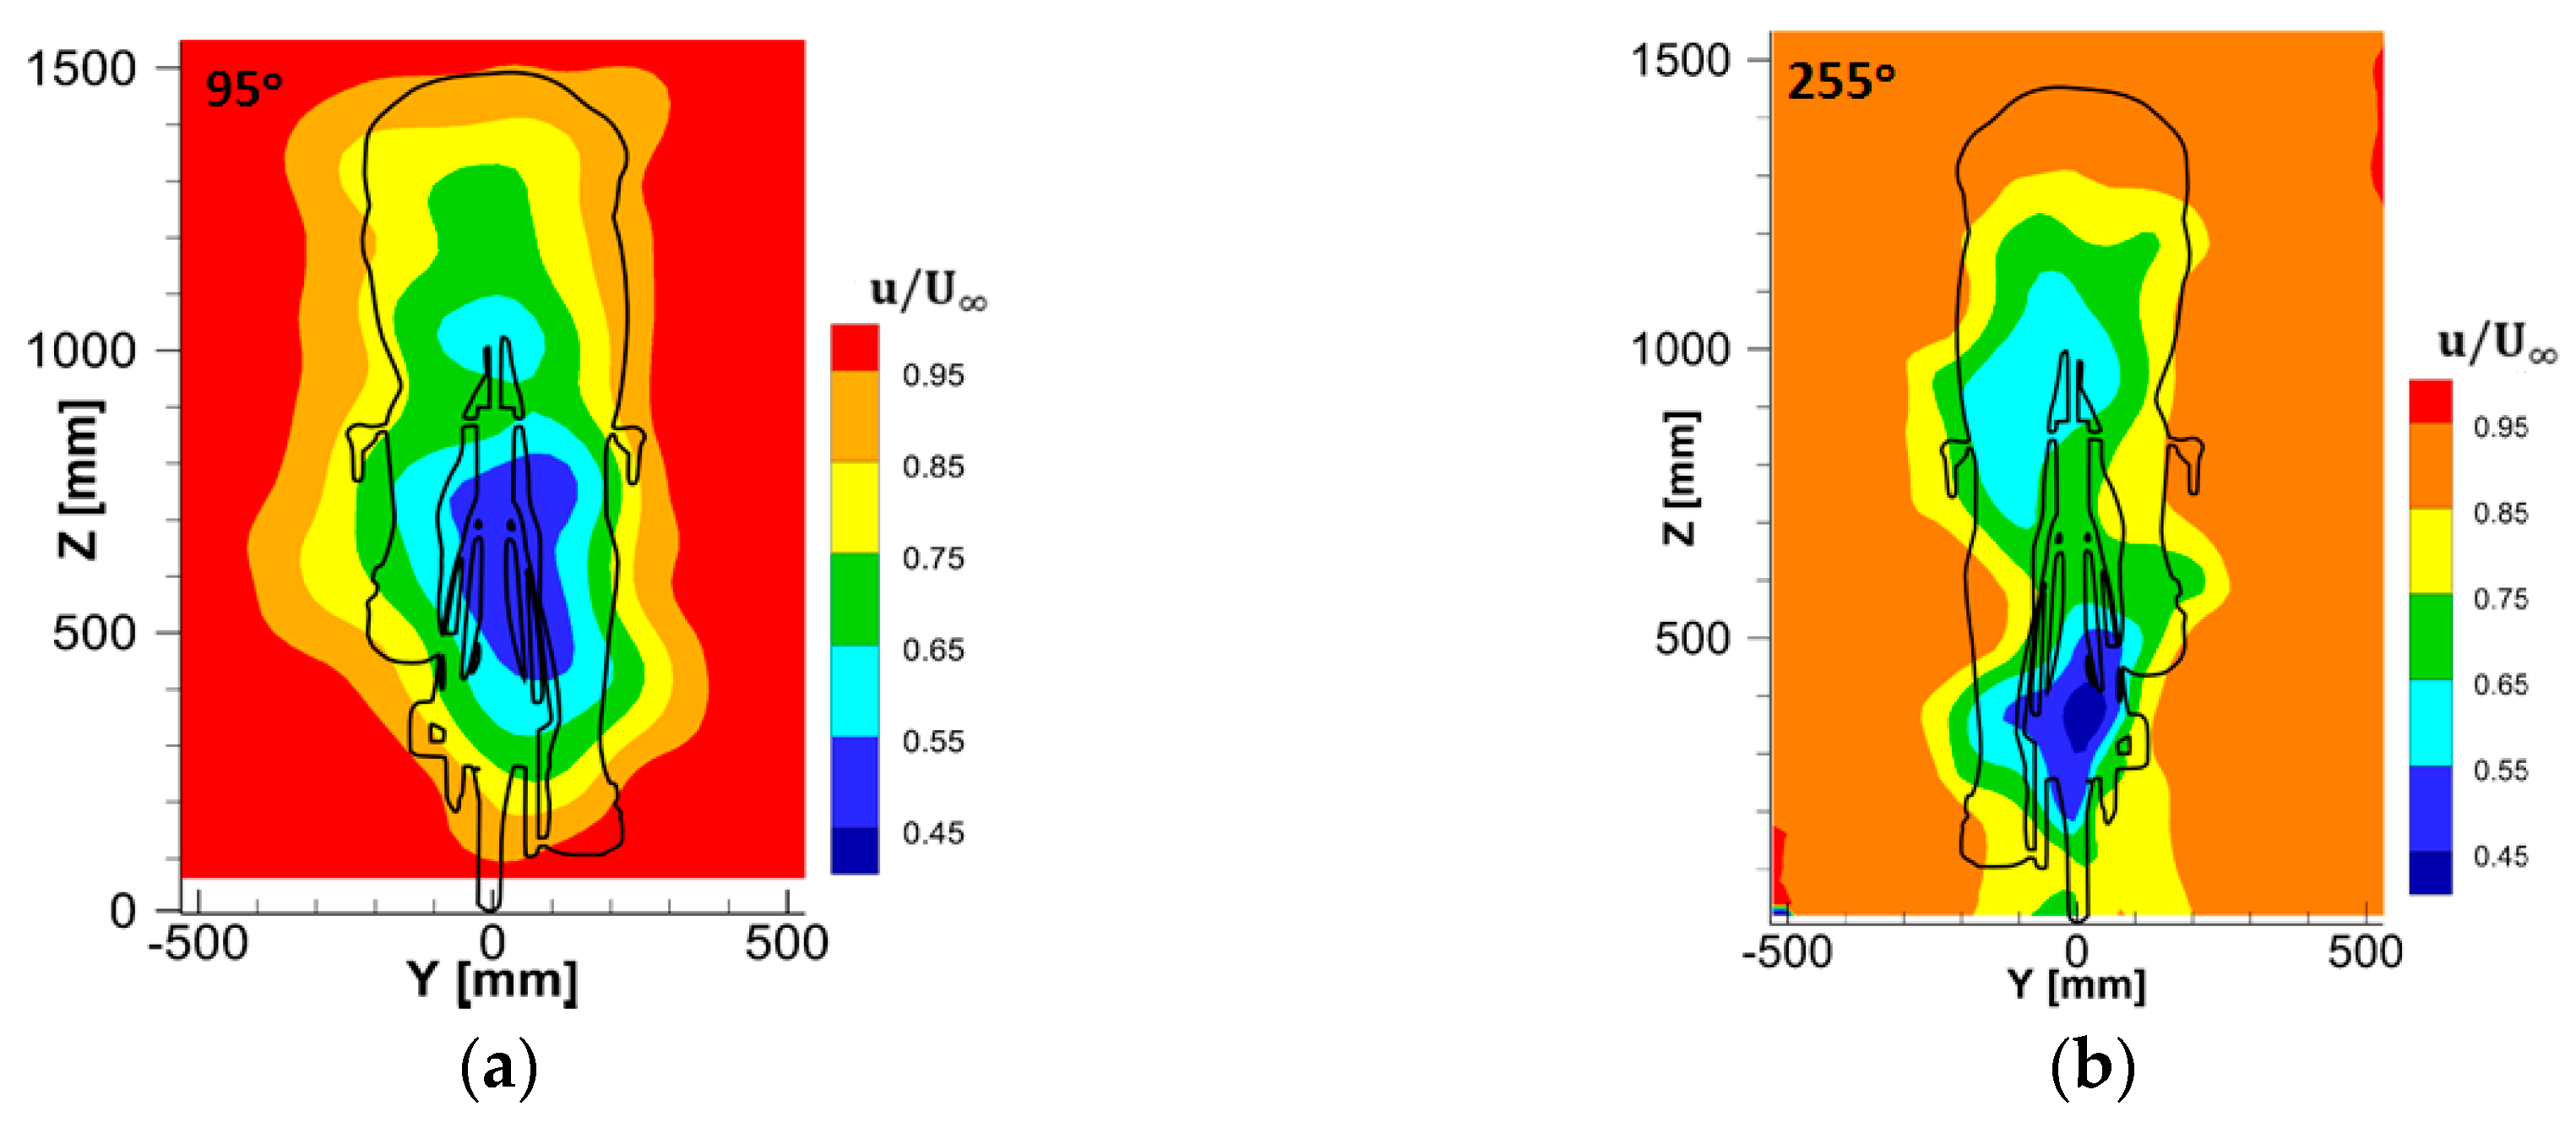
4.1. Flow Topology
4.2. Drag Analysis
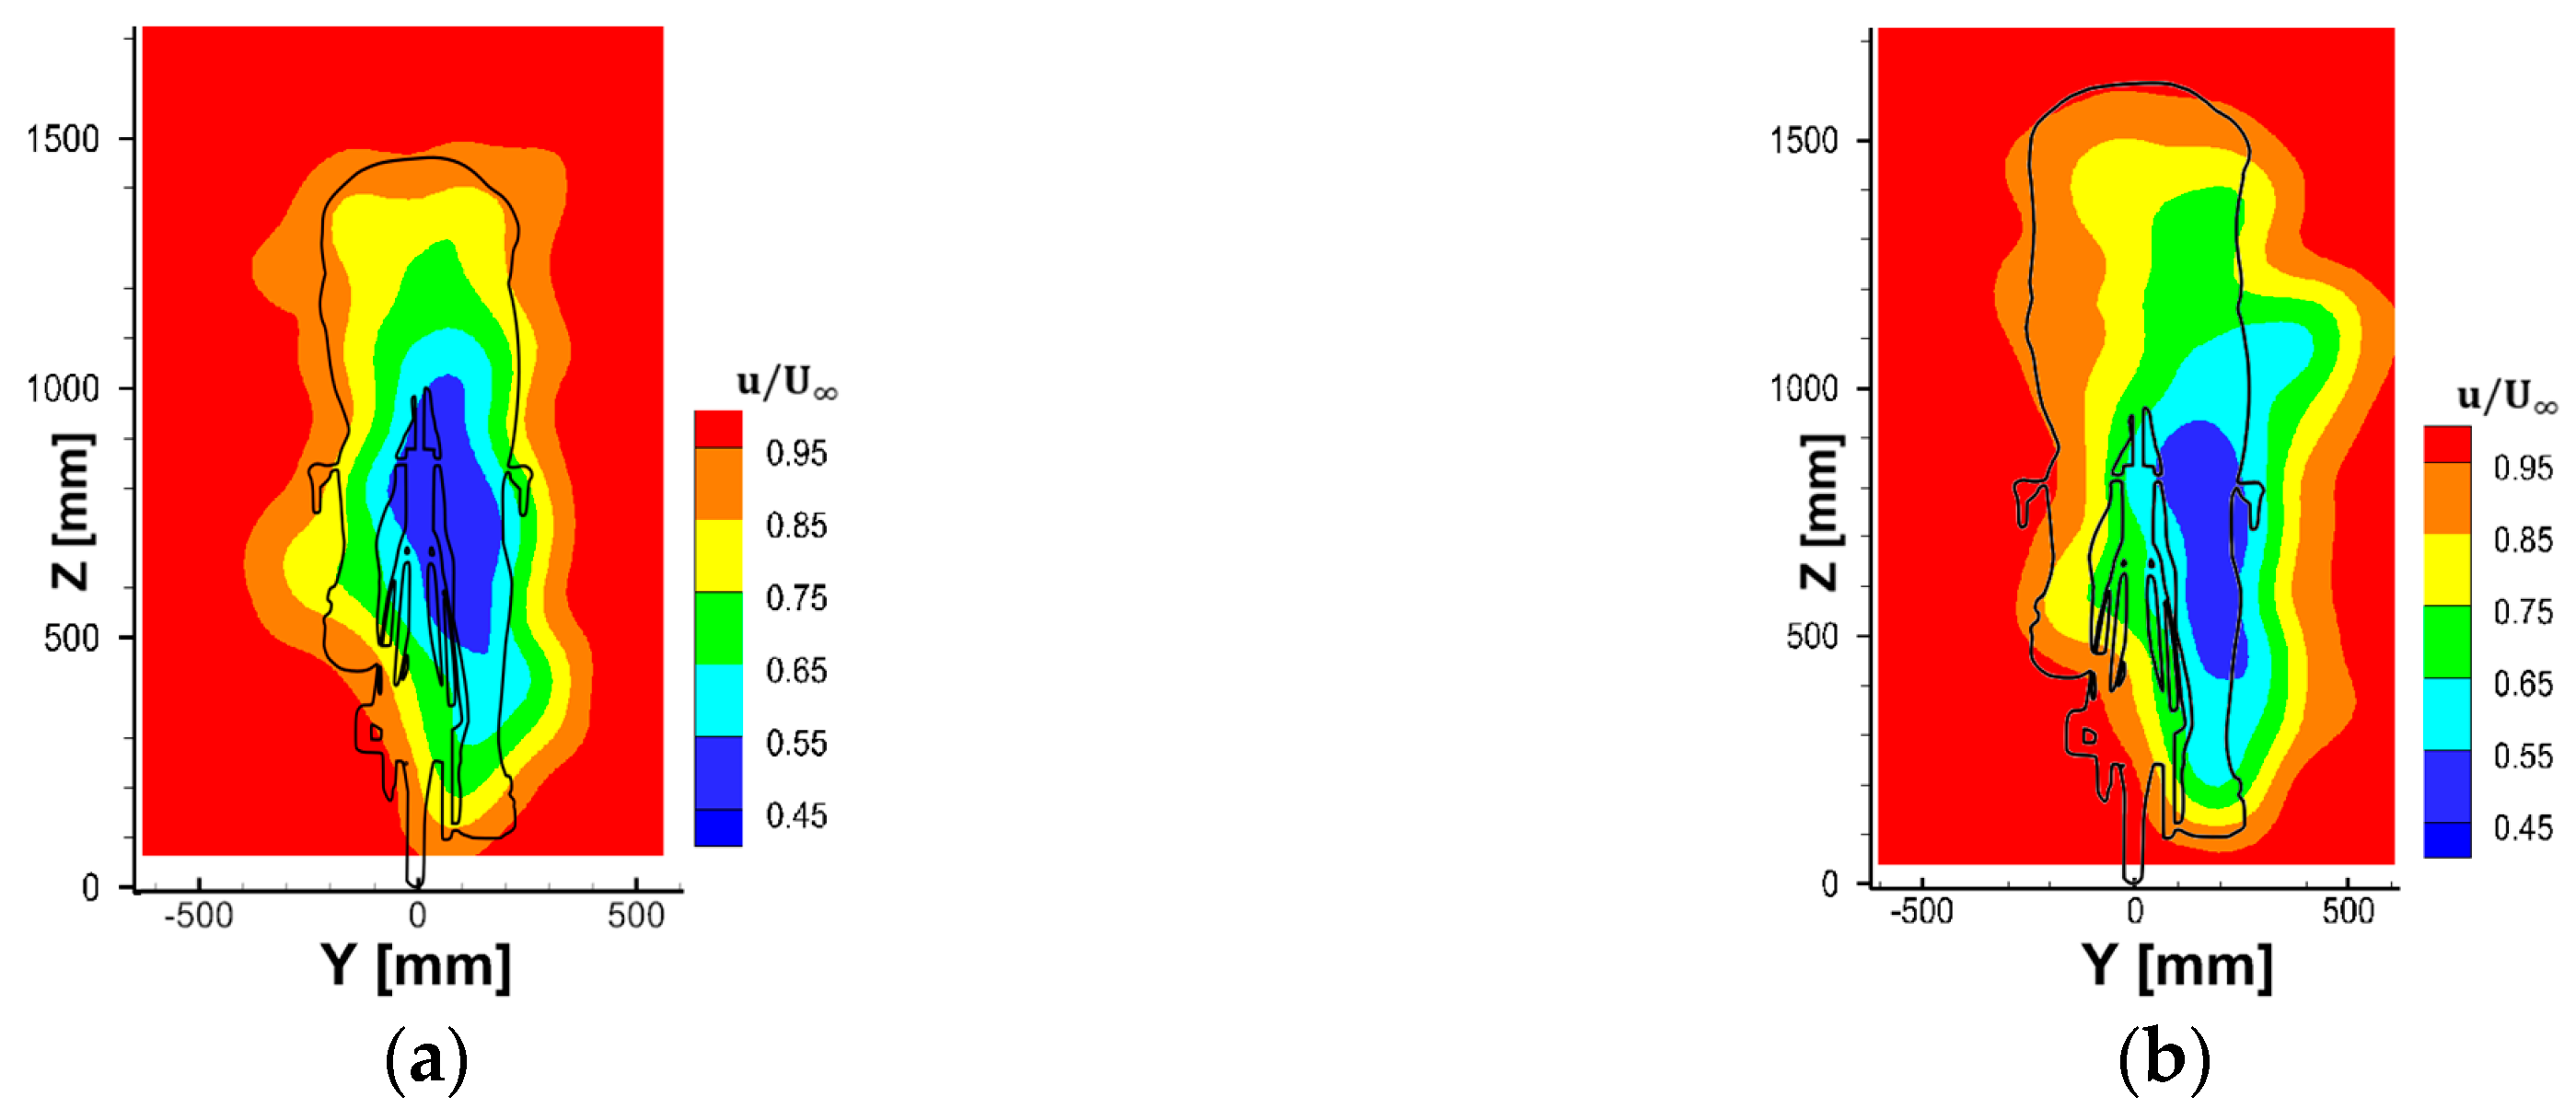
4.3. Upright vs. TT Position
5. Conclusions
Conflicts of Interest
References
- Zdravkovich, M. Aerodynamics of bicycle wheel and frame. J. Wind Eng. Ind. Aerodyn. 1992, 40, 55–70. [Google Scholar] [CrossRef]
- Gibertini, G.; Grassi, D. Cycling Aerodynamics. In Sport Aerodynamics; Nørstrud, H., Ed.; CISM International Centre for Mechanical Sciences: Udine, Italy, 2008; Volume 506. [Google Scholar]
- Van-Ingen-Schenau, G.J. The influence of air friction in speed skating. J. Biomech. 1982, 15, 449–458. [Google Scholar] [CrossRef]
- Brownlie, L.; Aihara, Y.; Carbo, J.; Harber, E.; Henry, R.; Ilcheva, I.; Ostafichuk, P. The Use of Vortex Generators to Reduce the Aerodynamic Drag of Athletic Apparel. Procedia Eng. 2016, 147, 20–25. [Google Scholar] [CrossRef]
- Lukes, R.A.; Chin, S.B.; Haake, S. The understanding and development of cycling aerodynamics. Sports Eng. 2005, 8, 59–74. [Google Scholar] [CrossRef]
- Crouch, T.N.; Burton, D.; Thompson, M.C.; Brown, N.A.T.; Sheridan, J. Flow topology in the wake of a cyclist and its effect on aerodynamic drag. J. Fluid Mech. 2014, 748, 5–35. [Google Scholar] [CrossRef]
- Crouch, T.N.; Burton, D.; Thompson, M.C.; Brown, N.A.T.; Sheridan, J. Dynamic leg motion and its effect on the aerodynamic performance of cyclists. J. Fluids Struct. 2016, 65, 121–137. [Google Scholar] [CrossRef]
- Barry, N.; Burton, D.; Sheridan, J.; Thompson, M.; Brown, N. Flow field interactions between two tandem cyclists. Exp. Fluids 2016, 57. [Google Scholar] [CrossRef]
- Terra, W.; Sciacchitano, A.; Scarano, F. Drag Analysis from PIV Data in Speed Sports. Procedia Eng. 2016, 147, 50–55. [Google Scholar] [CrossRef]
- Jux, C. Robotic Volumetric Particle Tracking Velocimetry by Coaxial Imaging and Illumination. Master’s Thesis, TU Delft, Delft, The Netherlands, 2017. [Google Scholar]
- Shah, Y.H. Drag Analysis of Full Scale Cyclist Model Using Large-Scale 4D-PTV. Master’s Thesis, TU Delft, Delft, The Netherlands, 2017. [Google Scholar]
- Terra, W.; Sciacchitano, A.; Scarano, F. Aerodynamic drag of a transiting sphere by large-scale tomographic-PIV. Exp. Fluids 2017, 58, 83. [Google Scholar] [CrossRef]
- de Kat, R.; Bleischwitz, R. Towards instantaneous lift and drag from stereo-PIV wake measurements. In Proceedings of the 18th International Symposium on the Application of Laser and Imaging Techniques to Fluid Mechanics, Lisbon, Portugal, 4–7 July 2016. [Google Scholar]
- Sciacchitano, A.; Scarano, F.; Wieneke, B. Multi-frame pyramid correlation for time-resolved PIV. Exp. Fluids 2012, 53, 1087–1105. [Google Scholar] [CrossRef]
- Grappe, F.; Candau, R.; Belli, A.; Rouillon, J.D. Aerodynamic drag in field cycling with special reference to the Obree’s position. Ergonomics 2010, 40, 1299–1311. [Google Scholar] [CrossRef]
- Defraeye, T.; Blocken, B.; Koninckx, E.; Hespel, P.; Carmeliet, J. Aerodynamic study of different cyclist positions: Cfd analysis and full-scale wind-tunnel tests. J. Biomech. 2010, 43, 1262–1268. [Google Scholar] [CrossRef] [PubMed]
- Jeukendrup, A.E.; Martin, J. Improving cycling performance: How should we spend our time and money. Sports Med. 2001, 31, 559–569. [Google Scholar] [CrossRef] [PubMed]


Publisher’s Note: MDPI stays neutral with regard to jurisdictional claims in published maps and institutional affiliations. |
© 2018 by the authors. Licensee MDPI, Basel, Switzerland. This article is an open access article distributed under the terms and conditions of the Creative Commons Attribution (CC BY) license (https://creativecommons.org/licenses/by/4.0/).
Share and Cite
Spoelstra, A.; Terra, W.; Sciacchitano, A. The Ring of Fire for in-Field Sport Aerodynamic Investigation. Proceedings 2018, 2, 221. https://doi.org/10.3390/proceedings2060221
Spoelstra A, Terra W, Sciacchitano A. The Ring of Fire for in-Field Sport Aerodynamic Investigation. Proceedings. 2018; 2(6):221. https://doi.org/10.3390/proceedings2060221
Chicago/Turabian StyleSpoelstra, Alexander, Wouter Terra, and Andrea Sciacchitano. 2018. "The Ring of Fire for in-Field Sport Aerodynamic Investigation" Proceedings 2, no. 6: 221. https://doi.org/10.3390/proceedings2060221
APA StyleSpoelstra, A., Terra, W., & Sciacchitano, A. (2018). The Ring of Fire for in-Field Sport Aerodynamic Investigation. Proceedings, 2(6), 221. https://doi.org/10.3390/proceedings2060221