Abstract
Third generation (3G) artificial turf systems use in sporting applications is increasingly prolific. These multi-component systems are comprised of a range of polymeric and elastomeric materials that exhibit non-linear and strain rate dependent behaviours under the complex loads applied from players and equipment. To further study and better understand the behaviours of these systems, the development of a numerical model to accurately predict individual layers’ behaviour as well as the overall system response under different loading conditions is necessary. The purpose of this study was to characterise and model the mechanical behaviour of a rubber shockpad found in 3G artificial surfaces for vertical shock absorption using finite element analysis. A series of uniaxial compression tests were performed to characterise the mechanical behaviour of the shockpad. Compression loading was performed at 0.9 Hz to match human walking speeds. A Microfoam material model was selected from the PolyUMod library and optimised using MCalibration software before being imported into ABAQUS for analysis. A finite element model was created for the shockpad using ABAQUS and a compressive load applied to match that of the experimental data. Friction coefficients were altered to view the effect on the loading response. The accuracy of the model was compared using a series of comparative measures including the energy loss and root mean square error.
1. Introduction
The use of artificial sports pitches has grown considerably over recent years with Fédération Internationale de Football Association (FIFA) recognising them as a quality playing surface alternative to natural grass and the English football association planning to invest £230 million on new 3G pitches by 2020 [1]. The latest 3G surfaces have been described by FIFA as “the best alternative to natural grass” due to their resistance to weather and ability to sustain more intensive use [2].
These 3G surfaces are created using a structure of four layers of components that together make the surface system. The bottommost layer of the surface system is an elasticated mat, commonly formed of rubber, designed to absorb the vertical loading associated with sporting movements of players. There are three types of shockpad available: integral, in-situ and prefabricated [3]. In-situ shockpads are constructed from recycled rubber granules mixed with a polyurethane adhesive meaning their properties can differ across a surface. Prefabricated shockpads are fabricated in a controlled environment meaning their properties are more uniform across the surface. The modelling of sports surfaces has been attempted before with examples of running tracks, vinyl flooring and rubber treadmill belts all investigated [4,5,6]. In a previous study by Mehravar et al. [7] the loading of an elastomeric shockpad was modelled using ABAQUS. An Arruda-Boyce material equation was proposed that could accurately predict the loading response of the shockpad under compression up to 1800 N in the 0.9–10 Hz frequency range.
The purpose of this study was to use a Finite Element (FE) model to simulate both the loading and unloading of a rubber shockpad under a compressive load. The mechanical behaviour of the rubber shockpad was characterised by a number of uniaxial compression tests before being a hyperelastic material model was used to describe the material response. The results from the numerical simulations were compared with the experimental test data and assessed for accuracy.
2. Methodology
2.1. Experimental Test Methods
Compression testing was performed on an Instron ElectroPuls (E3000) machine. The machine was chosen due to its ability to apply high frequency dynamic loads compared to the quasi-static loads applied by standard tensometers. Shockpad samples were laid on a flat steel base and compressed by a flat bottomed circular test foot with a diameter of 50 mm to represent a shod adults heel [8]. A cyclic load of 1900 N was applied at a frequency of 0.9 Hz to simulate the loading force of an average male athlete of 80 kg at walking speeds [9,10].
The shockpad used was Regupol 6010 SP, a prefabricated mat manufactured by BSW Berleburger (BB). The shockpad consisted of rubber shreds 2 to 8 mm in size bonded together with polyurethane adhesive. The average density was measured as 557 kg/m3 and the average thickness as 15 mm. Two sets of uniaxial compression tests were performed. Test condition A used a small circular sample 30 mm in diameter as recommended in BS ISO 7743 [11] for the testing of rubbers (Figure 1). The load force was altered to ensure an equivalent pressure was being applied over the smaller area. As the friction coefficients between shockpad and loading equipment was unknown the sample was lubricated with a nonaggressive grease to reduce barrelling [12]. Whilst this loading scenario is not representative of human loading it produces more suitable data for material model calibration. Test condition B was therefore used to replicate the loading of a shockpad by a human. A 300 × 300 mm shockpad sample was compressed with the circular test foot in the centre of the pad. A small preload of 5 N was applied to ensure contact was made between test foot and shockpad before cyclic testing commenced. Preliminary tests showed a steady state was reached after approximately 10 cycles therefore the last 10 cycles were used for analysis. The force-displacement data was output for all cycles and was processed in MATLAB to calculate the stress and strain.
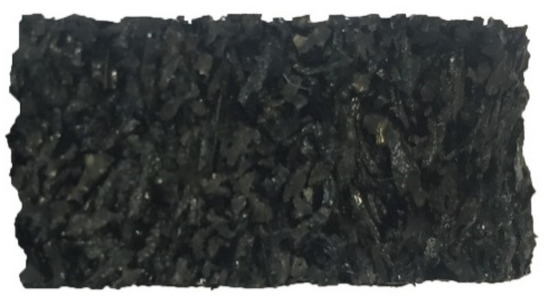
Figure 1.
Regupol 6010 SP shockpad disc specimen used for test condition A.
2.2. Experimental Results and Material Modelling
Results from the compression testing showed the shockpad to have hyperelastic, strain rate dependent behaviour with hysteresis (Figure 2). In this paper a Microfoam (MF) material model taken from the PolyUMod material library and calibrated using MCalibration software (Version 4.6, Veryst Engineering, Needham, MA, USA). The MF model is an advanced model used to predict the time-dependent, non-linear, large-strain behaviour of polymer foams. The model not only considers the viscoelastic response of the material but also the reduced density of the foam when compressed and the initial pore pressure inside the foam. For the shockpad model the reduced density of the foam, rhor (Table 1), defined as the ratio between the density of the foam and the density of the solid material, was set to 0.6. As the shockpad is porous it resembles open cell foam, therefore the initial gas pressure was set as zero. Variables Es, hE, lambdaL, sB, xi, C, tauHat and m were optimised in MCalibration software using a series of optimisation equations, with the remaining variables locked as default values.
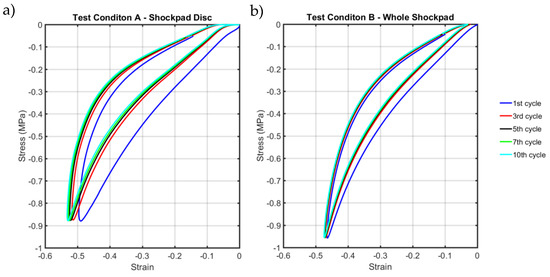
Figure 2.
Cyclic loading of the BB shockpad for (a) test condition A and (b) test condition B.

Table 1.
Material parameters and values calibrated by the Micromechanical foam model.
2.3. Finite Element Models
Two FE models were created on Abaqus (Version 6.16, Simula, Dassault systems) to represent the test conditions A and B. Test condition A consisted of one part representing the shockpad disc test piece. The part was constrained to restrict rotation of the sample during the loading. A pressure was applied to the top surface of the test piece to represent the load. A hex mesh consisting of first-order, eight-node linear brick, reduced integration with hourglass control elements (C3D8R) was used.
Test condition B consisted of 3 parts: a base plate, a compression foot and a shockpad. The test foot and base plate were defined as rigid bodies to reduce computational time. A pressure of 1 MPa was applied to the top surface of the test foot. The shockpad was meshed with C3D8R elements with an increasing mesh density around the area of loading to ensure accurate results were obtained. (Figure 3). Boundary conditions were set according to the experimental test conditions and interactions defined between the test foot, shockpad and plate. Tangential friction was defined using the penalty method with the friction coefficient altered to view the response of the shockpad.
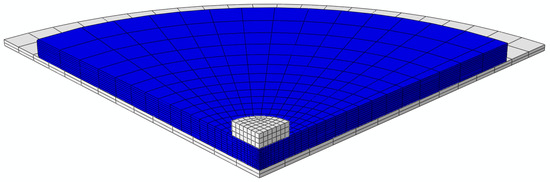
Figure 3.
Abaqus model of test condition B, base plate and compression foot (white) are modelled as rigid bodies and sandwich the shockpad (blue).
3. Results
Model predictions from test condition A shows a good match during both loading and unloading with the curve matching the hyperelastic response of the shockpad (Figure 4) The results from the FEA model were outputted as the nominal stress against the strain in the direction of compression. Four factors were used to measure the accuracy of the FEA prediction compared to the experimental data (Table 2). The differences in maximum stress, strain and energy loss (area within the load-unload curve) were calculated as a percentage difference from the experimental data. The root mean square error (RMSE) was calculated as presented in kPa compared to the experimental curve. The predicted maximum stress and strain for test condition A were both within 1% of the experimental maximum stress and strain. The energy loss of the predicted curve was 9% larger than the experimental data and the RMSE was 28.5 kPa.
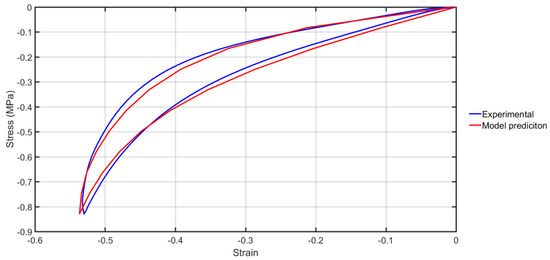
Figure 4.
Nominal stress strain curves taken from the experimental data and the FE model prediction using the microfoam material model.
Table 2.
Key values taken from FE model for test condition B compared to experimental test data. Comparison values are given as a percentage of the experimental.
Test condition B used the MF material model formed using the frictionless method in test condition A and altered the coefficients of friction between the loading foot and base plate. The contact pressure between test foot and shockpad was approximately 1950 N for all friction values, slightly larger than the 1900 N target pressure from the experimental data. As the friction coefficient was increased the nominal stress-strain curve prediction from the model decreased in strain and increased in stress (Figure 5). The maximum horizontal deformation in the shockpad also reduced as the friction was increased. Based upon the four fitness factors used, a friction coefficient of 0.3 showed a best match to the experimental curve used as a comparison.
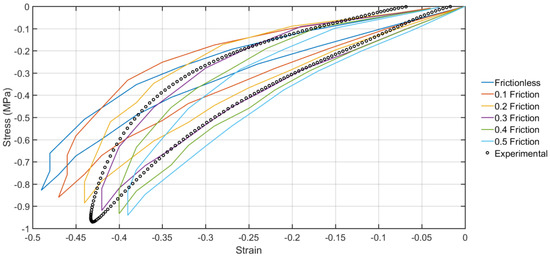
Figure 5.
Nominal stress strain curves produced using different coefficients of friction for test condition B compared to experimental test curve.
4. Discussion
Despite the shockpad being heavily dominated by rubber particulates and showing similar compression behaviour to an elastomer, the MF material model produced the best match to the experimental data. The use of foam material models to represent hyperelastic material properties is not uncommon and has been shown to produce better results than some viscoelastic material models in impact scenarios [13,14]. This is likely die to the cellular structure of the shockpad. When compressed the shockpad acts like an open cell foam with the air voids squashed first before the rubber shreds begin contact and the compression response turns into that of a rubber.
Test condition B looked to replicate the conditions in which the surface would be loaded by a player whilst walking. Even in the simplified conditions used in the lab, significant challenges were present when trying to replicate the performance using a FE model. The introduction of contact between shockpad, test foot and base plate bought in more variables with unknown quantities. The biggest unknown quantity was that of the friction between the three surfaces. The differences between test condition A and B under experimental conditions was approximately 20% in the maximum strain produced. To match a material model to the test data found in test condition A would only cause further problems when introducing friction coefficients to the FE model. By matching to the frictionless condition the pure material behaviour could be found before it was used in the more complex material model matching test condition B.
A value of 0.3 as a friction coefficient produced the best results to match the experimental data. This value has not been validated against experimental data to find the friction between shockpad and steel. It is therefore only an arbitrary value in its current state, selected only for its closeness in match to the experimental data used for these comparisons. Whilst the results from the model must therefore be validated further to ensure they are truly representative of the experimental results, the current conditions do highlight the importance of knowing the input parameters such as the friction. In reality the shockpad would be placed on top of a sub base of asphalt or stone with any loading coming through the interface between the carpet backing and shockpad. In this study the model predictions were compared to one cycle of one set of experimental results. In reality variation in the stress-strain response was seen during multiple tests of the shockpad. The accuracy of the predicted data to the experimental data is therefore subject to some variation.
5. Conclusions
This study has shown the process of collecting and analysing material data to create a material model capable of predicting the deformation behaviour of an elastomeric shockpad. The method of fitting the material model to experimental data from a simplified loading scenario allowed the pure material data to be used without confounding variables. Using the calibrated model in the more complex loading scenario with multiple parts and interactions showed how variables such as friction can impact the results. By altering the friction coefficient a model was created that was able to replicate the experimental results. Further validation of the model is needed to ensure variables such as the friction are of appropriate values. Further improvements to the model will allow for predictions of faster strain rates comparable to those of human running and sprinting.
References
- Gibson, O. FA Reveals Its 2020 Vision: Football Hubs and 3G Pitches for All [Internet]. The Guardian. 2014. [cited 22 June 2016]. Available online: https://www.theguardian.com/football (accessed on 12 February 2016).
- Fédération Internationale de Football Association (FIFA). FIFA Quality Programme for Football Turf; FIFA: Zürich, Switzerland, 2015. [Google Scholar]
- Anderson, L. Elastomeric Shockpads for Outdoor Synthetic Sports Pitches; Loughborough University: Loughborough, UK, 2007. [Google Scholar]
- Andena, L.; Briatico-Vangosa, F.; Cazzoni, E.; Ciancio, A.; Mariani, S.; Pavan, A. Modeling of shock absorption in athletics track surfaces. Sport Eng. 2015, 18, 1–10. [Google Scholar] [CrossRef][Green Version]
- Farhang, B.; Araghi, F.R.; Bahmani, A.; Moztarzadeh, F.; Shafieian, M. Landing impact analysis of sport surfaces using three-dimensional finite element model. In Proceedings of the Institution of Mechanical Engineers; Part P: Journal of Sports Engineering and Technology; SAGE Publications: Thousand Oaks, CA, USA, 2015; pp. 1–6. [Google Scholar]
- Thomson, R.D.; Birkbeck, A.E.; Lucas, T.D. Hyperelastic modelling of nonlinear running surfaces. Sport Eng. 2001, 4, 215–224. [Google Scholar] [CrossRef][Green Version]
- Mehravar, M.; Fleming, P.; Cole, D.; Forrester, S. Mechanical Characterisation and Strain Rate Sensitivity of Rubber Shockpad in 3G Artificial Turf; Association for Computational Mechanics in Engineering: Cardiff, UK, 2016; pp. 8–11. [Google Scholar]
- Dura, J.V.; Garcia, A.C.; Solaz, J. Testing shock absorbing materials: The application of viscoelastic linear model. Sport Eng. 2002, 5, 9–14. [Google Scholar] [CrossRef]
- Andersson, H.; Ekblom, B.; Krustrup, P. Elite football on artificial turf versus natural grass: Movement patterns, technical standards, and player impressions. J Sports Sci. 2008, 26, 113–122. [Google Scholar] [CrossRef] [PubMed]
- Korhonen, M.T.; Suominen, H.; Viitasalo, J.T.; Liikavainio, T.; Alen, M.; Mero, A.A. Variability and symmetry of force platform variables in maximum-speed running in young and older athletes. J. Appl. Biomech. 2010, 26, 357–366. [Google Scholar] [CrossRef] [PubMed]
- British Standard Institution. BS ISO 7743:2011—Rubber, Vulcanized or Thermoplastic—Determination of Compression Stress-Strain Properties; British Standard Institution: London, UK, 2011. [Google Scholar]
- Bergström, J. Chapter 2—Experimental Characterization Techniques. In Mechanics of Solid Polymers; Elsevier: Amsterdam, The Netherlands, 2015; pp. 19–114. [Google Scholar]
- Burbank, S.D.; Smith, L.V. Dynamic characterization of rigid foam used in finite element sports ball simulations. Proc. Inst. Mech. Eng. Part P J. Sport Eng. Technol. 2012, 226, 77–85. [Google Scholar] [CrossRef]
- Smith, L.; Nevins, D.; Dat, N.T.; Fua, P. Measuring the accuracy of softball impact simulations. Sport Eng. 2016, 19, 265–272. [Google Scholar] [CrossRef][Green Version]


Publisher’s Note: MDPI stays neutral with regard to jurisdictional claims in published maps and institutional affiliations. |
© 2018 by the authors. Licensee MDPI, Basel, Switzerland. This article is an open access article distributed under the terms and conditions of the Creative Commons Attribution (CC BY) license (https://creativecommons.org/licenses/by/4.0/).