1. Introduction
Wheelchair Rugby is a team sport for tetraplegic players with minimum disability criteria, classified under sport classification rules. It combines elements of basketball, rugby and ice hockey. Players compete in teams of four to carry a ball across the opposing team’s goal line and they play on manual wheelchairs specifically designed for the sport fixed on them with belts.
The wheelchair’s settings and their influence on upper limb kinematics during athletes’ propulsion was already studied in previous works [
1,
2], or on preventing injuries. Other researchers focused on the activity profiles of the players from a physiological point of view [
3,
4]. This work poses the attention on the mechanical behavior of the frame during frontal impacts; in fact, as players use their chairs to block and hold opponents, contacts between wheelchairs are a fundamental and very intense phase of the sport. Wheelchair can receive very strong frontal impacts, able to lift up the rear wheels, and intense lateral impacts than can even cause the player to tip over or the wheels to brake. Therefore, knowing the loads acting on the frame during an impact allows the wheelchair’s manufacturers to design strong and resistant frame. In analogy to other experiences carried out with bicycles [
5] (Petrone et al., 2012) and motorcycles [
6] (Petrone et al., 2014) frames, authors believe that each part of the frame and its connections should be designed to prevent any breakings or damages still being as light as possible to improve their maneuverability.
The aim of this study was to collect forces applied on the frame during in field frontal impacts through strain gauge measurements in order to give many useful information for the improvement of existing design. Four strain gauge bridges were applied to four different points of the same offensive rugby wheelchair used by the authors in a previous work presented at APCST 2017 in Tel Aviv [
7]. Laboratory and in field tests were conducted: two static calibrations with the application of known loads, in horizontal and vertical direction; one dynamic calibration carried out with impacts against a load cell. Then, two athletes, one of them using the instrumented wheelchair, were asked to perform frontal impacts during a training session. From this last test, the peaks of horizontal and vertical forces were extracted from the strain gauge bridges measurements during the impacts and correlated with the relative velocities of the players.
2. Materials and methods
2.1. Materials
The wheelchair object in this work is the same wheelchair studied in a previous work presented at APCST 2017 in Tel Aviv [
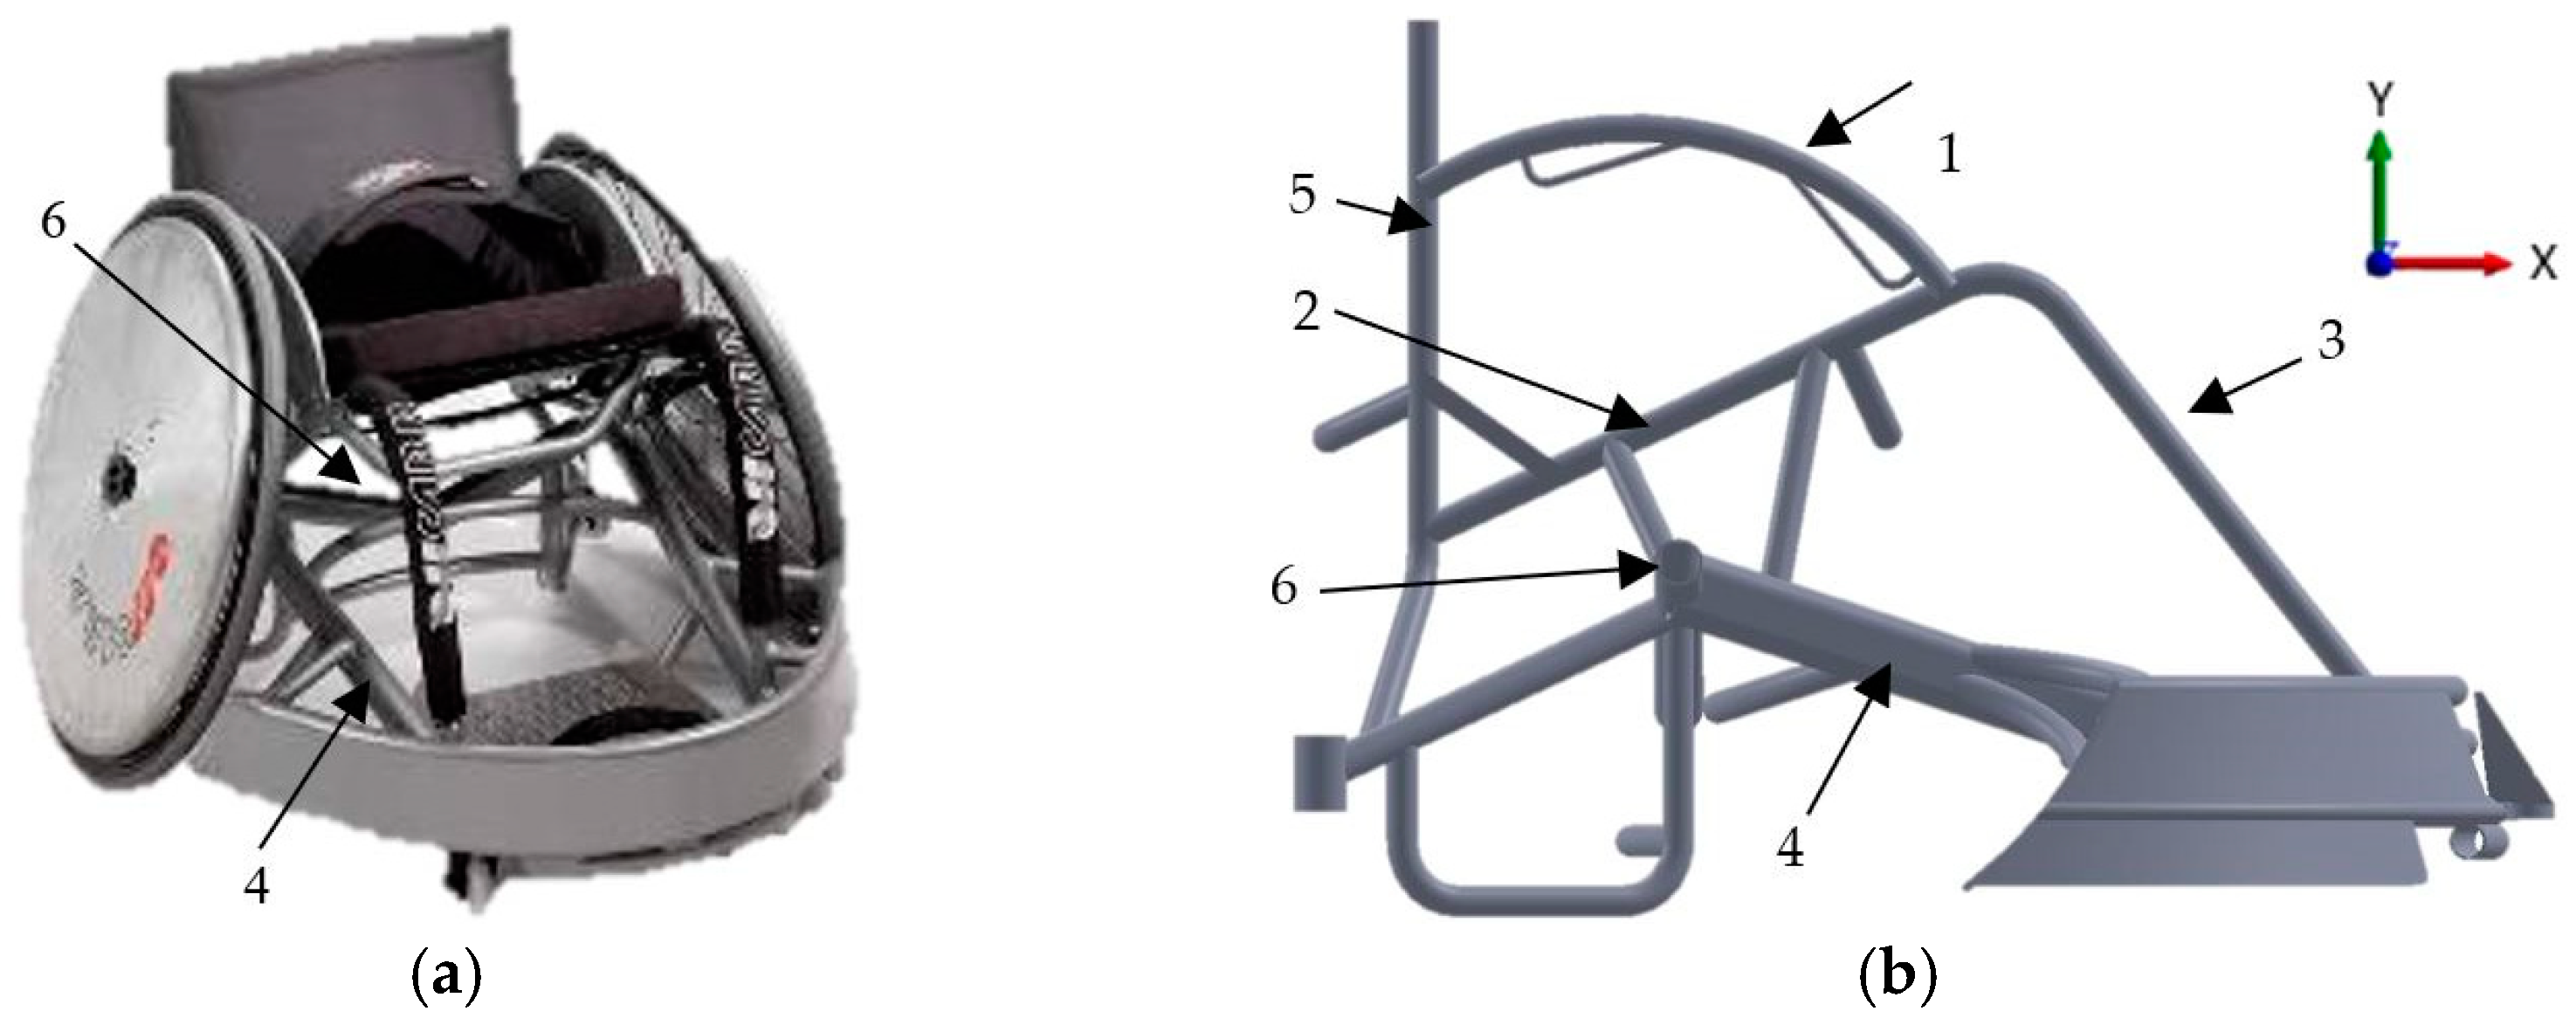
7]. It’s an offensive model of the wheelchair Go Try for rugby made by OffCarr s.r.l. Company, Villa del Conte, Padova, Italy,
Figure 1a, and the names of the principal frame tubes are reported in
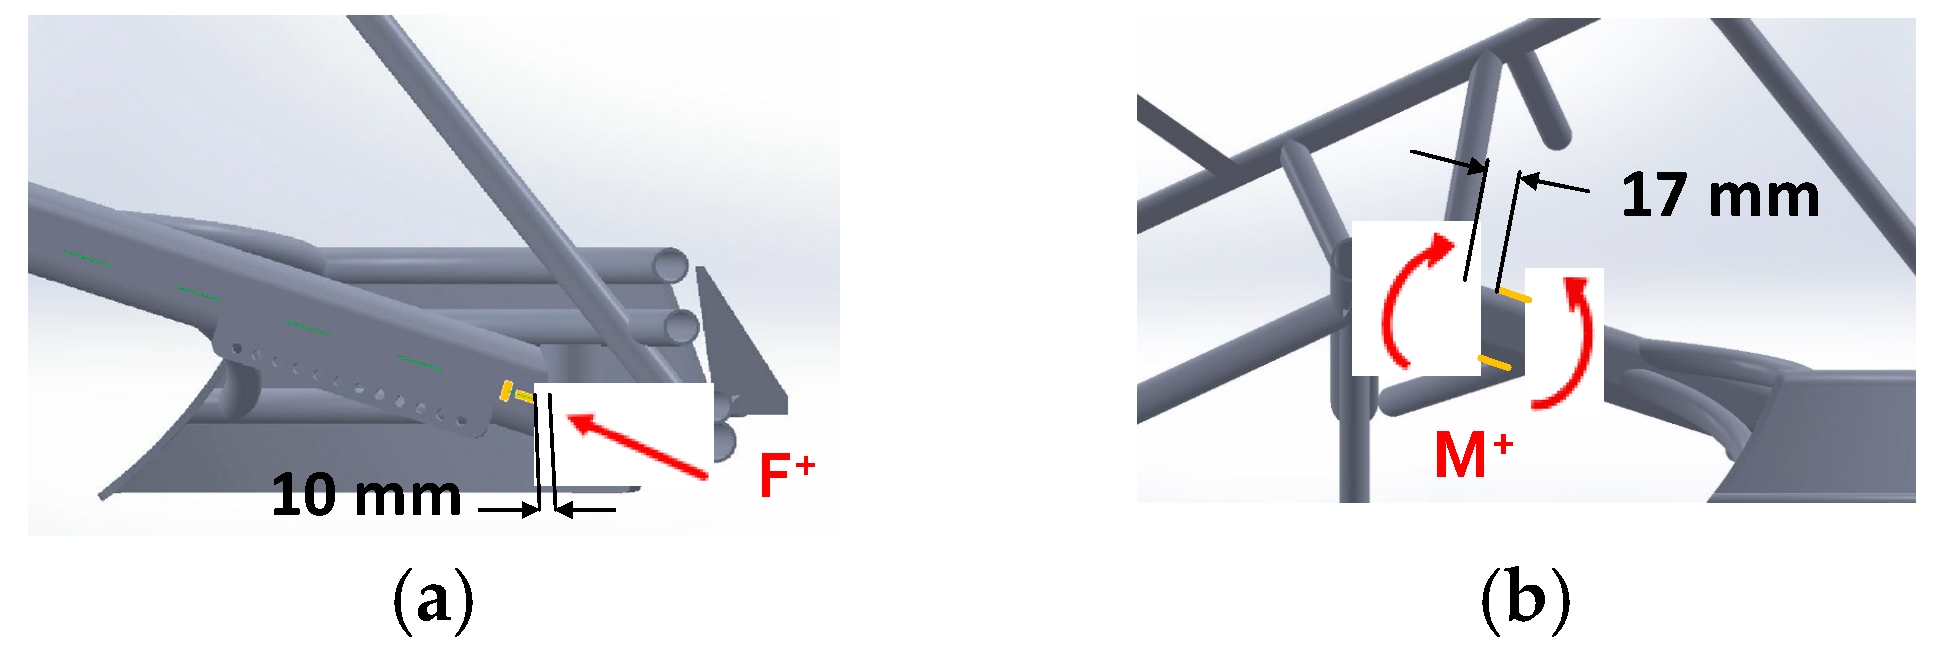
Figure 1b. The wheelchair was set up with four strain gauge bridges in four points on the right side of the frame, but only the two on the main tube were used in this work, RMT_AX and RMT_BE. This depends on the fact that RTM_AX is the most sensitive bridge for horizontal load and RMT_BE is the most sensitive for vertical one. The other two bridges weren’t taken into consideration. The position of the two used strain gauges bridges is shown in
Figure 2 and the details of the bridges are reported in
Table 1.
2.2. Methods
The experimental test sessions involved three different calibrations of the system, two static and one dynamic. Static calibrations consisted in the application of horizontal and vertical load. Tests took place at the Machine Design Laboratory of University of Padova, Italy.
Moreover, one in field test session was conducted at the sports hall of the OIC (Opera Immacolata Concezione), Padova, Italy, and involved two players of the Wheelchair Rugby Italian National Team. The test consisted in frontal impact between two players, starting from increasing distance from each other.
2.2.1. Static Calibrations for Horizontal and Vertical Load
The first calibration aimed to simulate a horizontal load applied on the frame. For recreating the configuration of forces and constraints of a real frontal hit, the wheelchair was put over a bench and a hydraulic cylinder was positioned horizontally acting on the frontal part of the bumper. The wheelchair was rested against a rigid element fixed to the bench by only the two tubes, which support the backrest: this attempted to simulate the action of the belt of the player during a frontal impact. The calibration consisted in the application of discrete load values, from 0 N to 1500 N by a MTS hydraulic cylinder, with steps of 200 N (the first of 100 N) every 20 s, increasing and decreasing. The sensitivity s (slopes of the regression line), the calibration constant C
H and the coefficient of determination
R2 are reported in
Table 2.
The second calibration had the aim to simulate the vertical load acting on the wheelchair, typically caused by the weight of the player in the moment of the rebound after the rear lift coming from a frontal collision. A plate of wood was used for preparing a horizontal support located over the cushion. On this support, nine weights were loaded in correspondence of the rear wheel axle, each one weighs between 9.18 and 11.16 kg. They were put one by one, every 20 s, from 0 to 92.83 kg and returning to 0. The sensitivity s (slopes of the regression line), the calibration constant C
V and the coefficient of determination R
2 are reported in
Table 3.
2.2.2. Dynamic Calibration for Horizontal Load
The third test was a dynamic calibration, in order to verify the consistency of the value of the horizontal force extracted from the RMT_AX bridge during the infield tests. For doing this, an axial load cell (50 kN F.S.) fixed on a wall was used.
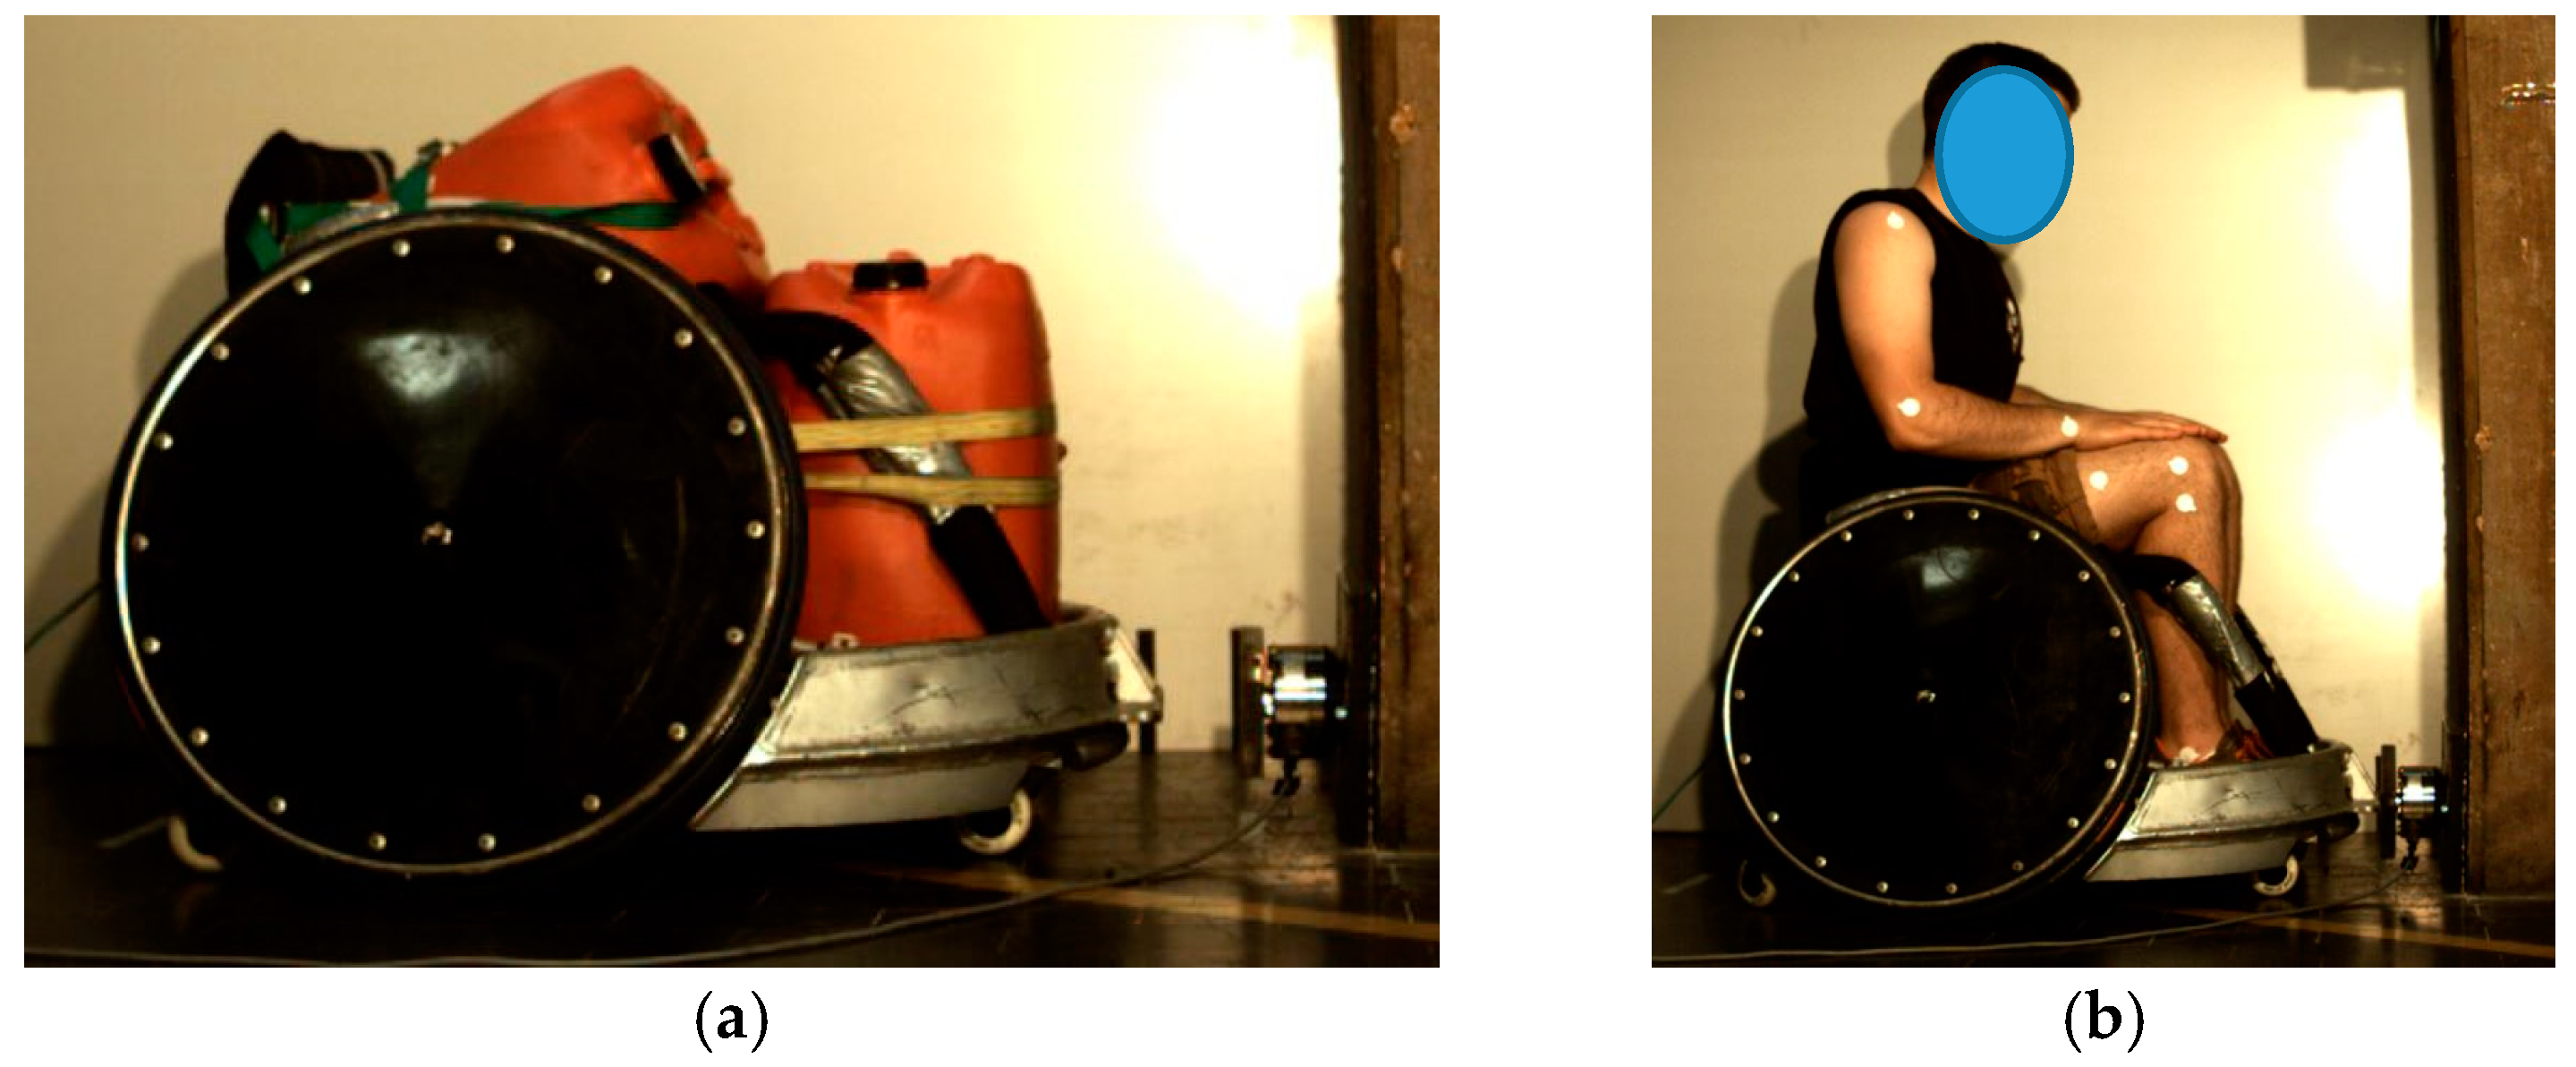
First, the calibration of the load cell was conducted, using a MTS hydraulic cylinder. Subsequently, it was fixed on a rigid wall, at the same height of the wheelchair’s frontal bumper and a steel plate (200 × 200 mm, 20 mm thickness) was screwed on it, in order to create a larger impact area. The test consisted in the wheelchair pushed perpendicularly against the load cell from three different distances, 1, 2 and 3 m. Two different configurations were tested: one with two tanks full of water of 94 kg weight fixed on the wheelchair and another with a person of 75 kg weight sitting on it, as shown in
Figure 3. For each distance and configuration three impacts were conducted. Then the natural frequency of the load cell—steel plate system was calculated, hitting it with a hummer and analysing the load cell output signal. This frequency was used to filter out the cell vibrations from the signal recorded during the hits.
For each impact, the maximum values of the force acquired by the load cell and the horizontal force obtained by the wheelchair RMT_AX bridge were extracted. These values were compared in order to verify the validity of the measurements made by the strain gauge bridge on the wheelchair. In
Figure 4, the force values of the impacts of the water containers and human tester configurations as measured by the load cell in X axis and by the wheelchair in Y axis are reported. It is possible to observe that the values extracted by the RMT_AX bridge are slightly greater than the load cell values on average, the slope of the regression line is 1.0115 and
R2 is 0.8944. In summary there was a good correspondence between the two measures and the values extracted from the wheelchair strain gauge bridge in impact test were corrected with the coefficient of the regression line.
2.2.3. In Field Impact Test
In field impact test consisted in frontal hits between two players on their rugby wheelchairs, at increasing distances from each other, conducting three runs for each distance (2 m, 4 m, 6 m) and they were all filmed with a commercial camera. In this session, subject N. T. with the instrumented wheelchair (105 kg total mass) was opposed versus subject A. D. with a defensive OffCarr GoTry model (82 kg total mass). The signals of the four Wheatstone bridges were recorded by the Somat acquisition system at 5 kHz sample rate. The relative velocities between the players at the instant of the collision were estimated from a video analysis.
3. Results
Zooming the signal in a single hit as shown in
Figure 5, the first peak corresponds to the collision, visible in all bridge. The main tube receives an impulsive compression load, as it possible to see from the positive peak of RMT_AX bridge, according with the signs set up during the configuration. The rear wheels lift and after 35 hundredths of second the player rebounds and this is highlighted by the peak of the RMT_BE bridge, which is the most sensitive bridge for vertical load, caused by the body mass return.
The values of the impact force and the vertical force applied during the rebound were analysed. For studying the impact force, the axial bridge in the main tube RMT_AX was taken as reference, as it was the bridge that better reacted to this type of force. It’s possible to identify the first peak, that corresponds to the maximum value of the impulsive compressive force and this peak value is extracted for every single impact. For the vertical component, the bending bridge in the main tube RMT_BE is taken as reference. In
Figure 4c it’s possible to notice that the rebound occurs 35 hundred of seconds after the impact and it is represented by the second peak indicated in the figure. The value and the shape of the peak depend on the lifting of the wheelchair. It can be sharp if the rear wheels leave the ground or it can be smoother if the wheels remain on the floor and the inertia of the body mass makes the player jolt. The lifting height is obviously directly related to the relative velocity, but mostly it’s related to the exact point of contact between the two wheelchairs. In both cases, the maximum value of the force in this phase is extracted.
In
Table 3 the values of the peaks of the horizontal force measured by the RMT_AX bridge in the three impacts at max distance are collected, as well the vertical load measured by the RMT_BE bridge in rebound instants and the relative velocities between the players at the impact instant in the three runs. In
Figure 4d, the maximum horizontal forces are related with the relative velocities.
4. Discussion
The aim of the work was to provide information to the wheelchair manufacturers about the maximal loads acting on the frame during frontal impacts. These values were estimated after double calibration (static and dynamic) of the frame, giving a good reliability to measurements.
Manufacturers shall consider that these data may even increase with higher mass players and real elite game impacts: however, duration of peaks resulted very short. Impacts analysis may need to be further investigated, as well as the collection of a full real game match to have also the load spectra acting on the frames and responsible for the possible fatigue failure.
5. Conclusions
In this work, a rugby wheelchair was studied during frontal impact. Strain gauge bridges applied on it were calibrated in static and dynamic laboratory test. Then the peak values of horizontal force acting during the hit and the vertical load applied on player’s rebound instant were measured. From the dynamic calibration, it’s possible to observe a good correspondence between the values extracted by the wheelchair strain gauge bridge RMT_AX and the load cell fixed on the wall, used as reference. Peak loads up to 25 kN horizontally and 5.7 kN vertically were recorded.


