Proceeding Paper

Effect on Bowling Performance Parameters When Intentionally Increasing the Spin Rate, Analysed with a Smart Cricket Ball †

by
Franz Konstantin Fuss
1,*,
Batdelger Doljin
1 and
René E. D. Ferdinands
2
1
Smart Equipment Engineering and Wearable Technologies Research Program, Centre for Design Innovation, Swinburne University of Technology, Melbourne VIC 3122, Australia
2
Discipline of Exercise and Sports Science, University of Sydney, Sydney, NSW 2141, Australia
*
Author to whom correspondence should be addressed.
Presented at the 12th conference of the International Sports Engineering Association, Brisbane, Queensland, Australia, 26–29 March 2018.
Proceedings 2018, 2(6), 226; https://doi.org/10.3390/proceedings2060226
Published: 14 February 2018

Abstract

:
A smart cricket ball was used to investigate the influence of increased spin rate on the bowling performance parameters. In three spin bowlers, the performance parameters were compared before and after increasing the spin rate. The first bowler increased the spin rate by 22%, decreased the normalised precession the angle at which the spin rate vector moves into the torque vector—the lower the more efficient), and increased the torque, angular acceleration and power, showing an improvement in all performance parameters. The second bowler showed no improvement in any performance parameters. The third bowler increased the spin rate marginally, but insignificantly; but improved the normalised precession dramatically (reducing it by 50%). The research results suggest that the mere intention to improve the spin rate changes bowling technique in way that optimises normalised precession, even if the spin rate does not actually increase.

1. Introduction

The analysis of bowling performance parameters with a smart cricket ball [1,2,3,4] allows the researcher to quantify the efficacy of coaching interventions, which can take the form of changing technique or teaching new deliveries. The data [3,4,5,6] obtained from the smart ball can reveal the various inter-relationships between these performance parameters, which, for the most part of cricket history, have been impossible to determine. For example, the dependency of spin rate on spin torque—an increase in the latter should lead to corresponding increases in angular acceleration and power. In addition, an inverse relationship should exist between precession (speed of the moving spin axis) and efficiency (energy ratio). However, some relationships may be more difficult to assess, such as the relationship between precession and spin rate. Spin bowling performance is improved when spin rate, acceleration, resultant and spin torque, power, and efficiency increase significantly, with concomitant decreases in precession torque, precession, and normalized precession. It would greatly benefit coaches and spin bowlers to know these inter-relationships between the bowling performance parameters, as they may lead to greater insight on the techniques and skills required to improve spin rate, the primary performance outcome in spin bowling.
Hence, the aim of this paper was to explore the effect on the bowling performance parameters when spin bowlers were instructed to bowl with the intention of increasing the spin rate as much as possible, as a first step in understanding the connection between technique and performance outcomes.

2. Methods

2.1. Smart Cricket Ball

The smart cricket ball used in this study [5,6,7] samples the angular velocity data about the three axes of the ball’s coordinate system at 815 Hz with three high-speed digital gyroscopes, measuring up to 50 rps each. The data are transferred wirelessly to Smartphone or computer via Class 2 Bluetooth radio. RF transmission range reaches up to 20 m in a line of sight condition. The ball is able to collect up to 28 min of bowling data on the onboard memory which allows approximately 80 bowling deliveries (bowling duration of 20 s). The downloaded data were analysed using the Smart Cricket ball software, developed in Python programming language. The leather skin of a commercially available cricket ball was used in the assembly to achieve the realistic feel and aerodynamics of a real ball. A CNC-machined nylon6 nutshell was inserted in the ball to protect the electronic components from impact force and to balance the mass of the instrumented ball (160 g). A highly miniaturised electronics system (including printed circuitry board, sensors, and battery) has half the size of the ball and weighs less than 20 g. The electronics includes three single axis high-speed gyroscopes, a tactile actuator, and a battery (Figure 1).

2.2. Participants

Three male off-spinners participated in the study, ranging from amateur level to former member of a national youth team. The participants bowled the ball 7–19 times for establishing a performance baseline and were then instructed to intentionally impart more spin on the ball six times. The Smart Cricket Ball study was approved by the RMIT University Human Ethics Committee (approval no. BSEHAPP 13-12).

2.3. Performance Parameters

A total of 9 different performance parameters (Table 1) were analyzed: maximal spin rate (ω; measured at release when the ratio of Tp/TR reaches a maximum, at which point the aero-torques set in), angular acceleration (α), resultant torque (TR), spin torque (Tω), precession torque (Tp), power (P), precession (p); speed of the moving spin axis), normalised precession (pn; angle between spin and torque vectors), and efficiency (η) of bowling.
All performance data used in this study are expressed as peak data (maxima) with the exception of efficiency (which is an energy ratio).

2.4. Data Analysis and Statistics

The performance parameters as detailed above were calculated with the Smart Cricket Ball software. The raw gyro data were filtered by a Butterworth low-pass filter of the 3rd order with a cut-off frequency of 30 Hz. The vectors obtained from the software were aligned to the coordinate system of the ball. The performance data before and after intervention were compared with a Mann-Whitney U-test; a significant difference was established if the 2-tailed p-value was smaller than 0.05.

3. Results

An increased spin rate was achieved by two bowlers (Table 1): bowler 1 spun the ball with an extra 3 rps on average, whereas bowler 3 only achieved an extra 2 rps (marginally insignificantly, p = 0.054). Bowler 2 showed no significant change in spin rate. The baseline data of 12–14 rps of all three bowlers is relatively low compared to competitive spin bowlers who typically generate spin rates ranging from 20–40 rps [8,9]. These low spin rates accounted for peak powers of 5–7 W. Bowler 2 did not improve any of his performance data. In contrast, bowler 1 significantly improved his spin rate, as well as all spin rate connected parameters such as torques, acceleration and power. Only precession and efficiency did not improve.
Bowler 3 is a special case. Despite achieving only a marginally significant increase in spin rate, his normalised precession improved dramatically (from 126 to 57 degrees). The only other parameter that changed significantly was the precession torque, which was expected to decrease.
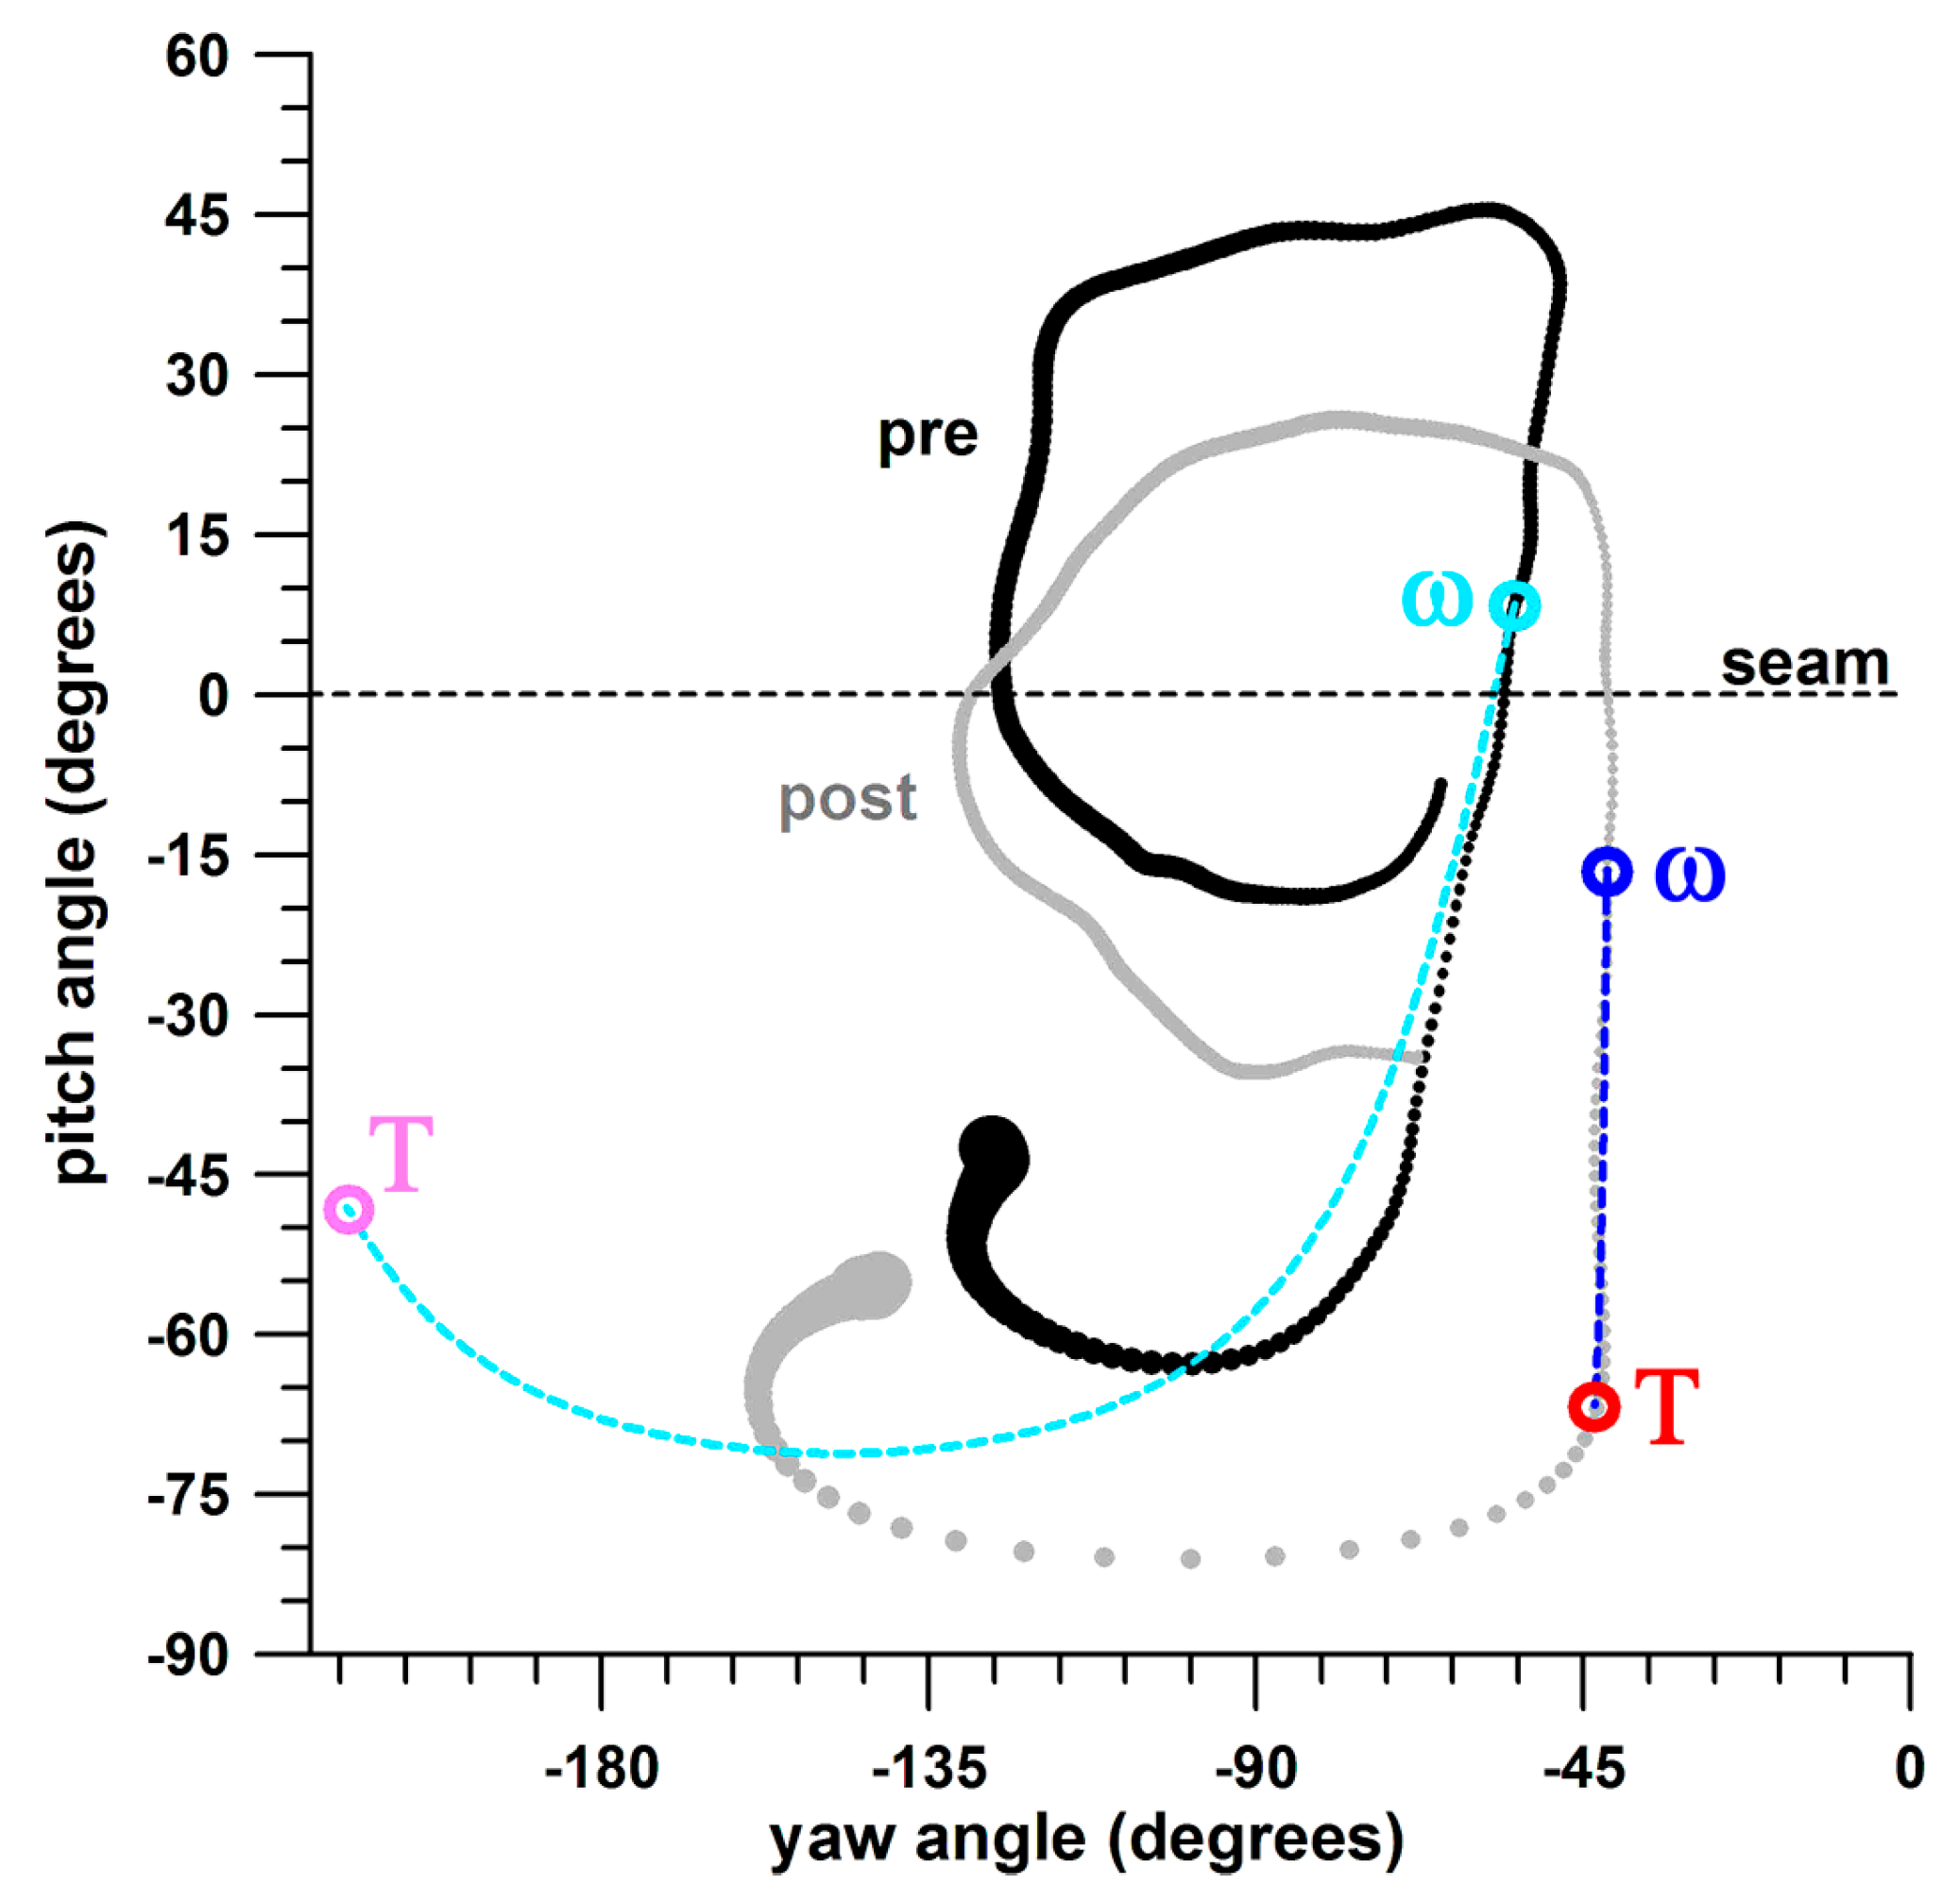
Figure 2 shows the difference in peak normalised precession of bowler 3, of two deliveries before and after intervention; the peak pn is 137 and 50 degrees, respectively. Figure 3 shows this very difference in terms of the path of the spin axis on the surface of the ball, and in terms of the relative positions of spin axis and torque vectors.

4. Discussion

The data showed that each of the bowlers responded differently to the task of trying to impart extra spin rate to the ball. In bowler 2, there were no significant changes in performance parameters compared to baseline. However, bowler 1 performed effectively under this protocol compared to baseline, increasing his spin rate by 22.35% with concomitant changes in normalised precession, resultant torque, spin torque, precession torque, acceleration, and power. Only precession and efficiency did not show a significant change. From these parameters, the ones that contribute to an increase in spin rate are resultant torque, spin torque, and acceleration. The improvement of power is a result of increased spin rate and torque. The same is true for the precession torque, although this torque component is expected to decrease. Precession and efficiency are linked to each other, depending on minimizing Tp. The normalised precession pn represents the precession p normalised to torque TR and spin rate ω, and is therefore not influenced by either of these two parameters.
In bowler 3, the increase in spin rate was only marginally significant; however, pn improved dramatically, approximately halving its value compared to baseline, such that the pn-data before and after intervention did not overlap (as seen in U = 0). This result could be interpreted to mean that the mere intention to increase the spin rate affects the motion pattern, even if the spin rate does not significantly improve. The motion pattern seems optimised, as the normalised precession pn represents the angle θ between the ω- and TR-vectors. These two vectors were closer to each other (Figure 3) after intervention by approximately 50% on average.
Before intervention, pn was larger than 90 degrees (Figure 2) in all bowlers (in bowler 1 only by 3 degrees). After intervention, bowler 3 brought the ball quicker to the sidespin position before imparting the spin torque on the ball, as seen in the dramatic decrease of pn by 68.355° (Table 1).
The fact that Tp increased significantly in bowlers 1 and 3 seems counterintuitive (cf. Results section), but can nevertheless be explained from the slight increase in spin rate (even if insignificant). Consequently, the torque-values also increased (independent of the significance level). It is therefore advisable to normalise the torques to the angular velocity ω. Normalising the torques to the spin rate resulted in insignificant changes across all 3 torques for all 3 bowlers, which was consistent with the precession that also changed insignificantly. This was expected as p ∝ Tp/ω.
The experimental protocol of requesting spin bowlers to consciously exert more effort to increase their spin rate, a form of CNS (central nervous system) overload training, produced variable outcomes among the bowlers in this sample. However, the data showed that under these overload conditions, the smart ball can detect the performance parameters that contribute to an increased spin rate. In future research studies with the smart ball, one of the main objectives will be to assess how the performance parameters that contribute to spin rate correspond to specific finger-motion placements and sequences, providing specific information that can be applied by the coach to re-engineer spin bowling techniques to optimise spin rate.

Conflicts of Interest

The authors declare no conflict of interest.

References

  1. Fuss, F.K.; Lythgo, N.; Smith, R.M.; Benson, A.C.; Gordon, B. Identification of key performance parameters during off-spin bowling with a smart cricket ball. Sports Technol. 2011, 4, 159–163. [Google Scholar] [CrossRef]
  2. Fuss, F.K.; Smith, R.M.; Subic, A. Determination of spin rate and axes with an instrumented cricket ball. Proc. Eng. 2012, 34, 128–133. [Google Scholar] [CrossRef]
  3. Fuss, F.K.; Smith, R.M. Should the finger pressure be well distributed across the seam in seam bowling? A problem of precession and torque. Proc. Eng. 2013, 60, 453–458. [Google Scholar] [CrossRef]
  4. Fuss, F.K.; Smith, R.M. Accuracy performance parameters of seam bowling, measured with a smart cricket ball. Proc. Eng. 2014, 72, 435–440. [Google Scholar] [CrossRef]
  5. Fuss, F.K.; Doljin, B.; Ferdinands, R.E.D.; Beach, A. Dynamics of spin bowling: The normalized precession of the spin axis analysed with a smart cricket ball. Proc. Eng. 2015, 112, 196–201. [Google Scholar] [CrossRef]
  6. Fuss, F.K.; Doljin, B.; Ferdinands, R.E.D. Case studies of the centre of pressure between hand and ball in off-spin bowling, analysed with a smart cricket ball. Proc. Eng. 2016, 147, 203–207. [Google Scholar] [CrossRef]
  7. Doljin, B.; Fuss, F.K. Development of a smart cricket ball for advanced performance analysis of bowling. Proc. Technol. 2015, 20, 133–137. [Google Scholar] [CrossRef]
  8. Beach, A.J.; Ferdinands, R.E.D.; Sinclair, P.J. Three-dimensional linear and angular kinematics of a spinning cricket ball. Sports Technol. 2014, 7, 12–25. [Google Scholar] [CrossRef]
  9. Fuss, F.K.; Doljin, B.; Ferdinands, R.E.D. Unpublished data. 2017. [Google Scholar]
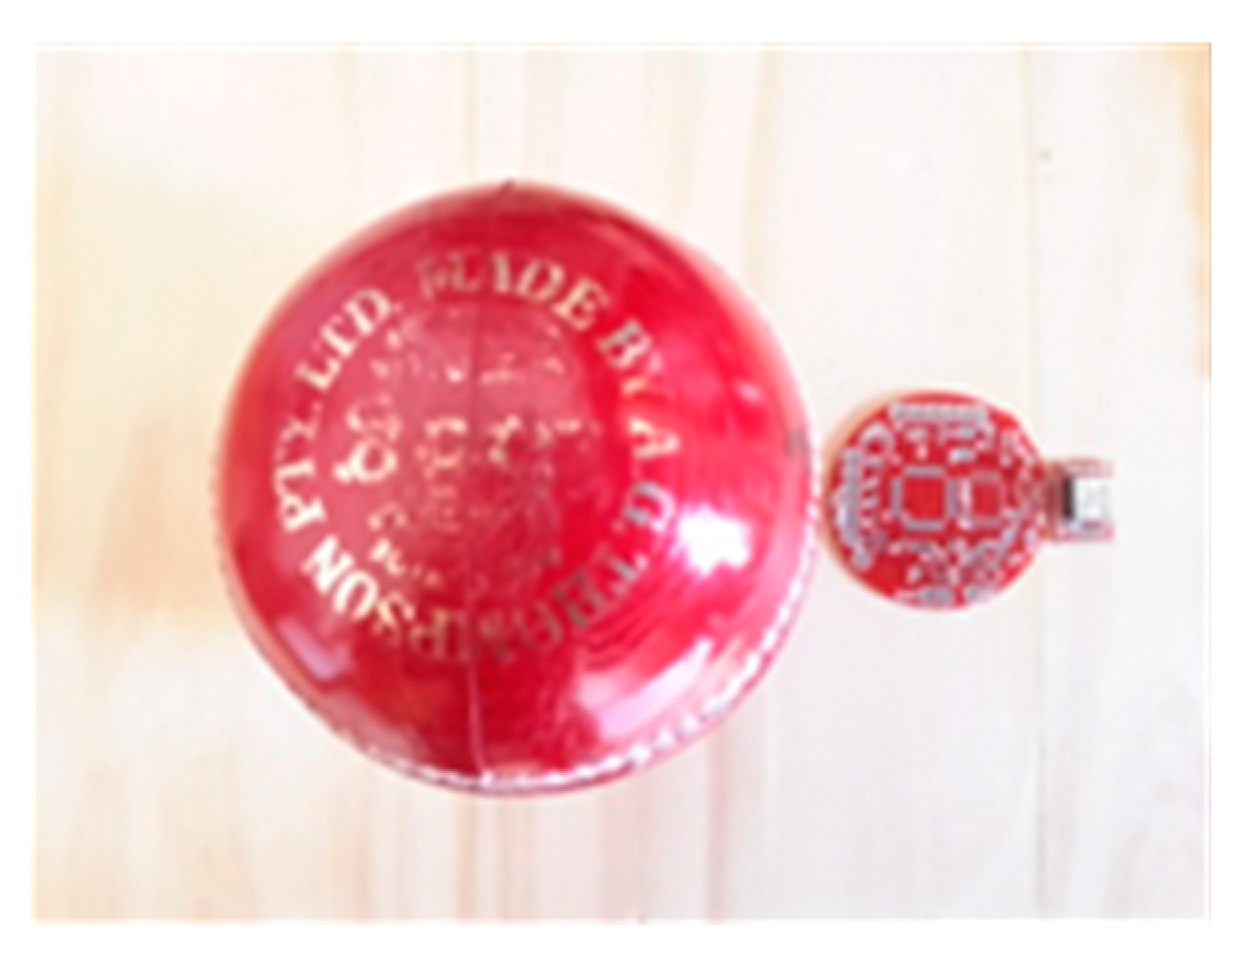
Figure 1. (Left) Smart cricket ball and its printed circuit board and sensor compound; (right) exploded view of the smart cricket ball design.
Proceedings 02 00226 g001
Figure 2. Torque, precession and normalized precession against time of 2 deliveries, one before (pre) and one after (post) intervention; the decrease of the normalized precession is indicated by an arrow.
Proceedings 02 00226 g002
Figure 3. left subfigure: paths of the spin axes on the surface of the ball expressed as yaw and pitch angles (of the spin axis) before (pre) and after (post) intervention (same deliveries as in Figure 2); the bubble size of the pitch-yaw graph corresponds to the spin rate (the release point of the ball is at the largest bubble); ω = instantaneous spin axis vector at peak normalised precession; T = instantaneous torque vector at peak normalised precession; the dashed blue lines indicate the straight path on which the spin axis vector would move into the torque vector if the torque vector were stationary (this straight path on the surface of the ball looks curved on the pitch-yaw diagram); the angle between ω and T is 137° before and 50° after intervention (corresponding to Figure 2); right subfigure: vector diagrams of the spin axis corresponding to the pitch-yaw diagram.
Proceedings 02 00226 g003
Table 1. Performance data (mean ± standard deviation), of three bowlers before and after intervention, including U and p of Mann-Whitney U-test (note that U and p are unitless); bold font: p < 0.05 (significant difference).
Subject 1
Subject 2
Subject 3
Spin Rate ω (rps)Precession p (rad/s)Normalised Precession pn (deg)Resultant Torque TR (Nm)Spin Torque Tω (Nm)Precession Torque Tp (Nm)Acceleration α (rad/s2)Power P (W)Efficiency η (%)
average before14.1 ± 2.246.0 ± 5.892.9 ± 9.20.138 ± 0.0260.132 ± 0.0260.059 ± 0.0111703 ± 3377.24 ± 2.2262.5 ± 6.4
average after17.3 ± 1.741.3 ± 3.976.6 ± 3.20.175 ± 0.0180.168 ± 0.0190.077 ± 0.0122156 ± 24211.12 ± 2.3562.1 ± 2.3
U96265959492949542
p0.00560.06730.00120.00690.00850.01240.00850.00690.4413
average before11.7 ± 1.657.9 ± 20.8103.5 ± 18.50.129 ± 0.0200.116 ± 0.0180.073 ± 0.0141486 ± 2315.17 ± 1.3252.6 ± 7.4
average after10. 9 ± 1.546.4 ± 9.794.7 ± 7.70.120 ± 0.0250.103 ± 0.0270.069 ± 0.0141319 ± 3494.42 ± 1.4952.1 ± 9.5
U332430312843283545
p0.31730.10310.22630.25430.17700.77950.17700.39530.8887
average before13.8 ± 1.227.4 ± 3.3125.7 ± 10.40.124 ± 0.0130.116 ± 0.0130.050 ± 0.00614945 ± 1706.65 ± 1.2372.1 ± 7.5
average after16.0 ± 2.325.6 ± 3.457.3 ± 22.00.147 ± 0.0250.140 ± 0.0250.063 ± 0.0071804 ± 3169.36 ± 2.6774.5 ± 7.7
U35160333439343528
p0.05360.52220.00340.10100.07350.01240.07350.05360.3524
Publisher’s Note: MDPI stays neutral with regard to jurisdictional claims in published maps and institutional affiliations.