1. Introduction
The popularity of cycling has increased within the last decades, whereas the bicycle is now the first choice as a means of transportation in many countries worldwide due to its practical application, efficiency, low costs and related health benefits [
1]. Along with its increasing demand, a necessity for planning and constructing safe bicycle paths has arisen. As it is a quite costly process, cyclists’ route choices have often been surveyed in order to obtain reliable data which would favor the cyclists’ needs and demands. Among the demands, comfort seems to be highly desired when choosing a path [
2].
It has further been agreed that factors such as environmental, mechanical, biomechanical and physiological influences all impact the level of cycling comfort [
3]. Of these, environmental factors such as traffic, lane width and geometry along with the surroundings have shown to significantly affect cyclists’ assessment of the bicycle path comfort [
4]. Different road surfaces affect cyclists’ perception of comfort differently, whereas smoother surfaces are generally preferred yielding optimal comfortable features for riding and thereby requiring lower energy output. Oppositely, rougher road types that are less comfortable and harder to ride have shown to discourage certain cyclists from riding upon such surfaces [
2,
5,
6].
Therefore, research has lately been concentrated around bicycle comfort, for which has been widely regarded as one of the most important aspects, commonly investigated through various vibration tests [
1]. It has further been found that of the common types of road surfaces, tarmac exhibits the highest level of comfort, while also it decreases with increasing velocity [
5]. Giubilato and Petrone [
7] studied the vibration response to road surface, while they also showed that the level of comfort for different wheels varies with the road surface and speed.
However, regarding cycling as a sport the demands of athletes on road surface type and quality differ from those of commuters and leisure-time cyclists. Many athletes want to ride certain surface types (e.g., off-road, gravel-roads, tarmac) depending on the type of bike they are using. They would go for smooth tarmac if riding a time trial bicycle, for gravel roads with their gravel or cyclocross-bikes and off-road with mountain-bikes. Many of these cyclists use online route-planning for longer rides. However, most of the websites (cf.
www.strava.com) use popularity of routes for planning by collecting the smartphone or GPS-device data of uploaded rides, but do not give any information on road surface type or quality. Hence adding information about road type and quality could improve individualized routing options for cyclists planning their ride.
In this research we tried to evaluate whether it is possible to (1) evaluate the road surface quality using a 3D accelerometer mounted on the bicycle’s fork and whether (2) results of similar quality can be achieved using the accelerometer of a smartphone placed in the cyclist’s pocket.
2. Materials and Methods
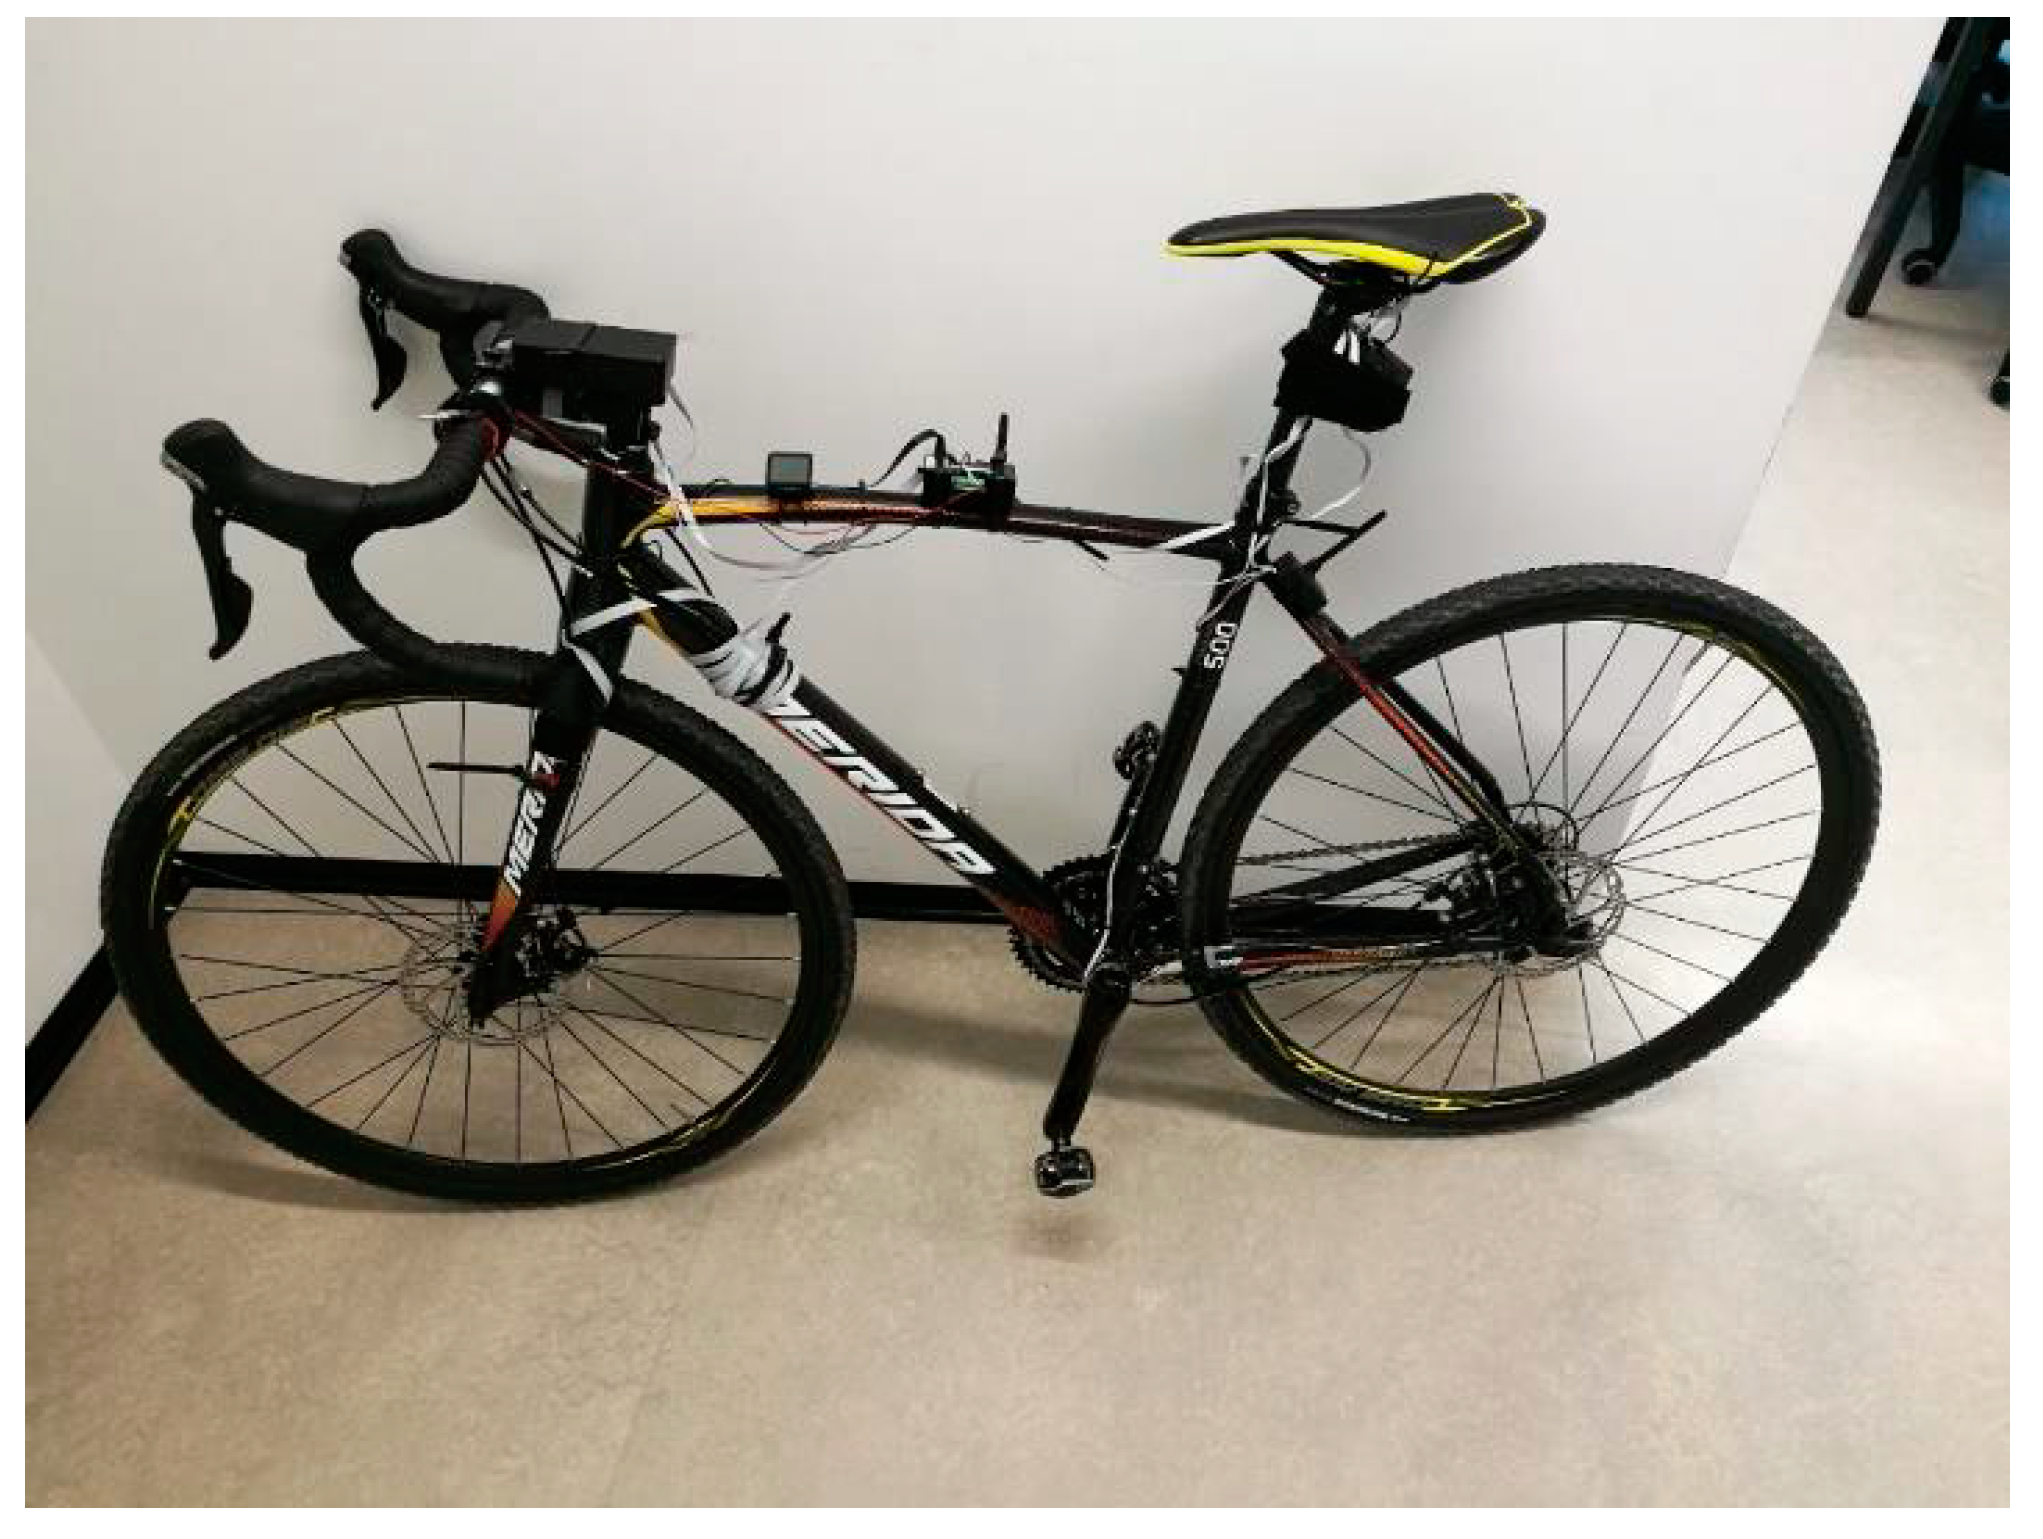
Figure 1 shows the measurement setup of the bicycle, where a Merida 500 cyclocross bicycle of frame size 52 cm was used (measurement setup and trials conducted are described in more detail in the work of Christensen [
8]). A tri-axial capacitance accelerometer (MMA7260Q, Freescale Semiconductor, Austin, TX, USA) was securely strapped to the front fork of the bicycle (
Figure 1). For data storage a data-logger (Logomatic v2, SparkFun Electronics, Boulder, CO, USA) was used with a sensitivity of 200 mV/g, acceleration range ± 6.0 g and sampling with a frequency of 500 Hz. The attached accelerometer was mounted in a tilted orientation determined to be 18.66° from vertical.
Furthermore, a Samsung Galaxy S4 mini Smartphone (Samsung, Daegu, KOR), running Android 6.0 (Google LLC, Mountain View, CA, USA), was placed in the back pocket of the test subject’s pants while conducting the test trials. The smartphone was recording data through the application Physics Toolbox Sensor Suite (Vieyra Software, Washington, DC, USA) and sampling with a frequency of 100 Hz.
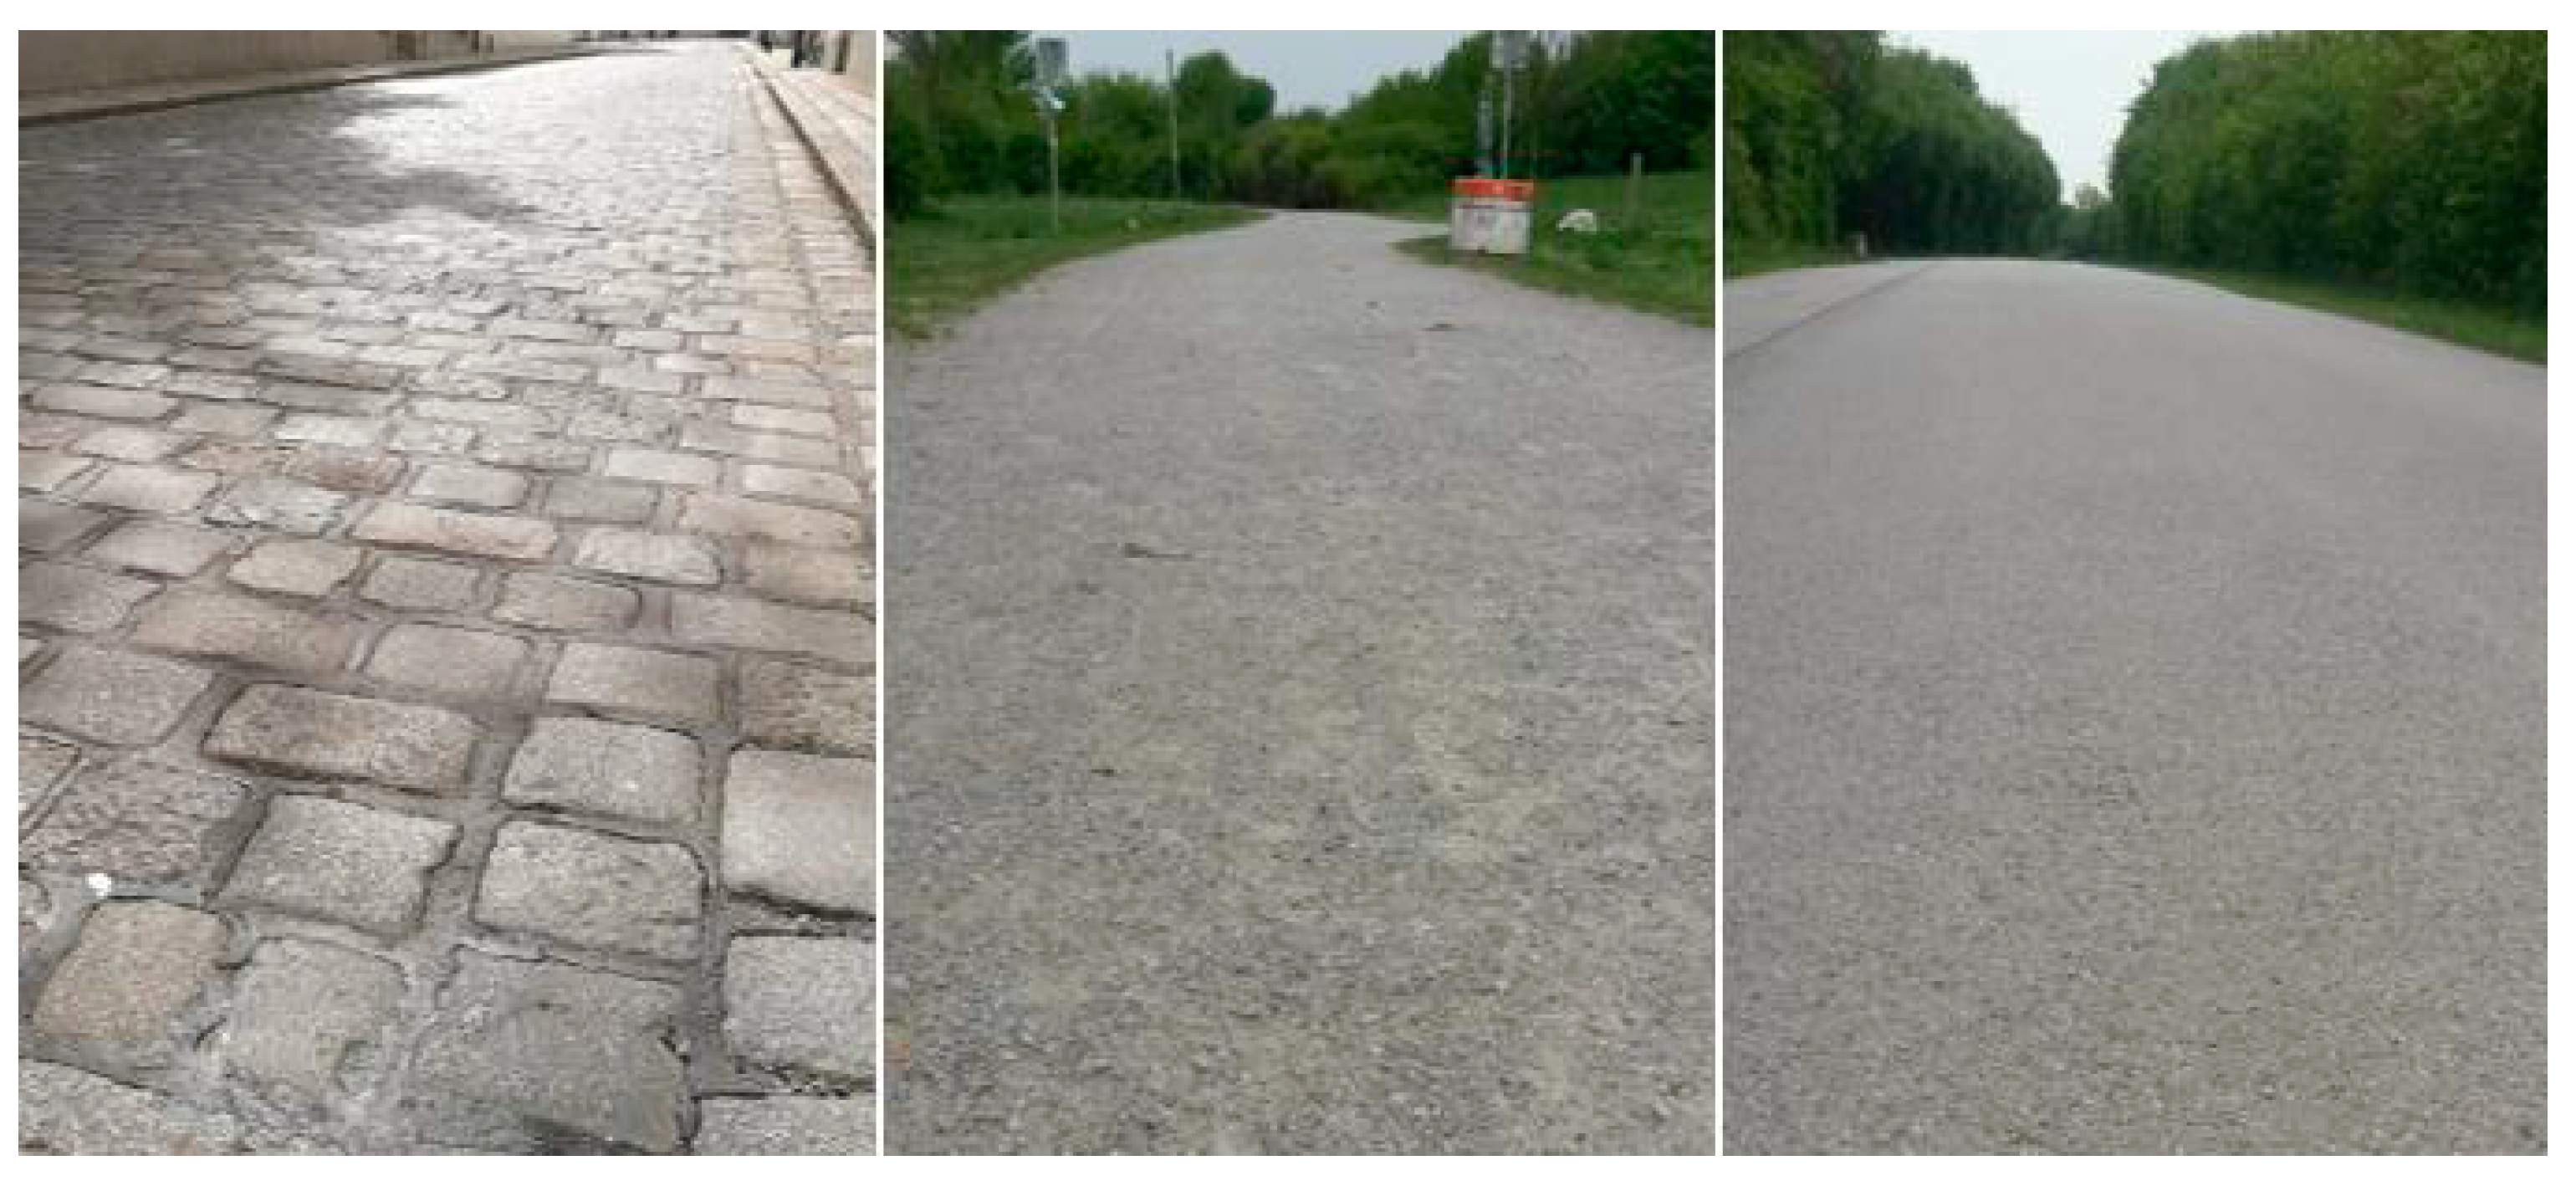
All measurements were conducted the same day, where the following surfaces were tested: cobblestones, gravel, and tarmac (
Figure 2). The surfaces generally showed similarity in structure and condition, where straight and flat sections of approximately 100 m were selected for testing. Each surface, three different speeds (10, 20, 30 km/h) and three tire pressures (3, 4, 5 bar) were tested resulting in nine trials per surface.
Data files from the data-logging device were exported as .txt files, while recordings from the smartphone were exported as .csv files. Data was processed in Matlab 2017b (The MathWorks Inc., Natick, MA, USA). Data were trimmed to contain the vibrational test trials only and an offset correction for all channels was conducted thus resulting in acceleration values oscillating around zero. The acceleration signals were then divided into time windows containing one or two seconds of the data acquired, respectively.
From the time windows applied, a total of 16 features for each channel (ax, ay, az and ares) was extracted resulting in a total of 64 features. These features of the acceleration signal were: mean (a-mean), maximum (a-max), minimum (a-min), mean peak distance (mean-peakdist), mean peak amplitude (mean-peaks), median frequency of the fast Fourier transformed (fft)-signal (median-fft), frequency of the maximum fft-signal power (max-fft-loc), frequency of the minimum fft-signal power (min-fft-loc), maximum fft-signal power (max-fft-pk), minimum fft-signal power (max-fft-pk), mean positive gradient (mean-grad-pos), mean negative gradient (mean-grad-neg), maximum positive gradient (max-grad-pos), minimum positive gradient (min-grad-pos), maximum negative gradient (max-grad-neg), and minimum negative gradient (min-grad-neg).
Additionally two different classification parameters were added to the feature list. Firstly 27 unique classifiers including surface, tire pressure and riding velocity, secondly only three unique classifiers consisting of the three surfaces examined.
After having prepared the data in the fashion mentioned above, machine learning algorithms (MLA) were applied onto the datasets. A classification learner routine was conducted with the two different classifiers and all features. This was done for the features extracted from both the one and two second windows for acceleration sensor as well as phone data. Firstly the 27 unique classifiers, secondly only three classifiers were applied using a total of 22 different machine learning algorithms from the categories decision tree, linear and quadratic discriminant, support vector machine (SVM) and k nearest neighbor (kNN). For validation a 5-fold cross validation was used, the algorithm showing the best prediction accuracy was chosen and confusion matrices plotted.
Furthermore the number of features was reduced and the most successful MLA was performed again to evaluate whether a result of similar accuracy could be achieved with fewer features.
3. Results
The results of the machine learning algorithms applied to the data showed distinctive differences depending on the sensor, the size of the time window and the number of classifiers used for the classification learner (
Table 1).
As expected, a finer classification (i.e., using 27 unique classifiers) resulted in less accuracy of the model than using only 3 unique classifiers. Whereas for the acceleration sensor data for both number of classifiers high prediction accuracy could be reached (27 classifiers: >95%, 3 classifiers: >99%), for phone data 27 classifiers yielded accuracy less than 50%. The results for classification with only three classifiers yielded more than 97% of prediction accuracy. Furthermore, it could be noted, that window-sizes of 1 s mostly resulted in less accuracy than larger window-sizes of 2 s.
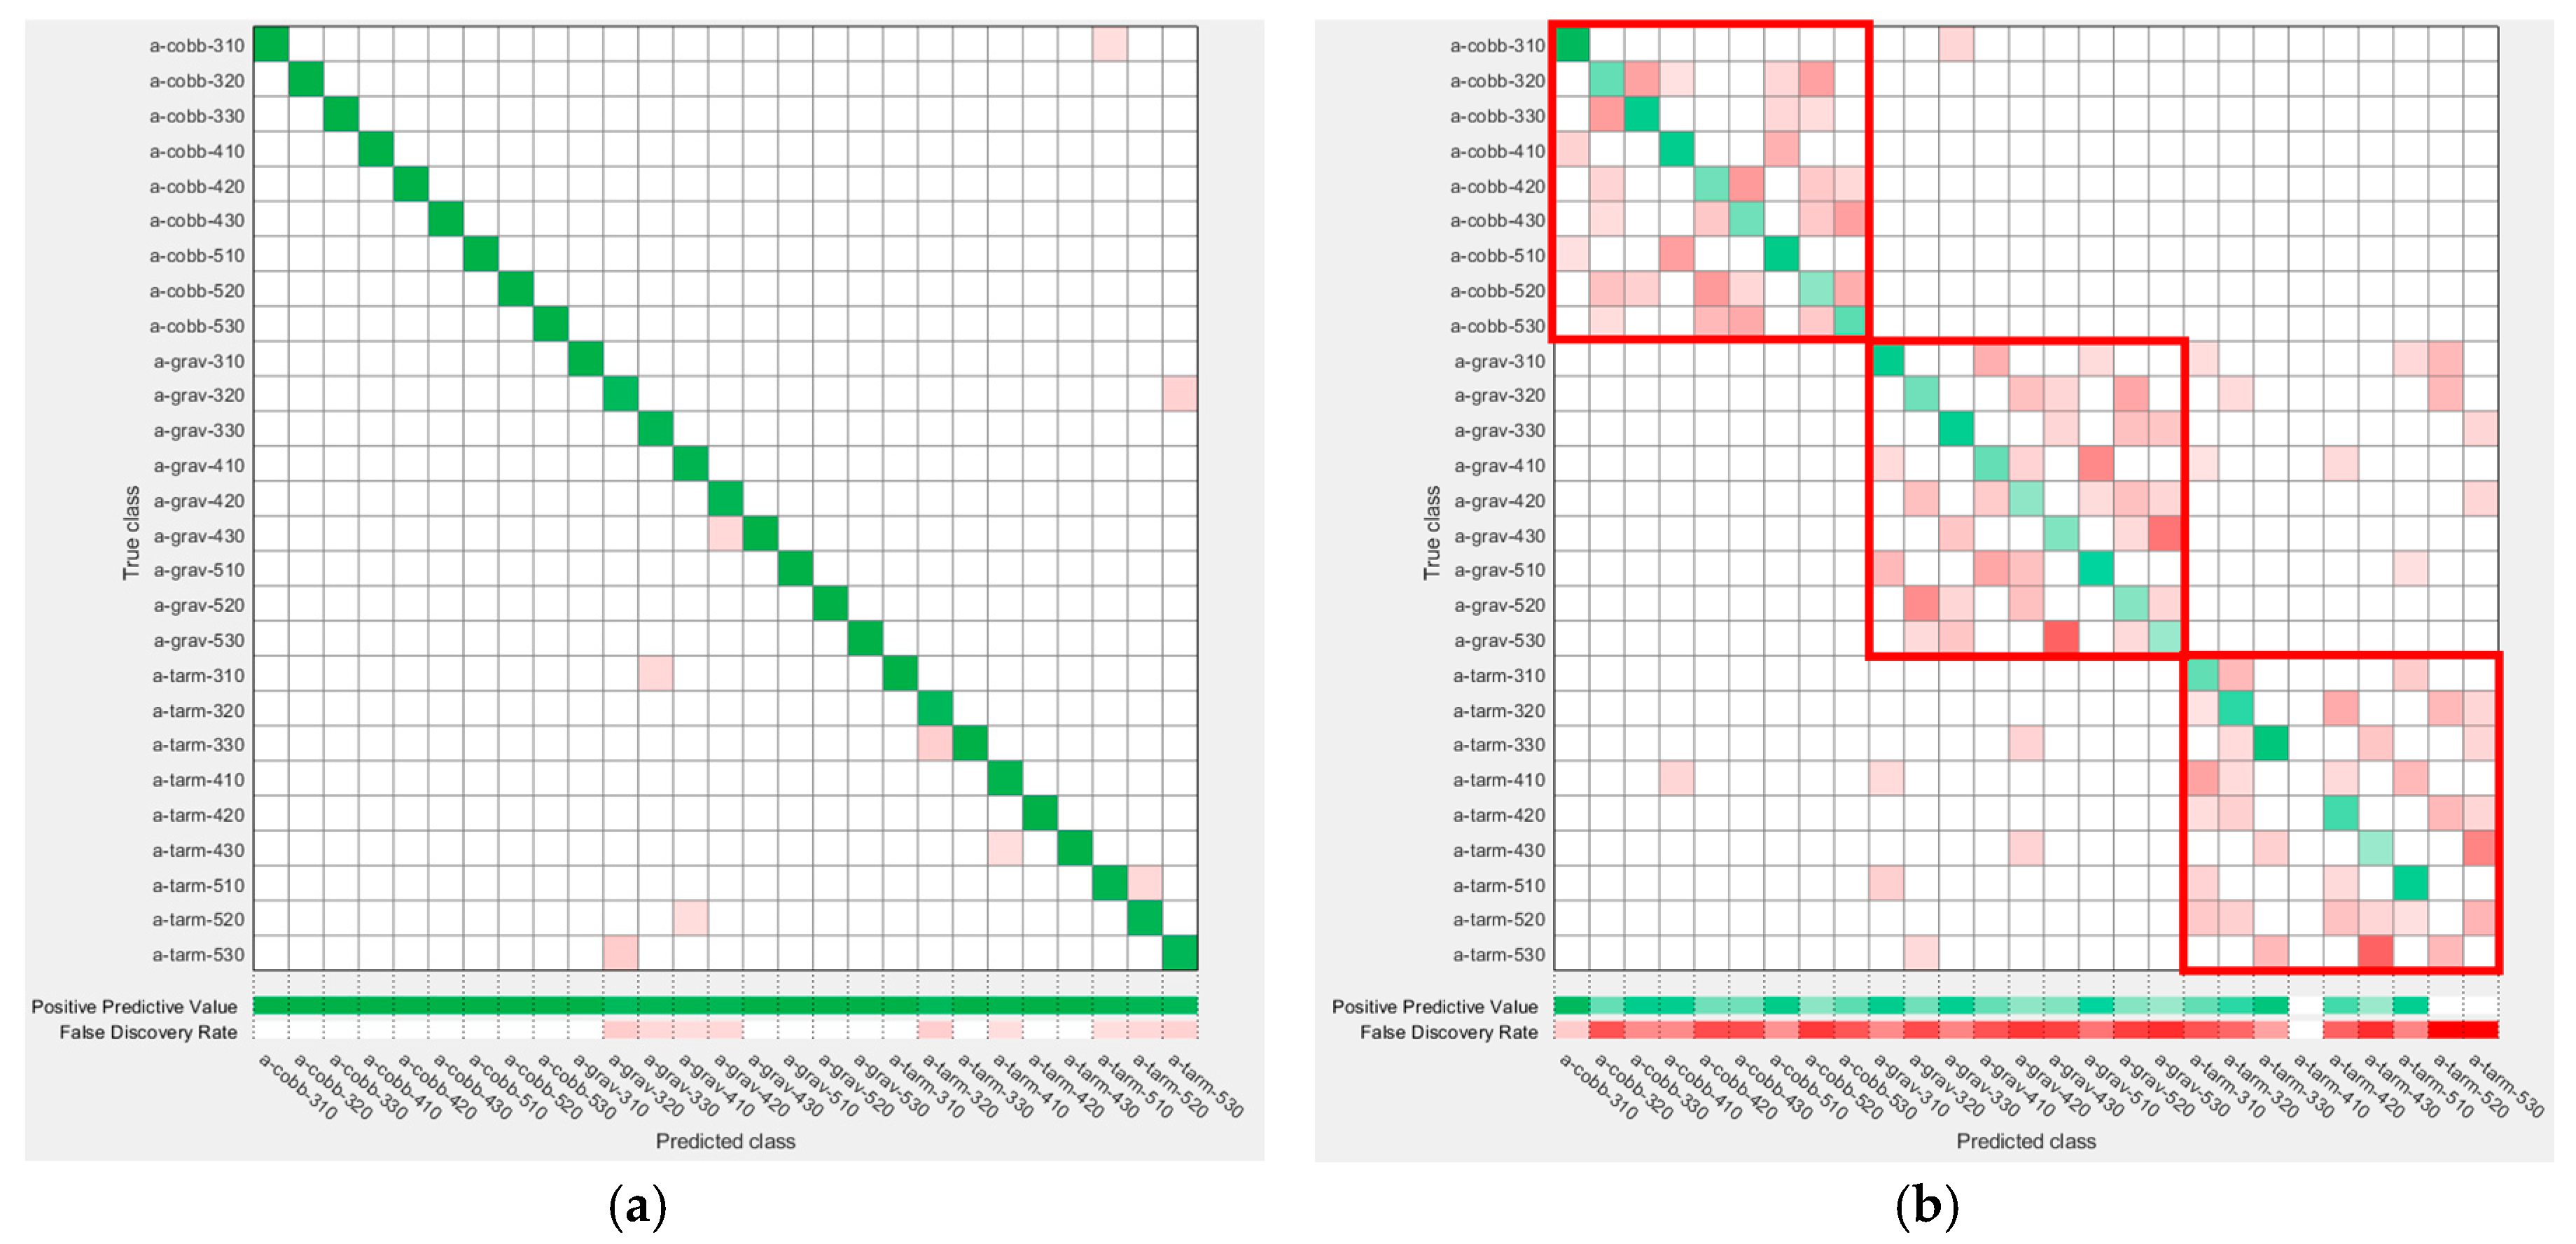
However, when closer inspecting the confusion matrix for phone data for 27 classifiers, it was observed that although many predictions were not correct they were mainly confused between different speeds and pressure settings but the surface type itself was still correctly classified (
Figure 3b) which is highlighted by the red squares.
For a-sensor data only few observations were classified incorrectly (
Figure 3a).
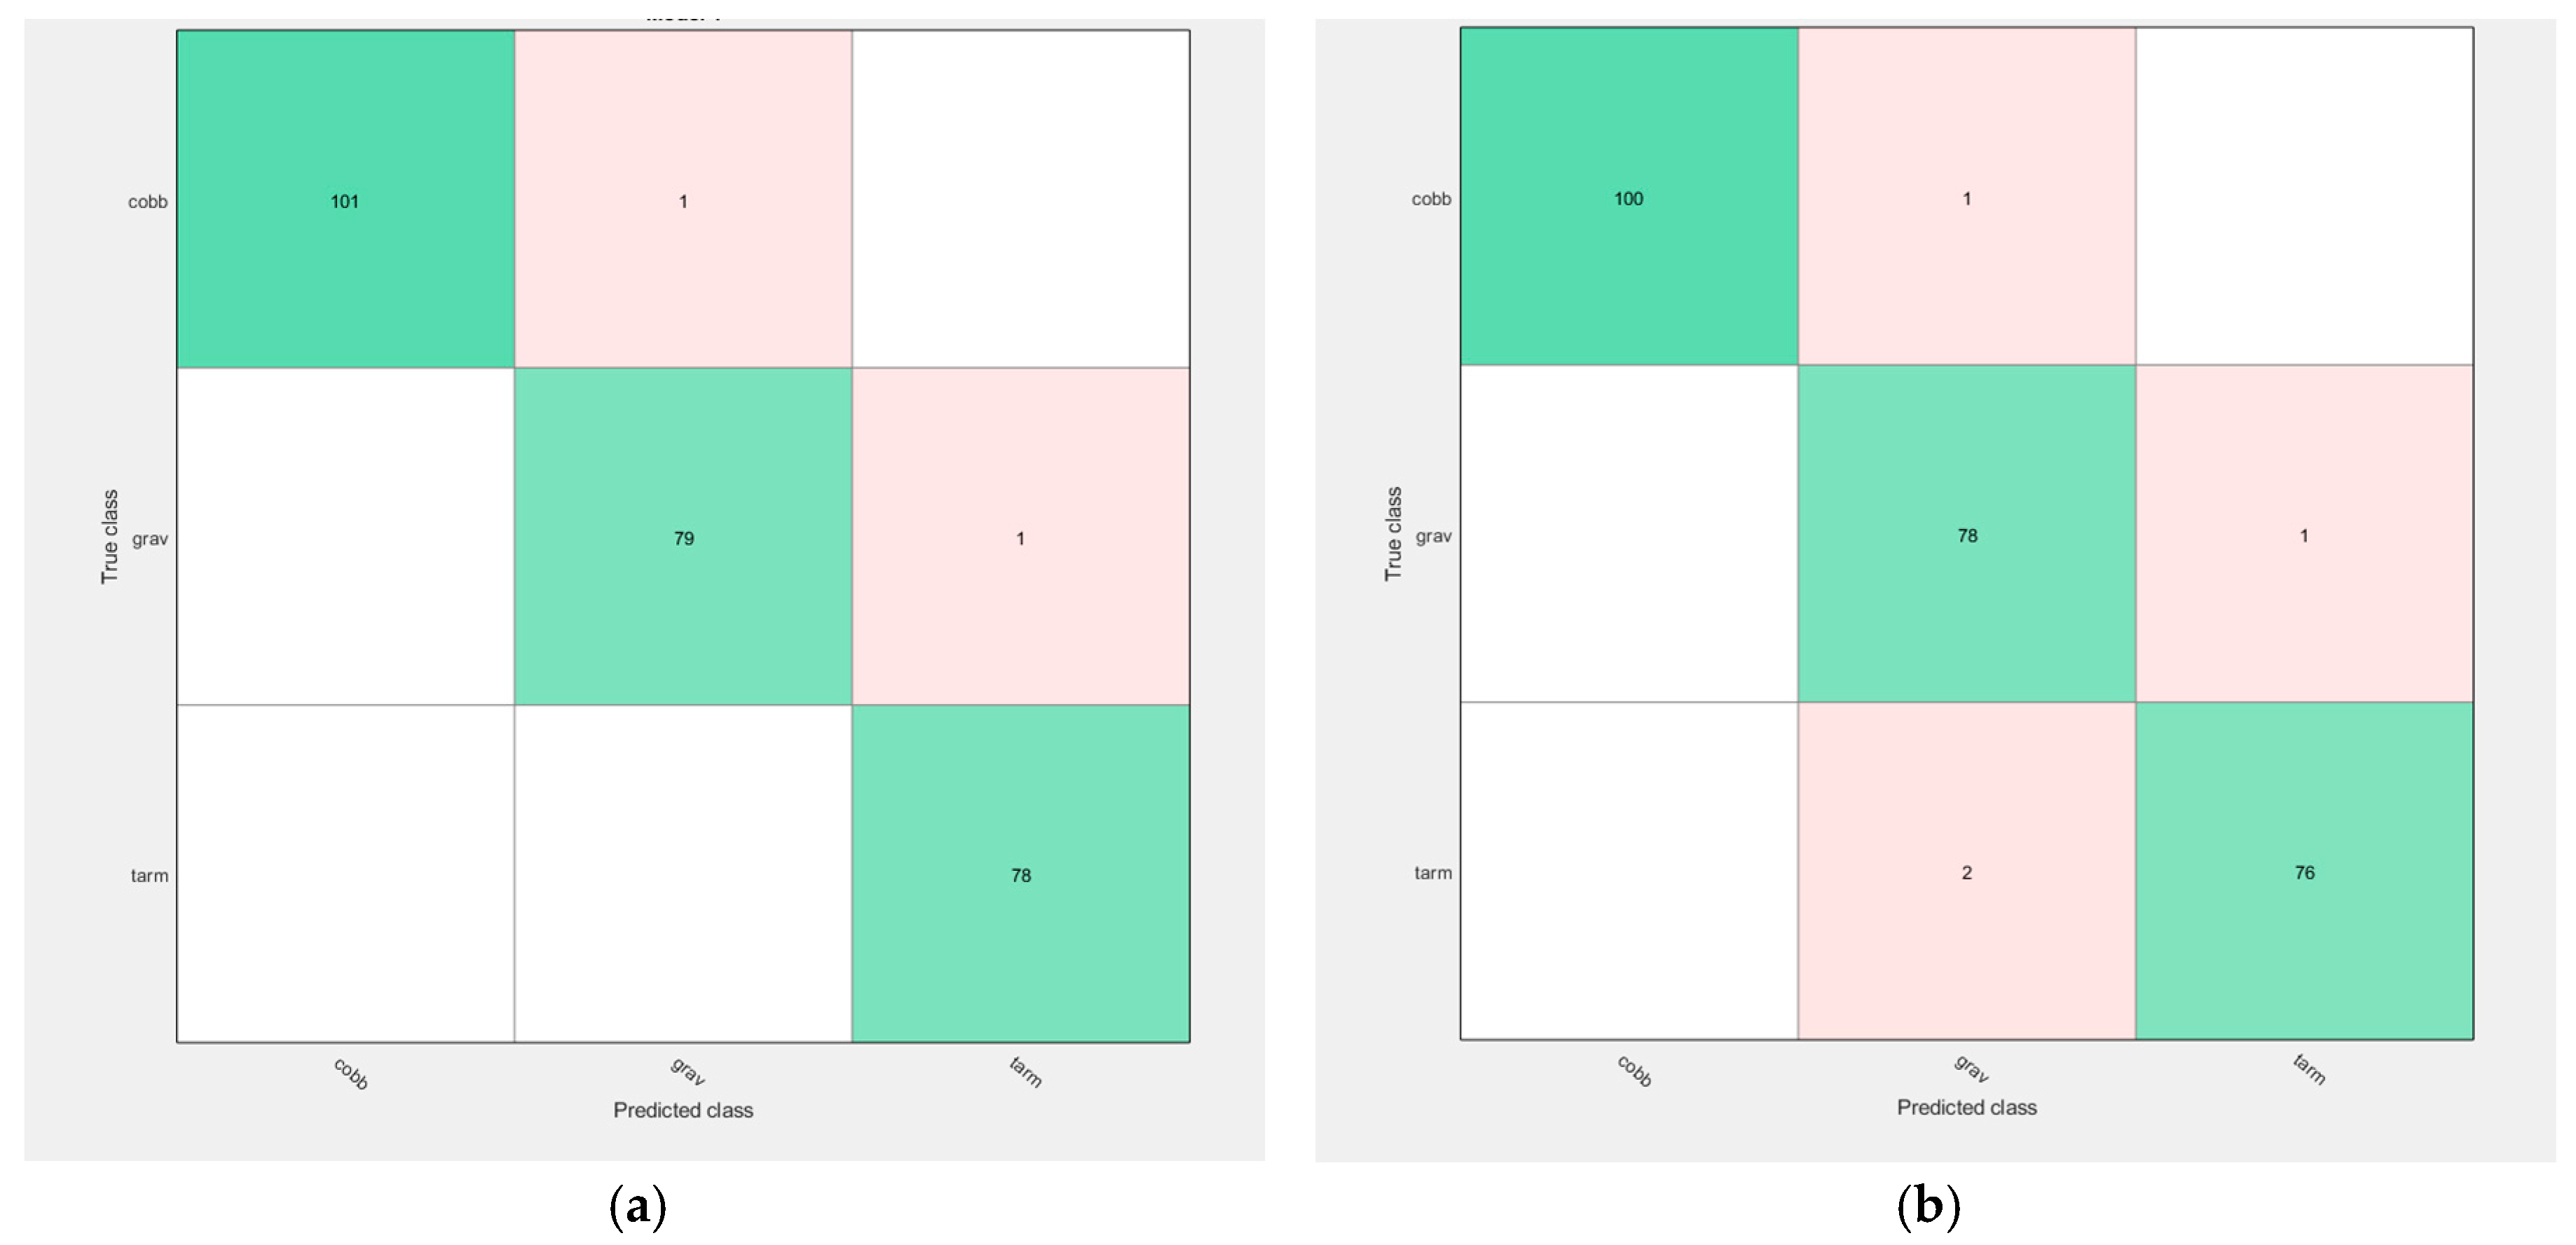
Figure 4 shows the resulting confusion matrices when only 3 classifiers (cobblestones, gravel, tarmac) were used. For both sensor systems (a-sensor:
Figure 4a and phone:
Figure 4b) only few predictions were incorrect. It was interesting to observe, however, that a feature reduction nearly always immediately resulted in a decrease of prediction accuracy.
4. Discussion
The main purpose of this study was to determine whether road surface quality could be quantified and therefore the type of road surface identified by using algorithm parameters that are applied momentarily. We wanted to (1) evaluate the road surface quality using a 3D accelerometer and find out whether (2) results of similar quality can be achieved using the acceleration sensor of a smartphone placed in the cyclist’s pocket.
For this purpose data were collected on different surfaces, with different speeds, and tire pressures. They were analyzed ex-post using machine learning algorithms, with either 27 classifiers (3 surfaces, 3 speeds, 3 tire pressures), or three classifiers (3 surfaces). A total of 64 features for different time-windows were extracted from the data and used for classification learning. Results showed that when 27 classifiers and a time-window of one second are used it was possible to correctly identify more than 97% of the data with the acceleration sensor, but less than 50% with the phone. In case only three classifiers are used more than 97% can be correctly identified with both systems (a-sensor: 99.2%, phone: 97.7%).
It is concluded that road surface (cobblestones, gravel, tarmac) can be predicted with high accuracy when using an acceleration sensor mounted on the fork with a recording frequency of 500 Hz (up to 99.2% correctly classified) and that furthermore even different speeds and tire pressures along with surface can be classified correctly (up to 97.9%, cf.
Figure 3a). Using the smartphone sensor’s data accuracy for 27 classifiers was less successful resulting only in 48.2% of correctly classified data. However, it has to be noted that the surface still could be identified correctly and mostly different riding speeds and tire pressures were confused (cf.
Figure 3b), these results are also supported by the confusion matrix for 3 classifiers (
Figure 4b) where a total of 97.7% could be classified correctly as being cobblestones, gravel or tarmac.
From these results it can be concluded that given the data collected and analyzed so far it is possible to identify the surface correctly with data from a smartphone worn in a cyclist’s pocket. It has to be pointed out, however, that this study has only limited explanatory power given the low number of observations. Future research should include more bicycle types (e.g., road, mountain) and different placements of the smartphone in the cyclist’s pocket (e.g., front pocket, cycling jersey’s back-pocket, backpack). Whether it will be possible to quantify different quality grades for one surface needs to be examined in further trials.


