Proceeding Paper

Finite Element Model of an Impact on a Palmar Pad from a Snowboard Wrist Protector †

1
Sports Engineering TEAM, Manchester Metropolitan University, Manchester M1 5GD, UK
2
School of Healthcare Sciences, Manchester Metropolitan University, Manchester M1 5GD, UK
3
Advanced Manufacturing Research Centre, University of Sheffield, Sheffield S60 5TZ, UK
4
Centre for Sports Engineering Research, Sheffield Hallam University, Sheffield S10 2LX, UK
*
Author to whom correspondence should be addressed.
Presented at the 12th Conference of the International Sports Engineering Association, Brisbane, Queensland, Australia, 26–29 March 2018.
Proceedings 2018, 2(6), 314; https://doi.org/10.3390/proceedings2060314
Published: 22 February 2018

Abstract

:
Wrist injuries are the most common types of injury in snowboarding. Protectors can reduce injury risk by limiting wrist hyperextension and attenuating impact forces. There are a range of wrist protector concepts available, but it is unclear if any particular design is more effective. The aim of this study was to develop and validate a finite element model of an impact on the palmar pad from a protector. Pad material from a protector was characterised to obtain stress vs strain data, and determine whether it was rate dependent. Material data was implemented into a finite element model to predict impact behavior at 2.5 J. Four material models were investigated, with an Ogden model paired with a Prony series providing the best agreement to experimental data. Future work will build a model of a complete protector for predicting the protective levels of these products.

1. Introduction

Ten to fifteen million people participate in snowboarding worldwide [1]. Injury risk whilst snowboarding is higher than alpine skiing, with the forearm and wrist being the most common injury site, accounting for ~35 to 45% of all injuries [2]. Wrist protectors can reduce the risk of injury to this region by limiting hyperextension and attenuating impact force [3,4]. There are a range of wrist protectors available (e.g. short, long, palmar or dorsal splints), but there is little consensus as to which design offers the most protection. There are common elements of a protector even with design variation, which can include a splint/s often made of injection moulded plastic and a palmar pad typically made of foam. At present, there is no Standard for snowboard wrist protectors, but a working group (ISO 20320–EN ISO WD 20320) are currently developing one. As part of the process of developing a standard, experimental protocols have been developed for characterising snowboard wrist protectors (e.g., Adams et al. [5]). EN 14120 covers wrist protectors for roller sports, which are relatively similar to those designed for snowboarding.
Finite Element Analysis (FEA) is an established technique that could be applied to further our understanding of wrist protector design concepts prior to the need for prototypes. Previous studies have attempted to create FE models of snowboard wrist protectors (e.g., Mao et al. [6] and Thoraval et al. [7]), but these have been overly simplified. The following study aims to develop and validate an FE model for an impact on the palmar pad from a wrist protector, with future work building to a complete wrist protector.

2. Materials and Methods

2.1. Material Characterisation

A candidate wrist protector (certified to EN 14120)—with splints on the palmar (70 mm) and dorsal (145 mm) side and a palmar pad topped with a plastic shell—was selected for FE model development. Infrared Spectroscopy (Spectrum 2, Diamond ATR L1600235, Perkin Elmer Inc.) identified the pad as polyurethane foam and the shell as High Density Polyethylene (HDPE).
Eight pads (~1850 mm2 surface area) were extracted from four pairs of protectors (same size/brand). A 38 mm diameter cylindrical compression sample was extracted from four of these pads. Thickness ranged from 5.5 to 7 mm both within and between samples, due to inconsistencies in pads. Compression testing was performed to 50% strain to obtain stress vs. strain relations at displacement rates of 5, 50, 500 and 5000 mm/min (0.018, 0.18, 1.8 and 18 s−1 strain rates), with the plates lightly greased. Each sample was compressed five times to check for stress softening (e.g. Mullin’s effect) and sample repeatability, with a one minute rest between compressions where the plates were wiped free from any debris and re-greased. All four samples were tested, retesting then commenced 19.5 hours later at the lowest strain rate (0.018 s−1) to check for softening/degradation. Low strain rates (0.018–1.8 s−1) were performed on a Hounsfield HK10S material testing machine with a 1,000 N load cell and for high strain rates (1.8–18 s−1) an Instron Universal testing machine with a 5 kN load cell was used. These maximum strain rates were chosen as they represent close to the maximum speeds of the two machines. A pre-load of 0.5 N was applied prior to testing.
A second test was conducted, to assess for viscoelastic response, using a stress relaxation technique (Instron Universal testing machine). One of the same four samples (6 mm thickness) was compressed to 10%, 25% and 50% strain at the highest strain rate (18 s−1) and held for 600 s with stress recorded.

2.2. Impact Testing

The remaining four samples were impact tested, using a bespoke drop tower rig, consisting of a 1.6 kg mass on a Linear guide carriage (488–5136), moving on a Linear guide rail (WS-10-40-1000 488-5243, RS Components Ltd., Corby, UK). A single axis accelerometer (352B01 PCB®) was placed close to the centre of the drop mass, and connected to a digital oscilloscope (PicoScope® 4424) via an ICP® sensor signal conditioner (480B21, PCB®). A trigger level of 100 mV (10g) was applied on the oscilloscope in order to capture the signal corresponding to impact, which was sampled at a rate of 5 MHz, with a resolution of ~0.01g. Impacts were filmed with a high-speed camera (Phantom Miro R110, Vision Research UK Ltd., Bedford, UK) set at a resolution of 512 × 320 and a capture rate of 10,000 Hz.
Impact energy was 2.5 J (0.16 m, 1.6 kg), corresponding to half of the value specified in EN 14120 for an impact on the palm of a protector. Half the energy was used as the pad was in isolation, to limit degradation and/or to avoid “bottoming out”. A magnet coupling (F4M905 70kg Pull, First4Magnets®, Tuxford, UK) was used to release the drop mass. Pilot testing was performed to assess for sample degradation/stress softening following repeated impacts. Each pad was impacted ten times (five in isolation, followed by five with the shell covering), with 5 minutes between trials. These pilot tests indicated there was no clear evidence of degradation or stress softening. Therefore, a further ten impacts were performed on each sample (five in isolation and five with the shell) with five minutes between trials, and the results of these tests are presented. Tests were performed at room temperature (~25 °C).

2.3. Finite Element Modelling

Geometries of the pad and shell were created in Solidworks 2016 24.0 (Dassault Systems). The CAD technique used was through the ‘sketch to image’ tool, tracing a scanned 2D image (Samsung MultiXpress X4300LX copier, Gyeonggi-do, Korea) of the pad and shell. The geometry was imported into Ansys Workbench Mechanical v18.1. A 2.5 J impact of a 7 mm pad, with and without a 3 mm shell, from a rigid plate (1.6 kg, 1.77 m/s) were modeled using the explicit dynamics code LS-DYNA vR8.1.0 (Livermore Software Technology Corporation, Livermore, CA, USA).
The pad was meshed with 45,351 solid tetrahedral elements (ELFORM 10) and the two plates with 22,050 solid brick elements (ELFORM 1). A rigid material model was assigned to both plates, the bottom fixed and the top plate given a velocity of 1.77 m/s. An *Contact_Automatic_Surface_To_Surface with a coefficient of friction of 0.5 (static and dynamic) was applied between the pad and plates. A *Contact_Tied_Surface_To_Surface was used between the pad and shell.
Four material models were compared to see which gave the best representation of pad behavior under impact. A density of 65 kg/m3 (mean of the compression samples), a Poisson’s Ratio of 0.44 and the stiffest stress vs. strain data (18 s−1 strain rate), was used throughout (Young’s Modulus of 0.3 MPa). The material models [8] included, (i) a linear elastic model, (ii) a foam model, *Mat_Low_Density_Foam (Mat57) with a damping factor of 0.05, (iii) a hyperelastic material model 1 parameter Ogden (µ1 31512 Pa, α1 5.319) combined with a 2 term Maxwell Prony Series (α1 0.2075 MPa, α2 0.1035 MPa, t1 0.2166, t2 4.6658) and (iv) a linear viscoelastic model. All these models have been used previously when modelling sports equipment e.g., [9,10,11,12]. The Prony series coefficients and linear viscoelastic model parameters were obtained through matching to the first 20 s of the 50% compression stress relaxation data after full compression was achieved (Figure 1d). The first 20 s of data was used because when the full 600 s was trialed, although the coefficients were different, the impact model results were the same. The shell was assigned a linear elastic material model with a density of 970 kg/m3, Young’s Modulus of 0.3 GPa and a Poisson’s Ratio of 0.4, as used elsewhere for HDPE [12].
When large deformations occur in soft foams there are recommended analysis settings to prevent elements becoming distorted (negative volumes) [13], which were used. These settings included using a time step scale factor of 0.5, meshing the pad with solid tetrahedral elements and changing the contact setting to SOFT = 1.

3. Results

Figure 1 shows that the foam does not show signs of stress softening and does not degrade after multiple compressions at the same rate, showing repeatability (a). Sample consistency (b) however, is not very high with pads ranging in stress at the same applied strain and strain rate. The pad can be seen to be rate dependent (c) and viscoelastic (d), so these properties may need to be implemented in to the model in order to obtain the correct response under impact.
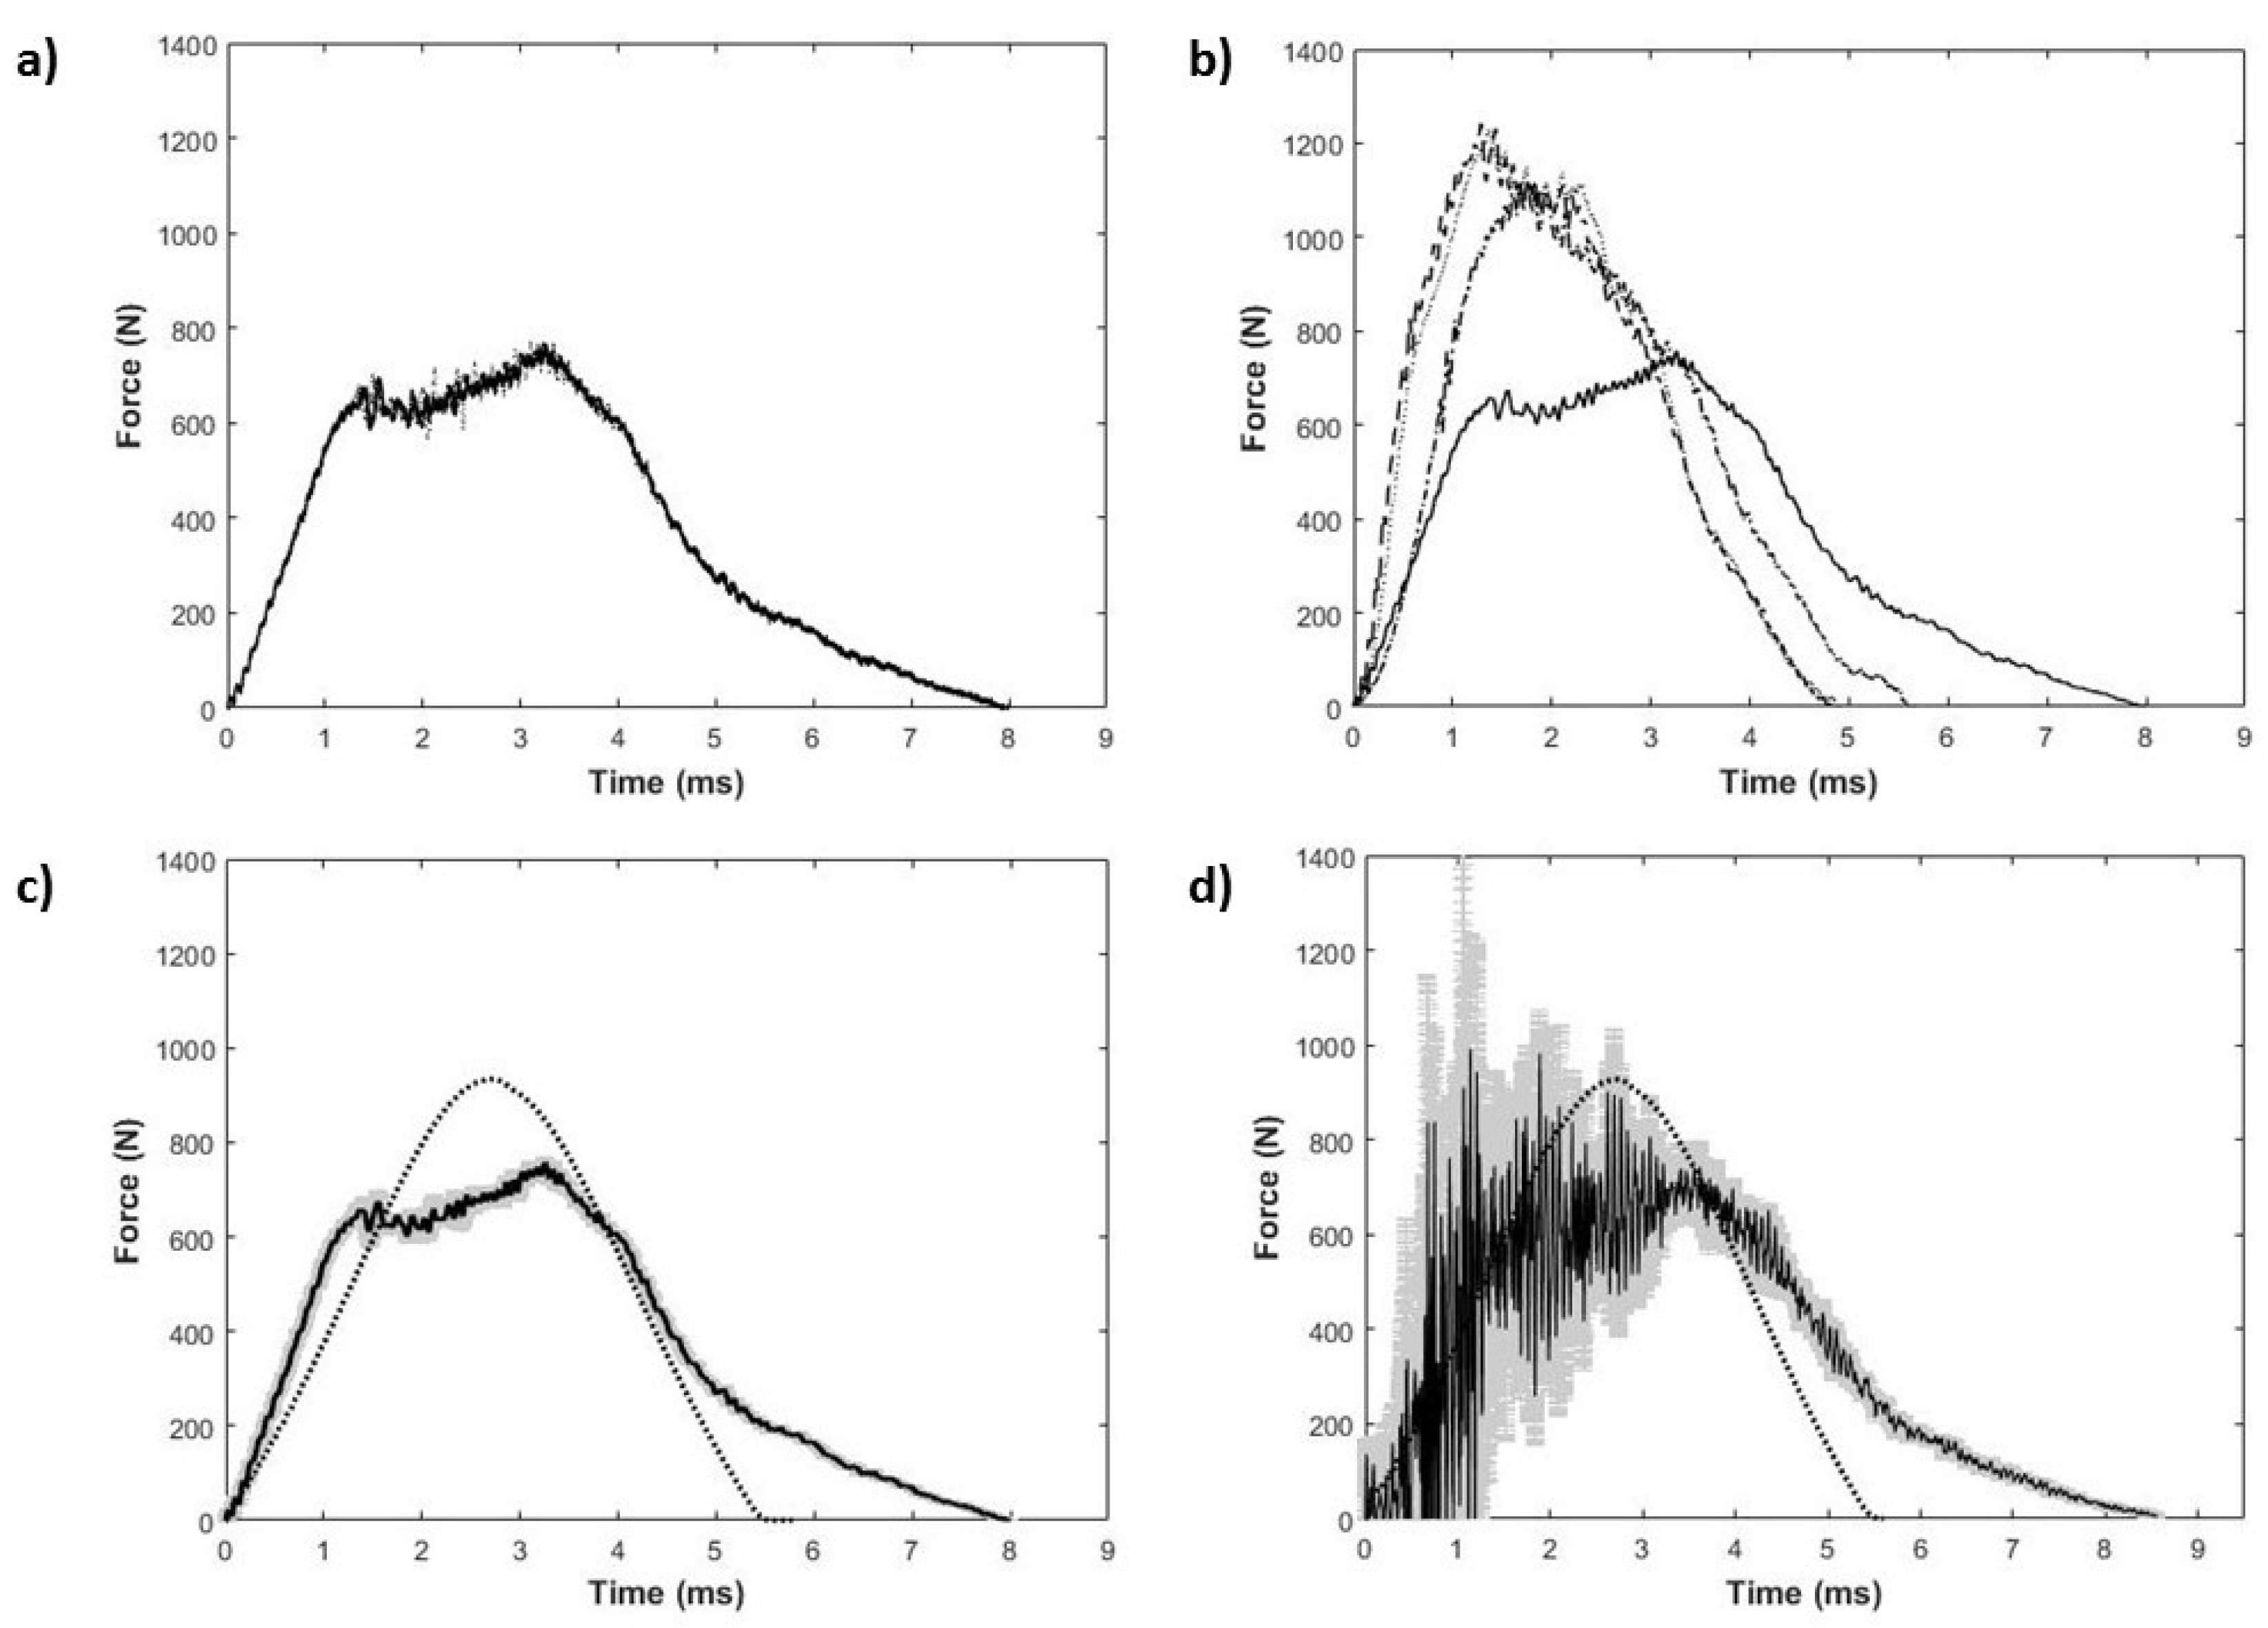
Experimental impact response gave a peak force range of 735 to 1,270 N for the pad in isolation and 760 to 1425 N with the shell on top. Impact time, from camera footage (Phantom Camera Control 2.8) ranged from 6 to 8 ms without the shell and 4 to 8 ms with a shell. Samples were repeatable (Figure 2a) but again sample consistency was low (Figure 2b).
For the FE models, when using the raw material data to obtain coefficients, all but the Ogden model paired with the Prony series resulted in excessive axial compression of the pad, which often led to simulation errors (e.g. negative volumes). Artificially stiffening the material model data [12] gave results that were in reasonable agreement with the experiment. Young’s Modulus in the linear elastic model required stiffening by a factor of ~5, while the *Mat_Low_Density_Foam and Linear Viscoelastic model required further stiffening (factor of ~6.5). The Ogden model paired with the Prony series, was achieved through the use of the raw 18 s−1 compression data and the first 20 s of the 50% stress relaxation data. An example impact on Sample 4 (7 mm pad) and the Ogden paired with the Prony series with and without the shell can be seen in Figure 2c,d. High frequency vibrations can be seen in the experimental data due to a rigid anvil impacting a stiff shell, but this was not apparent in the model (Figure 2d).
Maximum compression of the pad under impact was 45 ± 4% (mean ± standard deviation) and lateral expansion reached 3 ± 1% (Figure 3a). For the pad and shell combination, maximum compression was 31 ± 7% and lateral expansion 3 ± 2% (values for the pad only). The FE model matched the experimental deformation well, with a maximum compression of 45% and lateral expansion of 3% (Figure 3b) for the pad. The pad and shell combination FE model, gave a maximum compression of 32% and lateral expansion of 4%.

4. Discussion

Compression testing of the pad showed typical polyurethane foam characteristics [9], an initial elastic region followed by a plateau followed by further stiffening. The different material testing machines used showed some inconsistency (at the same rate 1.8 s−1), but, the trend of rate dependent behavior was consistent. The 1.8 s−1 rate on the Hounsfield HK10s was at 90% of its maximum which could explain discrepancies.
The compliant nature of the pad meant that when replicating an impact, negative element volume errors occurred within LS-DYNA. The pad material demonstrated rate dependency characteristics, and under impact, it would have experienced considerably higher strain rates, behaving with stiffer material properties than those obtained. Testing the material at these high strain rates with the equipment used here was not possible, therefore artificially stiffening the stress vs. strain curve within the model had to take place in three of the four models trialed. Future work could explore options for testing at higher strain rates e.g., [9].
Ranga and Strangwood [14] highlighted that when using stress relaxation data the ‘factor-of-ten’ rule [15] should be used. Due to machines not being infinitely quick to compress the sample, there is a proportion of acceleration and therefore pure relaxation data is not obtained. Using the ‘factor-of-ten’ rule to obtain the coefficients for the Prony series produced results which deviated largely from the experimental data, therefore the instantaneous data (after 50% compression was reached) followed by the next 20 s of data points was used. The full 600 s worth of stress relaxation data was trialed but produced the same impact response as that of the 20 s data. Future work could look at exploring how much data (after full compression) is required before the impact response stops changing. Using the full stress relaxation data rather than the ‘factor-of-ten’ rule was effective in this study (Figure 2c,d). However, whilst using the stress relaxation from the point of full compression gave accurate results under impact, the material model used may not fully represent the true relaxation response of the material. Therefore, further work should check to see if using a larger factor closer to that of obtaining pure relaxation would still show a good match.
Comparing the results from the pad in isolation and pad with shell combination showed no clear difference in the FE model or experiment, apart from vibrations when the shell was added. The model showed a reasonable match to the experimental data for an impact energy of 2.5 J. Future work should explore a range of impact energies to check the model still shows a good match for all parameters (temporal deformation and force and contact time). Other material models and parameters could also be explored (e.g., Mooney-Rivlin paired with the Prony series), along with further refinement of the models used. Future work could also include measuring the Poisson’s Ratio of the foam pad for implementation within the model.
Modelling an impact of a pad/shell scenario is challenging due to inconsistency between samples extracted from the same size/brand wrist protectors. The variation in size and performance may influence the overall protection offered by the device, reiterating the need for a standard for snowboard wrist protectors.

5. Conclusions

Through material characterisation, an impact of a palmar pad from a snowboard wrist protector was replicated in an FE model both in isolation and with a shell. Different material models were investigated to replicate this behavior, and an Ogden model paired with a Prony series was the most successful, showing good agreement to the experimental impact data. Future work will apply similar techniques for the other elements of the wrist protector leading up to a complete wrist protector impact simulation.

Acknowledgments

The authors would like to thank Stephen Moyle, Bob Bamford and Mike Green for all their technical support with testing and aiding to build the bespoke impact rig.

Conflicts of Interest

The authors declare no conflict of interest.

References

  1. Michel, F.I.; Schmitt, K.-U.; Greenwald, R.M.; Russell, K.; Simpson, F.I.; Schulz, D.; Langran, M. White Paper: Functionality and efficacy of wrist protectors in snowboarding—Towards a harmonized international standard. Sports Eng. 2013, 16, 197–210. [Google Scholar] [CrossRef]
  2. Russell, K.; Francescutti, L.H.; Hagel, B. The Effect of Wrist Guards on Wrist and Arm Injuries among Snowboarders: A Systematic Review. Clin. J. Sport Med. 2007, 17, 145–150. [Google Scholar] [CrossRef] [PubMed]
  3. Burkhart, T.; Andrews, D.M. The effectiveness of wrist guards for reducing wrist and elbow accelerations resulting from simulated forward falls. J. Appl. Biomech. 2010, 26, 281–289. [Google Scholar] [CrossRef] [PubMed]
  4. Hwang, I.K.; Kim, K.J. Shock absorbing effects of various padding conditions in improving efficacy of wrist guards. J. Sports Sci. Med. 2004, 3, 23–29. [Google Scholar]
  5. Adams, C.; James, D.; Senior, T.; Allen, T.; Hamilton, N. Development of a new method for measuring quasi-static stiffness of snowboard wrist protectors. In Proceedings of the ISEA 2016—The Engineering of Sport 11, Delft, the Netherlands, 11–14 July 2016. [Google Scholar]
  6. Mao, H.; Cai, Y.; Yang, K.H. Numerical study of a 10-year-old child forearm injury. Adv. Biomech. Appl. 2014, 1, 143–158. [Google Scholar] [CrossRef]
  7. Thoraval, C.; Hault-Dubrulle, A.; Drazetic, P.; Morvan, H.; Barla, C. Evaluation of wrist guard effectiveness for snowboarders. Comput. Methods Biomech. Biomed. Eng. 2013, 16, 187–188. [Google Scholar] [CrossRef] [PubMed]
  8. LSTC. LS-DYNA Keyword User’s Manual Volume II Material Models; Version 971/2017 (r:8528); Livermore Software Technology Corporation (LSTC): Livermore, CA, USA, 2017. [Google Scholar]
  9. Burbank, S.; Smith, L. Dynamic characterization of rigid foam used in finite element sports ball simulations. Proc. Inst. Mech. Eng. Part P J. Sports Eng. Technol. 2012, 226, 77–85. [Google Scholar]
  10. Allen, T.; Goodwill, S.; Haake, S. Experimental Validation of a Finite-element Model of a Tennis Ball Finite-element Model for Different Temperatures. In The Engineering Sport 7; Springer: Berlin/Heidelberg, Germany, 2008; Volume 7, pp. 125–133. [Google Scholar]
  11. Allen, T.; Fauteux-Brault, O.; James, D.; Curtis, D. Finite Element Model of a Cricket Ball Impacting a Bat. Procedia Eng. 2014, 72, 521–526. [Google Scholar] [CrossRef]
  12. Ankrah, S.; Mills, N.J. Analysis of ankle protection in Association football. Sports Eng. 2004, 7, 41–52. [Google Scholar] [CrossRef]
  13. LS-DYNA Support. Available online: http://www.dynasupport.com/howtos/element/negativ-volumes-in-brick-elements (accessed on 26 September 2017).
  14. Ranga, D.; Strangwood, M. Finite element modelling of the quasi-static and dynamic behaviour of a solid sports ball based on component material properties. Procedia Eng. 2010, 2, 3287–3292. [Google Scholar] [CrossRef]
  15. Sorvari, J.; Malinen, M. Determination of the relaxation modulus of a linearly viscoelastic material. Mech. Time-Depend. Mater. 2006, 10, 125–133. [Google Scholar] [CrossRef]
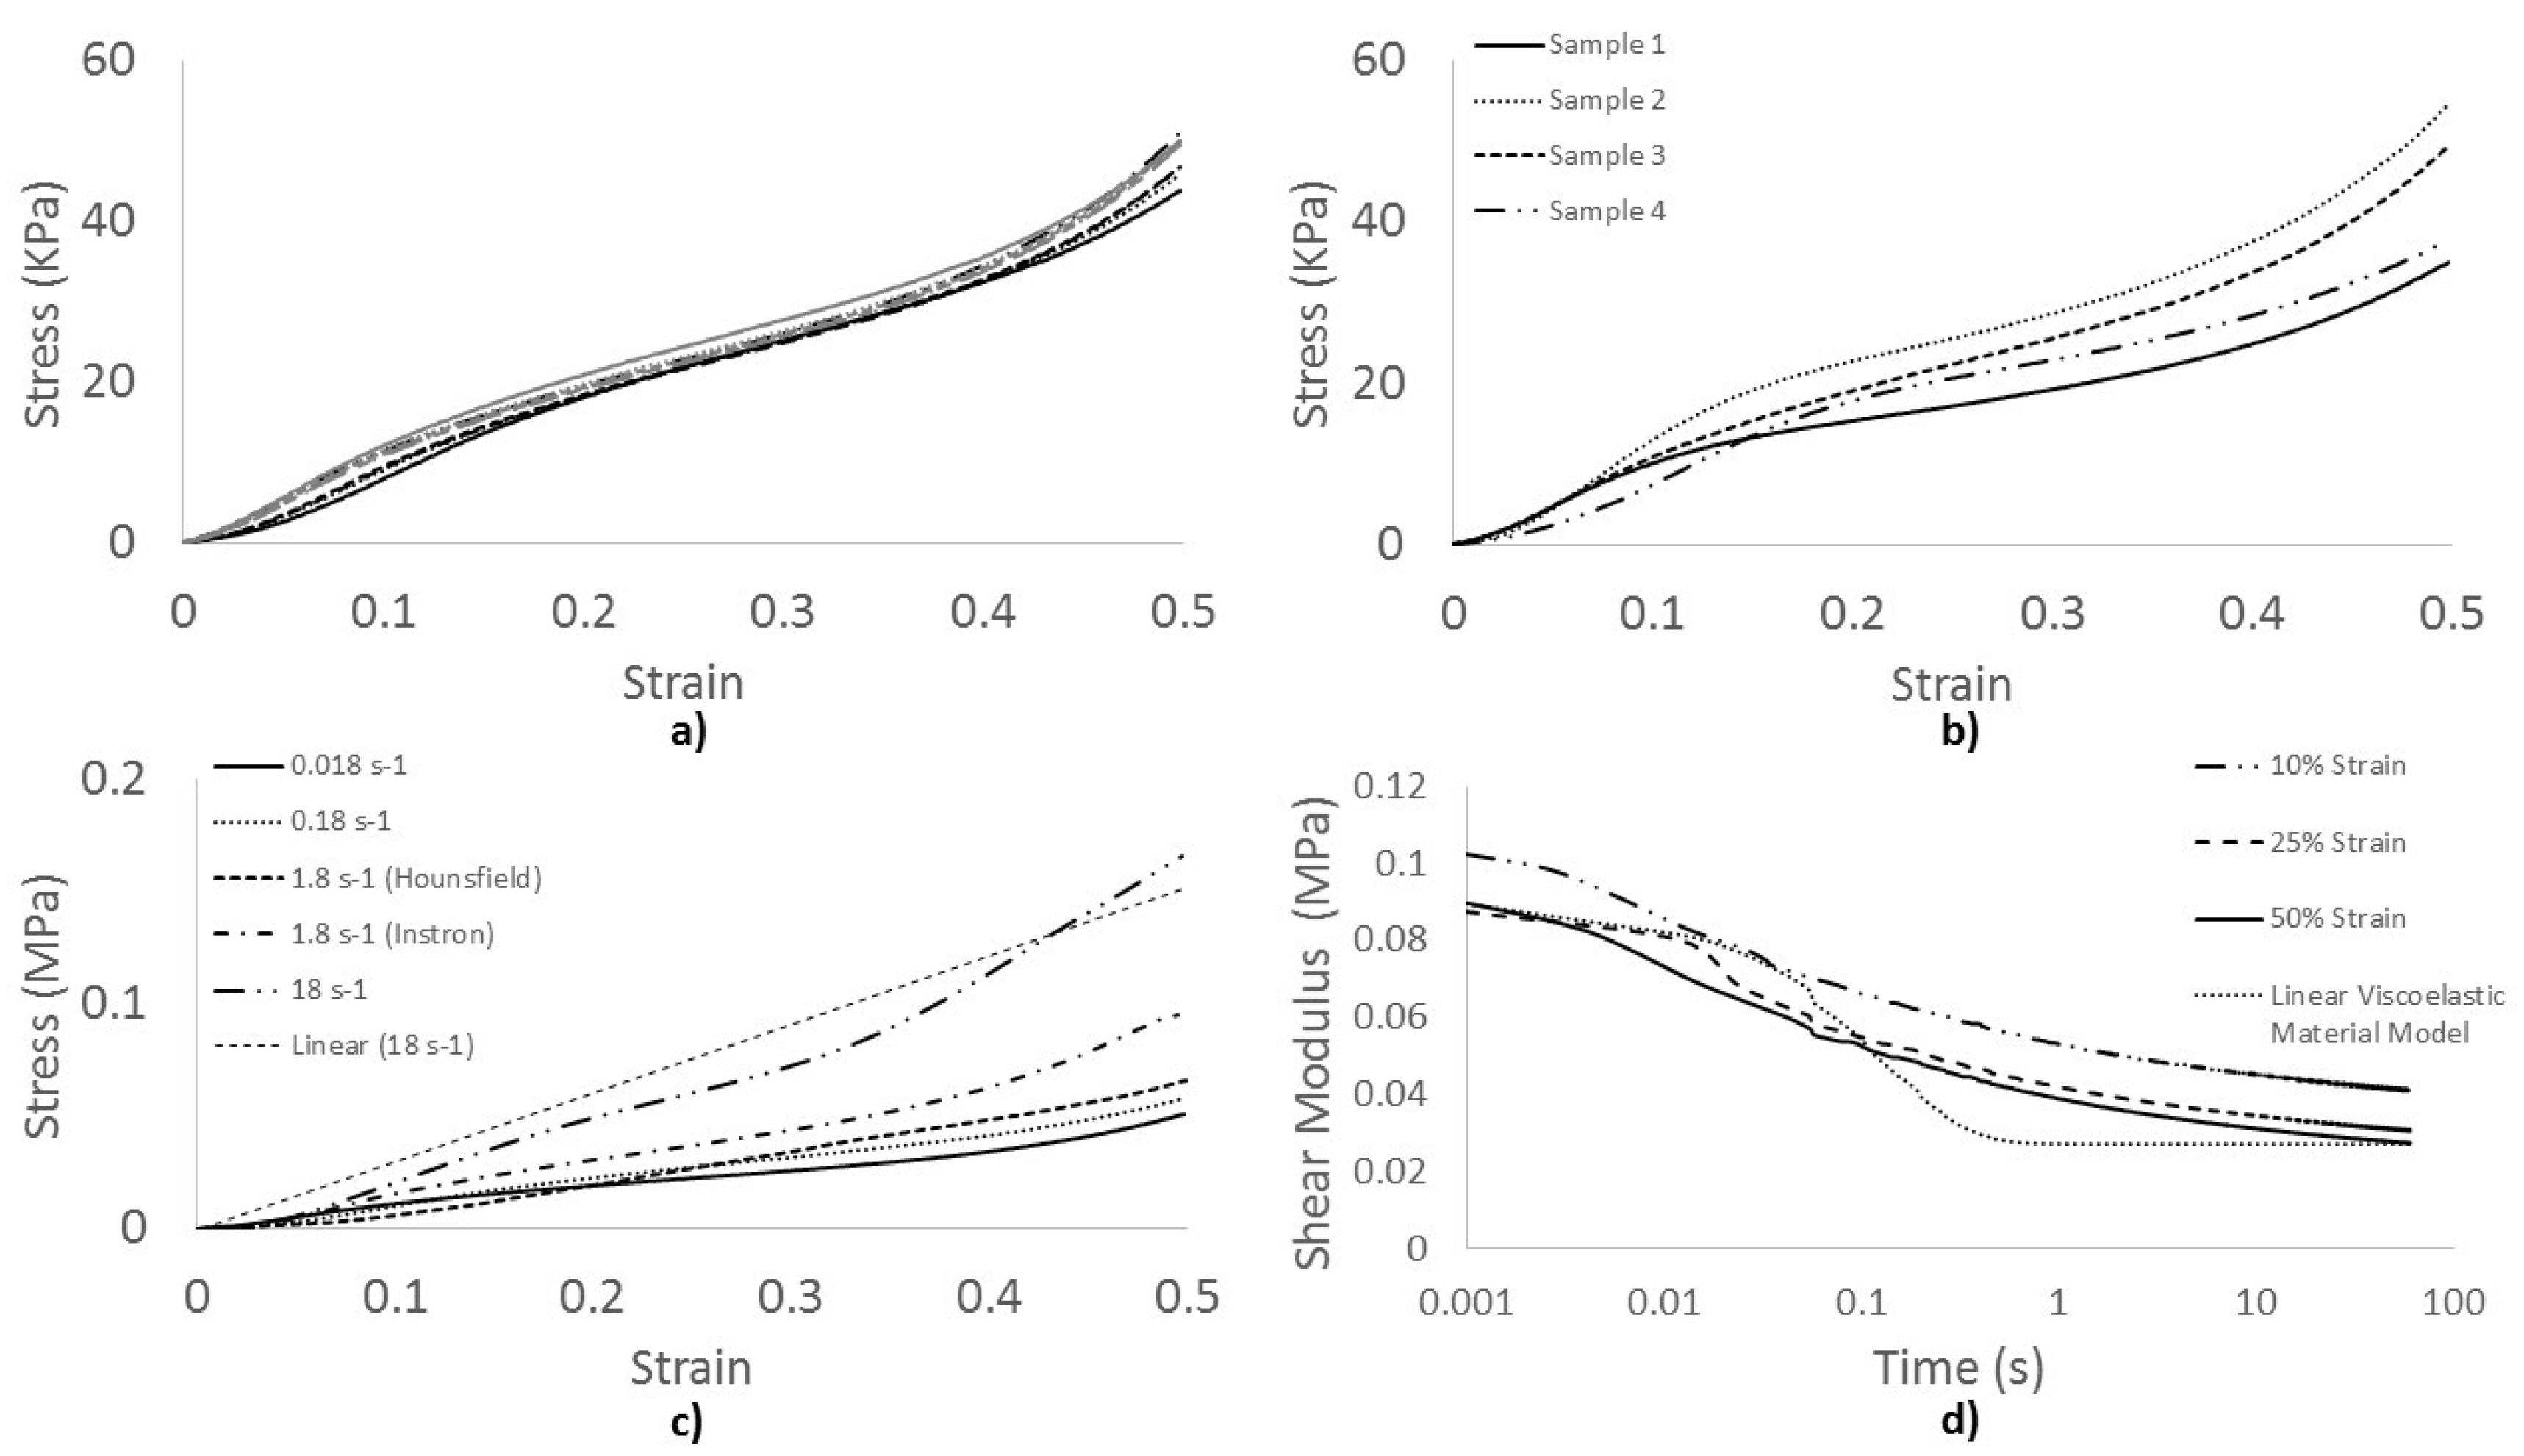
Figure 1. Example stress strain graphs for foam showing: (a) 10 repeats of Sample 3 at 0.018 s−1 strain rate (mean thickness 6 mm); (b) 4 samples at a strain rate of 0.018 s−1 (repeat 5 for each sample); (c) Sample 3 at a range of strain rates (0.018 s−1, 0.18 s−1, 1.8 s−1 and 18 s−1) with a linear trend line for the 18 s−1 data used to obtain Young’s Modulus for modelling (repeat 5); and (d) a shear stress vs time (log scale) graph for 1 sample at 3 strains (10%, 25% and 50%) plus the representative curve used in the linear viscoelastic model.
Proceedings 02 00314 g001
Figure 2. Force vs time plots for (a) 5 consecutive impacts on 1 sample (Sample 4), (b) all 4 samples (mean of 5 impacts), (c) FE model and experiment for the pad in isolation (Sample 4, mean and standard deviation of 5 impacts), (d) FE model and experiment for the pad and shell (Sample 4, mean and standard deviation of 5 impacts). FE model corresponds to Ogden + Prony series.
Proceedings 02 00314 g002
Figure 3. A pad in isolation prior to impact and at maximum compression (a) High speed camera image (sample 4), (b) Ogden + Prony Series FE model.
Proceedings 02 00314 g003
Publisher’s Note: MDPI stays neutral with regard to jurisdictional claims in published maps and institutional affiliations.