Abstract
the wind tunnel at the SportsTech Research Centre at Mid Sweden University (MIUN, Ostersund) was opened in 2015 for sports technology research. It is dedicated to analysis of equipment performance and garment development and suitable for roller skiing, running and cycling. The aim of this work was to develop and apply a full-scale method to investigate the aerodynamic behaviour of a cyclist facing front and cross wind at different yaw angles (from 0° to 30°) and speeds. To reach this goal, a rotating structure supported by a force platform was constructed. It includes a set of rollers on which fully unrestrained cycling is possible. The method was applied to the comparison of three wheelsets (differing in material, height and shape of the rim, number and shape of spokes) in terms of drag and side aerodynamic forces during a cyclist’s ride at 30 km/h, while keeping all the other factors constant. Resulting curves allowed estimating differences of 4% and 9% when applied to a recent time trial competition with supposed wind conditions.
1. Introduction
Bicycle and its use has experienced a wide development in the last years, especially due to its sustainability. Nowadays cycling is important as a mean of transport as well as being a competitive sport. Improving the aerodynamics has become a competitive advantage both for competing cyclists and companies. In fact, more than 90% of the power output of a cyclist is expended to overcome wind resistance at racing speeds on flat roads [1]. Despite aerodynamics of a conventional bicycle is far from the optimal [2], there is a strong effort to reduce aerodynamic drag acting on a cyclist and to have a better understanding of his interaction with the wind.
Three forces contribute to the total drag: drag of the rider and any streamlined apparel, drag of the bicycle frame and drag of the wheels. The first contribution is the dominant one but it is extremely difficult to determine accurately and consistently. Rider’s drag is about 60–70% of the total drag depending on the position [3,4]. The contribution of the wheels is from 10% to 15% [5] while, considering the whole bicycle (frame and wheels), it is about 31–39% of the total depending on rider’s position and wheels [1].
In this paper, a method for investigating cycling aerodynamics has been developed and then applied to compare the effect of three wheelsets on the wind resistance of a cyclist during his action in a controlled environment such as the wind tunnel. The method consists of unrestrained and full-scale tests with front and cross wind conditions, varying the yaw angle (angle between bicycle and wind of the tunnel directions). To have significant results, static tests alone are not sufficient [6] and wheels’ performance should be assessed from tests of wheels as a component in the bicycle-rider system [3].
The facility used is the wind tunnel laboratory at the SportsTech Research Centre of Mid Sweden University located in Ostersund, Sweden [7]. The rotor has a diameter of 2800 mm, which gives 10.5 m2 of test section cross-section area. The maximum speed reached is 55 km/h and it can be regulated at 0.1 km/h increments. In the working area there is a moving belt; 2.7 m wide and 5.5 m long that can be run independently from the wind or that can match the same speed. The belt can also be tilted upwards or downwards. On the roof of the testing area, there are reinforced beams to connect safety devices, load cells and water sprinklers, capable of generating conditions from fine mist to monsoon-like. The closed return circuit configuration has been used for this work: at the time of the study a splitter plate at the roller level was not yet available, as well mannequins on pedalling cranks. Therefore, an in-vivo study was adopted to check the suitability of the approach in the discrimination of wheelset performances. Given the well-known effect of rider’s position on the overall aerodynamics [4], the consistency of the rider arm alignment was evaluated by 2D photographic methods, even if it will not be reported in the paper.
2. Methods
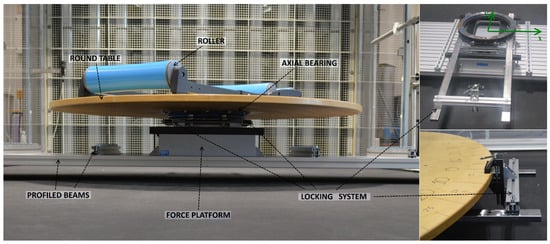
To analyse the cyclist’s interaction with the wind, the time-averaged aerodynamic force measurements technique has been chosen. A structure has been developed to investigate different angles of the wind (Figure 1). It is composed of a fixed part, lifted from the belt to allow its movement in order to have less flow diversion. This is possible with a flat surface of profiled beams linked to the base of the wind tunnel. A Kistler multicomponent force platform, recommended for measuring dynamic (type 9281EA, 1.25 kN of range in the horizontal plane, 1000 Hz of natural frequency and ±0.2% of linearity), lies in an upside-down position in the middle of this flat surface and it is stabilized from any movement and overturning. The mounting frame of the platform fixes the moving part of the system to the platform itself. An axial bearing is linked to the frame of the platform with bolts and it allows the rotation of a round wooden table. A set of yaw angles can be investigated by rotating the table and using a vice system to lock the position. Made of beams connected to the force platform, the locking system ends with a vice positioned on the rear part of the structure. Over the table, a commercial roller has been positioned, on which the cyclist can pedal with a total height between wheels and belt of 340 mm.

Figure 1.
Front view of the supporting system with all the parts and details of the locking system.
This structure allows to investigate the aerodynamic effect of different wind conditions on a cyclist that pedals without any constrains. The yaw angle can be turned without interruptions to the cyclist’s action (that may imply a possible change on its body position) by just unlocking the vice and rotating the table to the established new yaw angle.
The experiment compares three 28” wheelsets (Figure 2), differing in material, weight, height of the rim, shape and number of spokes, as expressed in Figure 2. An experienced cyclist pedalled in the tunnel with the three wheelsets keeping the following parameters constant: racing bicycle (Wilier Izoard XP model), body position (dropped position with straight arms, facing forward), garments, speed on the rollers, cadence, tires and pressure, wind speed and procedure of the experiments.

Figure 2.
Tested wheelsets.
The procedure followed in each test consisted of:
- cyclist held in position without pedalling by an external person. In this phase, the cyclist takes the position for the test and the platform is zeroing. It lasts around 30 s;
- the cyclist starts his movement and reaches 30 km/h at 90 RPM. After the transient to reach the speed, the phase is kept for 30–40 s. No wind is activated in this phase;
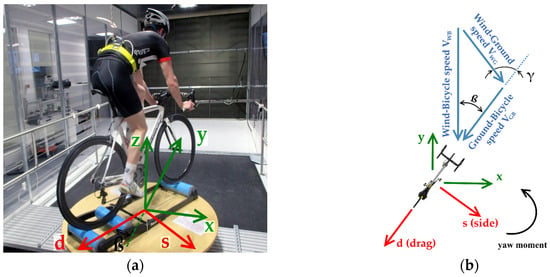
- wind is activated at the first wind speed. The cyclist continues his pedalling at 30 km/h at 90 RPM and keeps the position of the body. Wind is increased to different speeds according to the composed speed of the wind (triangle of speed, Figure 3b) with respect to the cyclist, due to different yaw angles of the tests. Each wind speed is kept for 60 s;
 Figure 3. Reference coordinate systems (a) in a back-side view during a test and (b) in a sketch from a top view with the speed vectors. x, y, z is the absolute coordinate system of the platform, whilst the drag and side axes (d, s) rotate around z-axis (with the variation of the yaw angle ß) and they are referred to the rider. The angle γ is the absolute angle of the wind referred to the direction of motion. The controlled parameters during the tests were: the wind speed of the tunnel VWB and the yaw angle ß.
 - from the highest speed, wind is decreased to 0 km/h and when the fan stops completely (it needs around 25 s), the cyclist continues his pedalling for 30 s. During the data analysis, this phase has been used to consider the drift effect of the force platform during each test, in theory < ±10 mN/s;
- end of the test and change of the yaw angle with 5° of increasing steps.
The yaw angle varied from 0° to 30°. Due to the unrestrained movement on the roller, only the following load components were collected: platform’s forces along x, y, z axes and yaw moment. Lifting force (along z-axis) was not collected, while components along x and y axes allowed to obtain drag and side forces at different yaw angles. The side force and the yaw moment give a measure of the comfort of the ride in those wind condition [5]. Moreover, temperature and humidity inside the testing area were collected to check for any difference in the air density. During the data analysis, the rough signal (sampled at 400 Hz) were filtered with a 2nd order Butterworth low pass filter 1 Hz and the effect of structure resistance and platform drift were subtracted from the results.
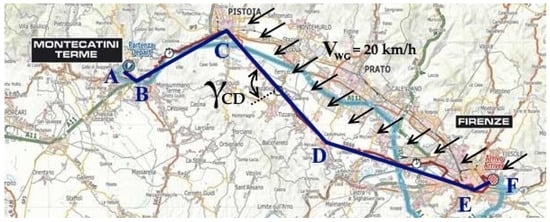
A further analysis was to consider a real track and to compare the wheelsets through the time needed to complete it with constant pace. Instead of the simple straight itinerary, a more complex way was considered as an example: the flat route of the 2013 UCI road world championship elite men’s TTT (team time trial) from Montecatini Terme to Florence. The route map (Figure 4) can be simplified into five straight segments (AB, BC, CD, DE, EF) with 57 km of total length. After supposing a wind speed VWG of 20 km/h directed as in the figure, parallel to BC and EF, the cyclist was assumed to ride alone, with the tested bicycle and wheelsets, at a steady pace of 30 km/h.

Figure 4.
Route map of the time race simulation: the blue path simplifies the red-coloured real path.
The following assumptions permit to calculate the time needed to complete the race and to choose the best wheelset to use in this race simulation:
- P = 350 W; η = 0.975; CRR = 0.004; m = 85 kg, (the average power output, the mechanical efficiency of the transmission, the coefficient of rolling resistance and the mass of the system, respectively);
- length of the parts: AB = 2 km; BC = 14 km; CD = 20 km; DE = 19 km; EF = 2 km;
- γAB = 70°; γBC = γEF = 0°; γCD = 80°; γDE = 50° which leads to: ßAB = 27°; ßBC = ßEF = 0°; ßCD = 30.5°; ßDE = 19.7°.
The expression to calculate the time in AB segment, for example, is:
To calculate the expression of the drag aerodynamic force, FD, at different angles from the tested ones, interpolation of curves resulting from the wind tunnel tests were used.
3. Results
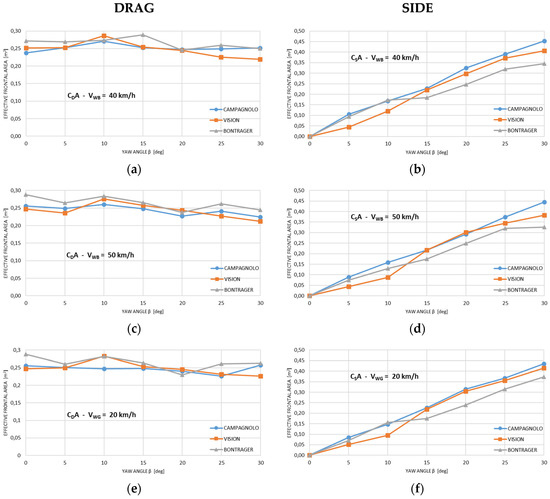
Results of wheels’ tests are summarized in Figure 5 in terms of effective frontal areas of drag (CDA) and side (CSA). CDA (product between frontal area and aerodynamic coefficient) is the most important parameter to characterise aerodynamic drag [8]. Table 1 summarizes the results of the race simulation.

Figure 5.
(a,c) Drag and (b,d) side effective frontal areas of the three wheelsets varying the yaw angle ß (by 5° increments) with a constant wind speed referred to the bicycle VWB of 40 km/h and 50 km/h; (e) drag and (f) side effective frontal areas of the three wheelsets varying the yaw angle ß (5° increments) with a constant wind speed referred to the ground VWG of 20 km/h.

Table 1.
Time results of the race simulation. The yellow background indicates the fastest wheels in each segment.
4. Discussions and Conclusions
This work has been a first study on cycling aerodynamics in the MIUN facility. For this reason, there are several limitations in this study. Firstly, the high impact of the supporting structure on the airflow, mainly due to the force platform and the rollers that are not integrated in the floor. In addition, the low number of tests with data collection and the absence of an appropriate system to control and keep repeatable the rider’s body position [4], in this work demanded to the cyclist himself. Possible improvements consider four main areas:
- avoid the flow diversion by embedding the structure in the floor or using a splitter plate;
- use a motion capture system in order to control the body position during the tests;
- enhance the number of experiments and make a numerical CFD simulation in order to have a better understanding of the flow around the cyclist;
- study the rain-fog effect to take advantage of the system in the tunnel.
Temperature and humidity do not influence the results because the air density changed less than 2% between the two most different tests. On the drag effective frontal area, the effect of the yaw angle’s increase is to increase it, up to 10–15° and then gradually decrease, contrary to the side effective frontal area that increases with the yaw angle’s increase [9,10]. Accordingly, in this work the maximal CDA values were obtained at 10–15° of yaw angle; and the ones of CSA increase with the yaw angle’s increase. Due to the high difference with the value at 25° and at the fact that it’s the highest point of the curve, the drag result at 30° of Campagnolo wheels is considered as an error. Considering the wind speed referred to the ground VWG of 20 km/h (Figure 5e), the Vision wheelset shows the smallest CDA and the Bontrager the highest both at small and high yaw angles. At a yaw angle of 0°, the Vision wheels have 4% and 14% less drag than the Campagnolo and Bontrager wheels, respectively. For medium yaw angles (10–15°) the Campagnolo wheelset shows the best behaviour: at 15°, it has 2% and 6% less drag than Vision and Bontrager wheelsets, respectively. At the highest yaw angle, the Vision wheelset has 14% and 12% less drag than Bontrager and Campagnolo wheels. Considering the comfort of the ride, i.e., side force (thus CSA) graphs and the not reported yaw moments graphs, the high rims of Vision and Campagnolo wheelsets give them higher discomfort at high yaw angles compared to the Bontrager wheelset, which has no aerodynamic design. This can have effect on the stability of the cyclist. The time trial simulation shows an advantage of the Vision wheelset (Table 1). The cyclist needs 3.7% and 9.0% less time racing with the Vision wheels than with the Campagnolo and Bontrager wheels, respectively, with the assumptions done. Despites the limitations of the study, the results agree well in terms of drag effective frontal areas with literature works with full-scale study of cyclist and bicycle, dynamic conditions, wind speeds and dropped body position. In fact, for the front wind condition (β = 0°), values of effective frontal area of 0.275 [11], 0.276 [12] and 0.243 [4] has been found in dynamic track tests for the first value, dynamic wind tunnel tests for the second and in static (both wheel and cyclist fixed) wind tunnel tests for the third value. From the present work values of 0.256; 0.247; 0.288 were obtained with Campagnolo, Vision and Bontrager wheels respectively. No literature full-scale study with similar equipment has been found investigating yaw angle’s effect on drag and side effective frontal area. From our tests, Vision and Campagnolo should always be preferred to Bontrager, but we cannot say which one is better: the choice depends on the wind conditions and track orientation relative to the wind in a race.
Acknowledgments
This work was supported by Campagnolo SRL—Italy.
Conflicts of Interest
The authors declare no conflict of interest.
References
- Kyle, C.R.; Burke, E. Improving the racing bicycle. Mech. Eng. 1984, 106, 34–45. [Google Scholar]
- Crouch, T.N.; Burton, D. Riding against the wind: A review of competition cycling aerodynamics. Sports Eng. 2017, 20, 81–110. [Google Scholar] [CrossRef]
- Burry, N.; Burton, D. Effect of crosswinds and wheel selection on the aerodynamic behavior of a cyclist. Procedia Eng. 2012, 34, 20–25. [Google Scholar] [CrossRef]
- Defraeye, T.; Blocken, B. Aerodynamic study of different cyclist positions: CFD analysis and full-scale wind-tunnel tests. J. Biomech. 2010, 43, 1262–1268. [Google Scholar] [CrossRef] [PubMed]
- Greenwell, D.I.; Wood, N.J. Aerodynamic characteristics of low drag bicycle wheels. Aeronaut. J. 1995, 99, 109–120. [Google Scholar]
- Sayers, A.T.; Stanley, P. Drag force on rotating racing cycle wheels. J. Wind Eng. Ind. Aerodyn. 1994, 53, 431–440. [Google Scholar] [CrossRef]
- Bäckström, M.; Carlsson, P. A new wind tunnel facility dedicated to sports technology research and development. Procedia Eng. 2016, 147, 62–67. [Google Scholar] [CrossRef]
- Debraux, P.; Grappe, F. Aerodynamic drag in cycling: Methods of assessment. Sports Biomech. 2011, 10, 197–218. [Google Scholar] [CrossRef] [PubMed]
- Fintelman, D.M.; Sterling, M. The effect of crosswinds on cyclists: An experimental study. Procedia Eng. 2014, 72, 720–725. [Google Scholar] [CrossRef]
- Lukes, R.A.; Chin, S.B. The understanding and development of cycling aerodynamics. Sports Eng. 2005, 8, 59–74. [Google Scholar] [CrossRef]
- Gibertini, G.; Campanardi, G. Aerodynamics of biker position. In Proceedings of the BBAA VI International Colloquium on: Bluff Bodies Aerodynamics and Applications, Milano, Italy, 20–24 July 2008. [Google Scholar]
- Grappe, G.; Candau, R. Aerodynamic drag in the field cycling with special reference to the Obree’s position. Ergonomics 1997, 40, 1299–1311. [Google Scholar] [CrossRef]
Publisher’s Note: MDPI stays neutral with regard to jurisdictional claims in published maps and institutional affiliations. |
© 2018 by the authors. Licensee MDPI, Basel, Switzerland. This article is an open access article distributed under the terms and conditions of the Creative Commons Attribution (CC BY) license (https://creativecommons.org/licenses/by/4.0/).