Abstract
The transition from a stationary crouch on running-blocks to an erect running position is critical to success in sprint running. Three elite sprinters repeated five sprint starts on a 50 m-long instrumented running track each wearing three inertial measurement units (IMU) on both shanks. The IMU profiles and force plate data was highly consistent between runs. The increasing maximum ground force was correlated with the IMU data using a linear fit and gyroscope triggered acceleration component. Both techniques show promise (r2 > 0.5). This is of significant interest to athletes and coaches using IMUs rather than a long, instrumented running track.
1. Introduction
The top 102 men from the 2016 100 m sprint times were separated by 0.35 seconds [1]. Small margins have extremely large performance indications. Sprinting can be sub-categorized into three phases with the first two phases accounting for 64% of the result, equating to approximately 40 m [2].
- Start Phase—athlete set in blocks until instance where both feet have left the blocks.
- Drive/Pickup phase—end of start phase until the trunk is fully erect.
- Maintenance phase—until the sprint is completed.
Sprint acceleration is dependent on a sprinter’s ground reaction force (GRF) profile [3]. The transition from a stationary crouch on running-blocks to an erect running position is critical to success in sprint running. The ground reaction forces necessarily change during this transition. Imperfections in an athlete’s sprinting technique may be detected and then corrected. The ground reaction forces (GRF) can be used to evaluate the sprinting pattern and can be used as a reference to improve running technique [4].
GRF are most accurately measured by force plates. In sprinting research Liu et al. [5] demonstrated that GRF’s can be used to obtain the horizontal velocity of an athlete centre of mass (CoM). Using the impulse of the horizontal GRF during contact phase (the phase from which the foot first contacts the ground to leaving the ground) different sprinting techniques were assessed. Liu et al. [5] used a Kistler force platform (600 Hz sampling rate) and a LOCAM Hi-speed camera (150 Hz) to record the GRF of one contact phase synchronously with video recording. Mathematical optimisation techniques were used to predict performance improvement through changing GRF patterns. Based on the assumption that maximal speed phase included 20 strides, they concluded that 0.06–0.08 s could be taken off a sprinter’s time [5]. Rabita et al. [6] focused their investigation on the biomechanics involved in the sprint acceleration phase. Nine sprinters (ages 23.9 + 3.5 years) ranging in expertise, completed several short sprints (10 m, 15 m, 20 m, 30 m and 40 m) using force plates (piezoelectric sensor 1.2 × 0.6 m) to obtain the GRFs. Six force plates were connected in series to create a system that was 6.6 m long and sampled at 1000 Hz. GRFs were a major contributor to differences in performance. Ortega et al. [7] conducted an analysis of vertical GRF data and the body mass to obtain acceleration-time plots. This was integrated to obtain the vertical velocity and displacement in the landing phase of a countermovement jump.
High quality force reaction plates are expensive, time consuming to implement, and cannot be added readily in the athletes training facilities. Other technologies have the capacity to estimate GRF which are flexible, inexpensive, and easy to implement. Inertial measurement units (IMUs) are one possible technology. Within sprinting research IMUs have been determined to be both accurate and reliable to determine the stance duration [8]. A single lower back mounted IMU was validated against retro-reflective motion capture (Vicon, Yarnton, Oxford, UK) and shown to reliably find angular displacement and velocity during sprinting [6]. Further to this, Philpott et al. [2] used block mounted force plates and Vicon for sprinting starts finding the timing accurate to 0.025 ± 0.024 s, a number which may have been reduced if a higher sampling frequency (50 Hz) was used.
Previous research focused on the sprint acceleration start phase and the first portion of the drive phase [2,6,8]. Whilst force plates and IMUs have been used as tools for sprint diagnosis, a correlation between the data obtained by the measurement devices has yet to be found. A link between IMUs and force reaction plates would reduce the reliance on force reaction plates to determine GRF. To achieve this link the instrumented track should be sufficiently long and not impose non-race like constraints, for example not being able to use running spikes. The shank IMU acceleration should be a close match to the ground reaction force profile as the only attenuation of impact will be through the running shoe, the sole of the foot and the ankle joint.
2. Materials and Methods
2.1. Materials
Two identical 9DOF IMU (SABELSense, Griffith University, Nathan, Australia [9]) sensors (250 Hz, ±16 g accelerometer, ±2000°/s gyroscope, ±7 Gauss magnetometer weight = 23 g) were attached to each participant using Velcro bands. The IMU sensor was calibrated [10] before the trial and logged data locally to a micro SD card. The sensor includes a red LED which was pulsed by the user allowing for the sensor timing data to be matched to video [11].
The force plate instrumented running track, located at the Sports Performance Laboratory (National Institute of Fitness and Sports) in Kanoya, Japan was used for the trial. The 90 m long track has fifty-four independent force platforms (1000 Hz) connected to a single computer (TF-90100, TF-3055, TF-32120, Tec Gihan, Uji, Japan) embedded. Each set of starting blocks was bolted to a separate force platform—one for each hand and each foot. All measurements were recorded by a video camera (250 Hz) for subsequent processing. All instruction was triggered synchronously for feature identification.
2.2. Methods
Three elite sprinters (Age: 19 ± 0.5 y; Height: 171.6 ± 1.6 cm; Weight: 62.6 ± 5.0 kg; P.B 11.21 ± 0.1) consented to participate in the study (ethics approval number: GU 2017/587). Following a warm-up protocol assigned by the coach, participants were fitted using a custom velcro band with the IMU unit positioned above the medial malleous, referred to as the ‘shank’ position herein. The sensor was started and synchorised to the 250 Hz video camera with an LED flash. Participants were asked to complete five 50 m sprints from a block start on the instrumented running track. They were instructed to start the sprint with a light timing system, turning red 100 ms before the start and then green indicating go with a simultanous pistol sound. The red light also indicated the start of forceplate data recording.
3. Results
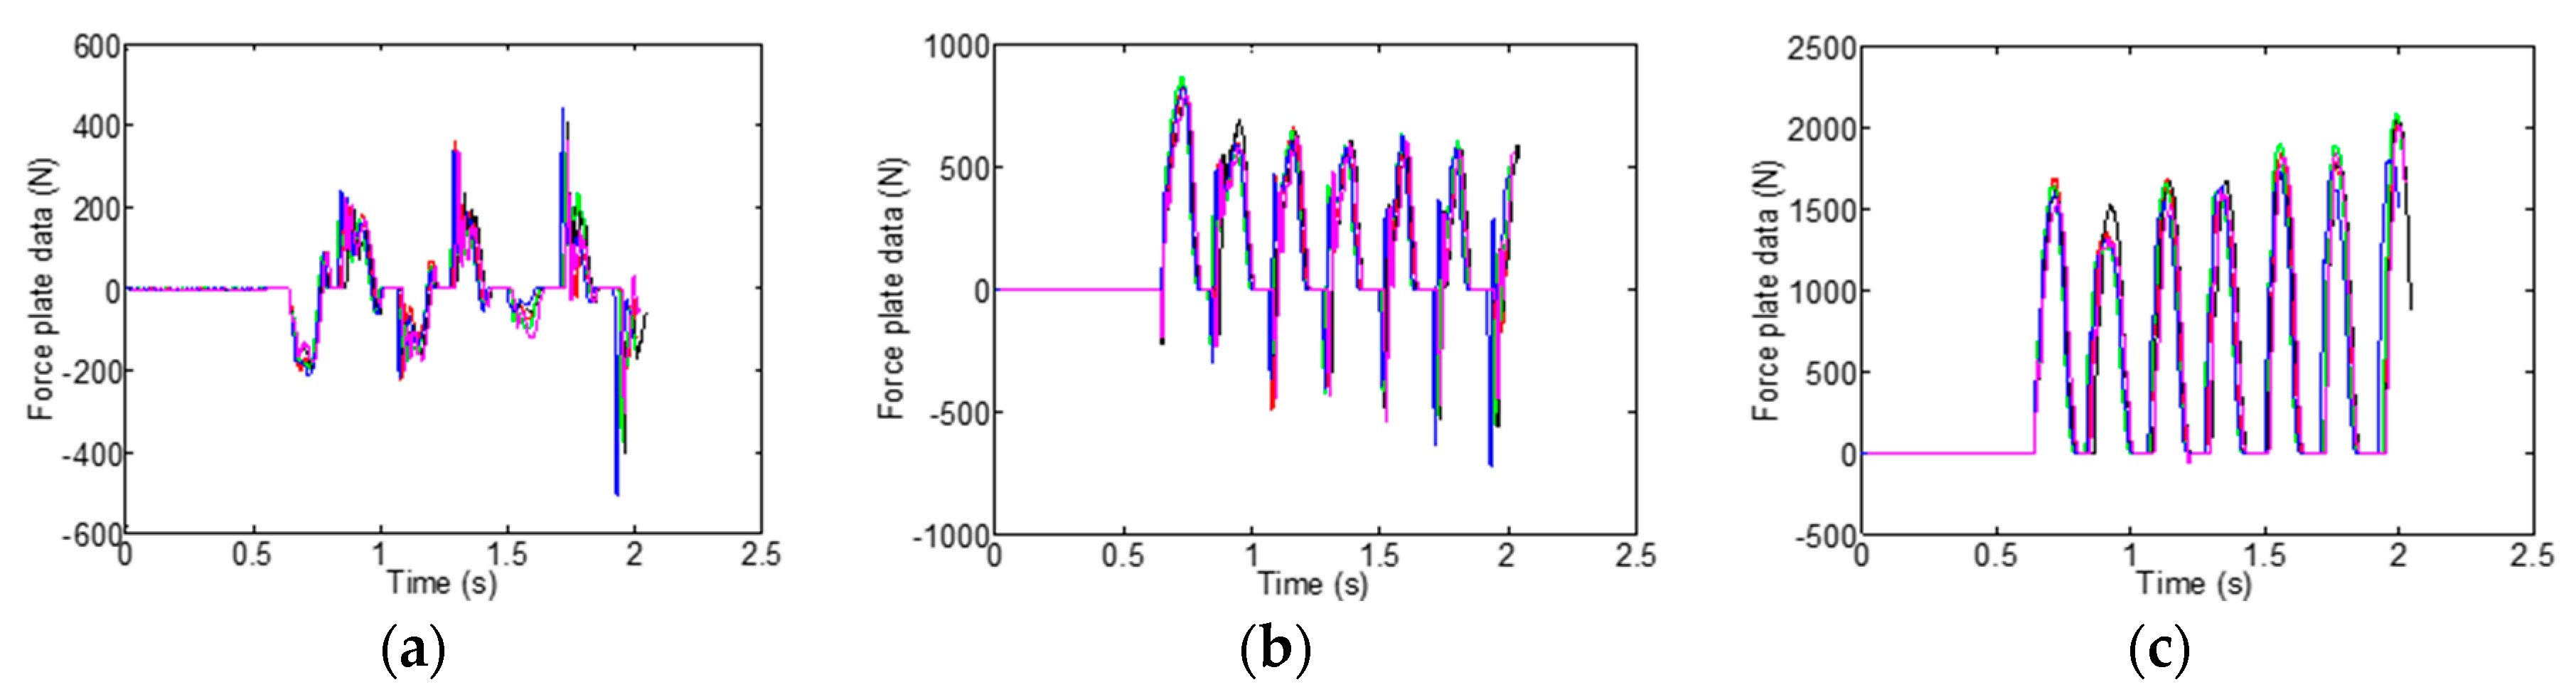
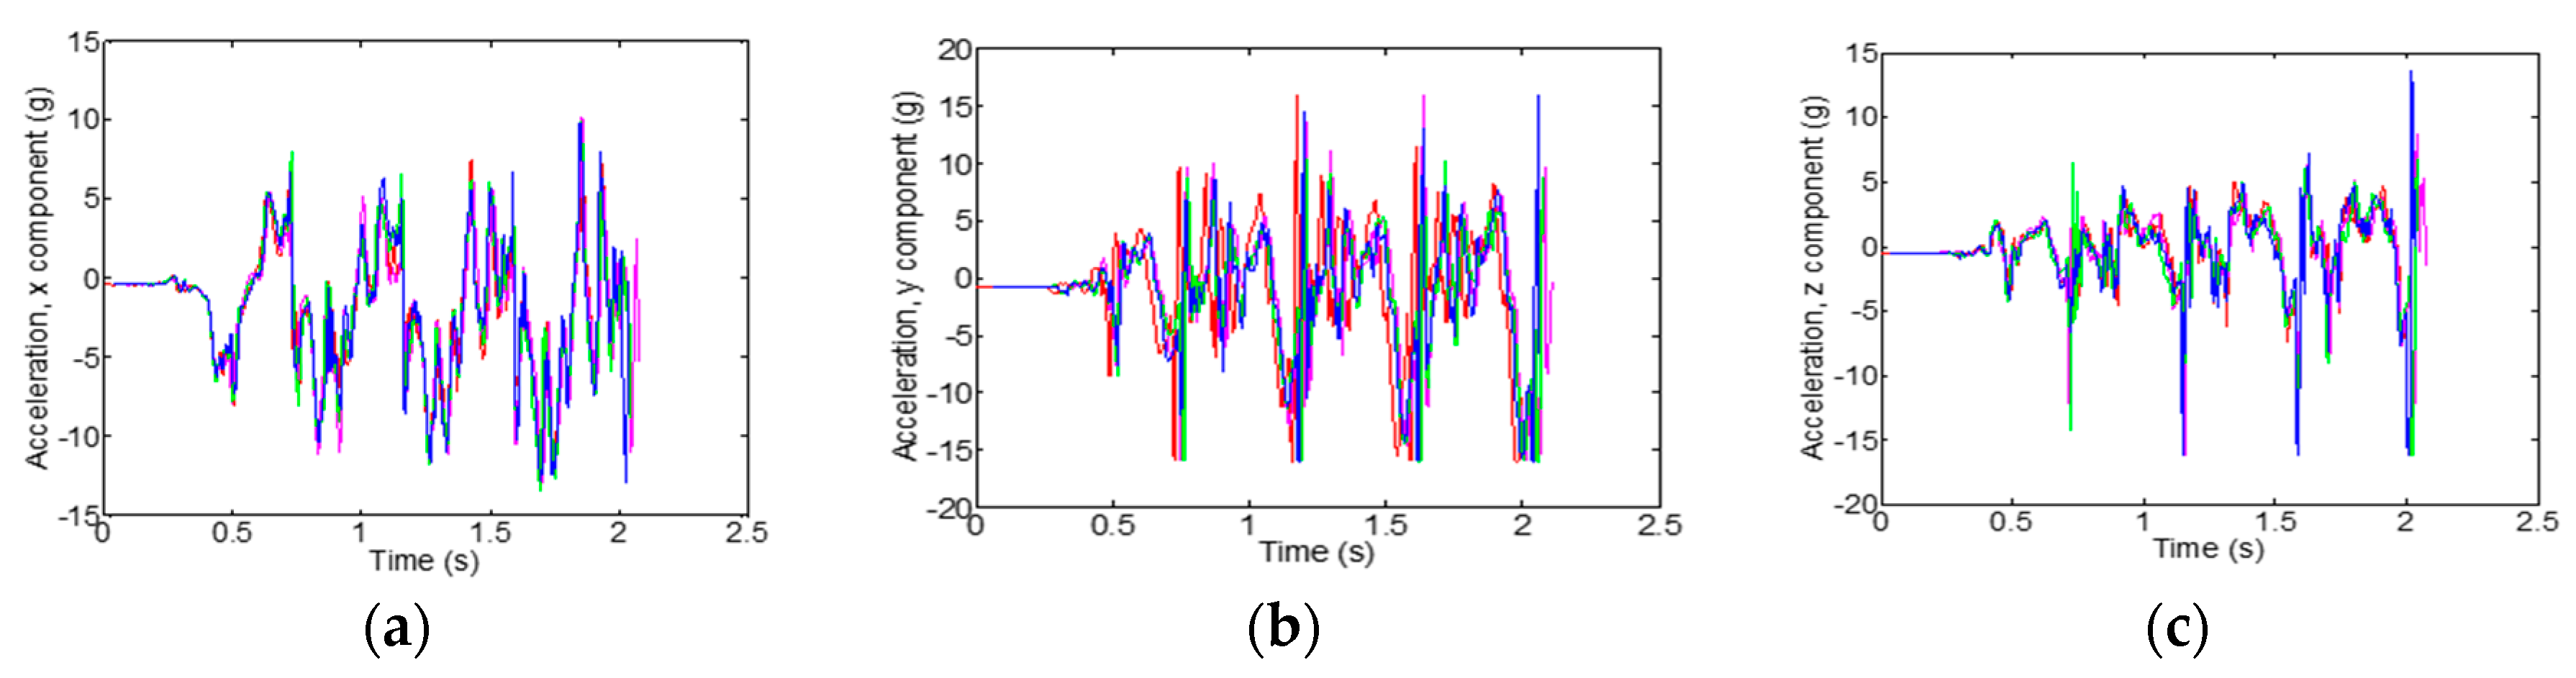
The force plate data and the acceleration data were consistent between all trials for all axes without time stretching (see Figure 1, Figure 2, Figure 3 and Figure 4). The GRF are for both left and right foot contacts symmetrically, however the medio-lateral x axis shows right foot negative and left foot as positive. The GRF profiles in the medio-lateral and vertical axes increase from the start whereas the anterior-posterior profile shows an increase in initial contact (negative axis) but a decrease in the foot-off propulsion. The right shank acceleration data for the same set of trials is shown in Figure 2. The right panel shows the shank-aligned acceleration. As expected the right foot profiles show a significant difference between the left and right feet. The left foot strike is still evident but is reflected through the lower body rather than directly as is the case with the right foot profile.
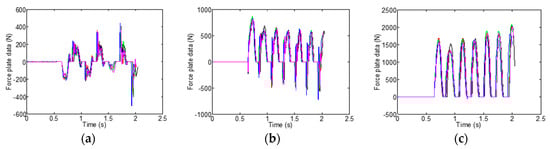
Figure 1.
Ground reaction force profiles for the first seven foot strikes for all five trials from participant two. (a) x component, medio-lateral axis (b) y component, anterior-posterior axis (c) z component, vertical axis.
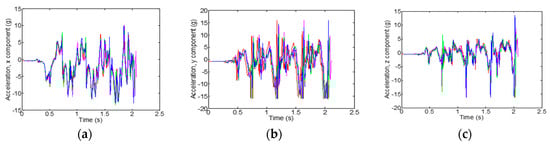
Figure 2.
Right shank acceleration for the first seven foot strikes for all five trials from participant two. (a) x component, shank aligned (b) y component, anterior-posterior axis (c) z component, medio-lateral axis. Note that the acceleration profiles are limited to the +16 g range.
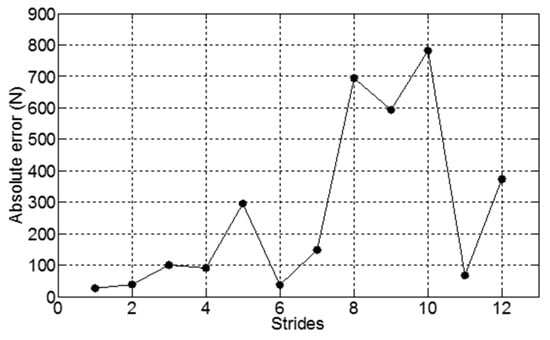
Figure 3.
Absolute error of prediction for a model generated using data from the first 4 strides of the run for participant two, right shank sensor where c1 = −108, c2 = 144 and c3 =80.6.
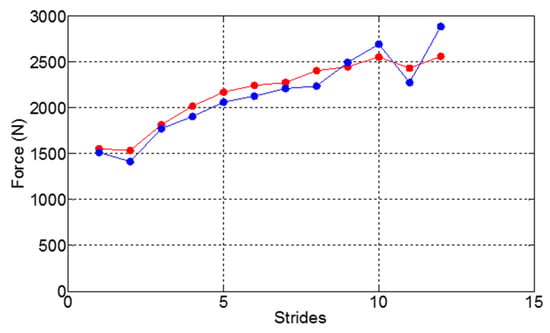
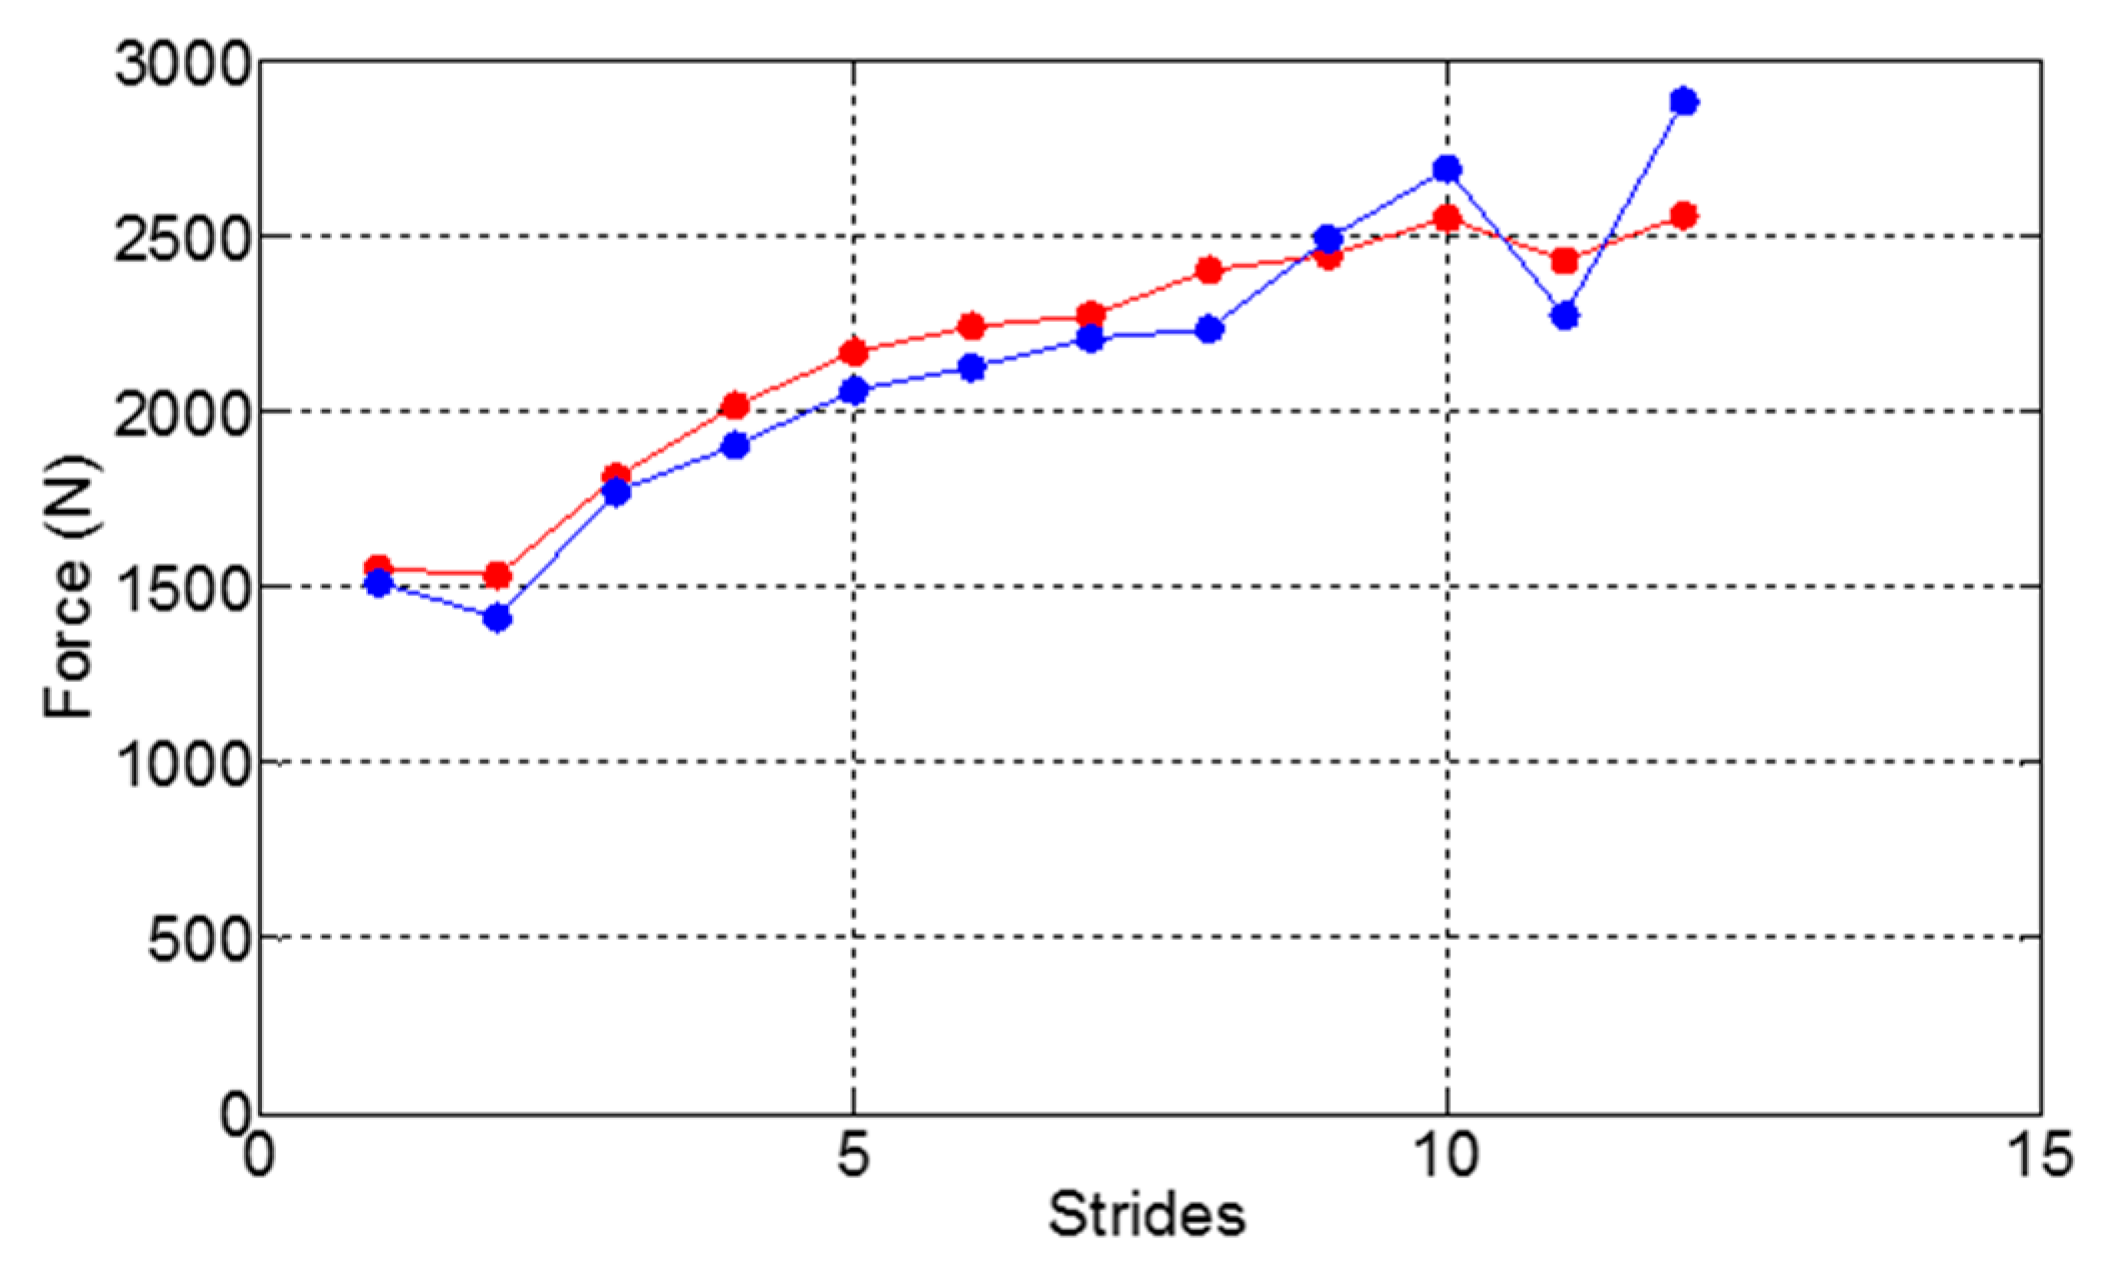
Figure 4.
Measured (red) vertical GRF from force plates and predicted (blue) vertical GRF from IMU using accelerometer only. Sample data shown from participant two, right shank sensor.
The steady state relationship between the maximum vertical GRF, Fv and the IMU acceleration components ax, ay and az, was assessed using a linear equation with constant coefficients.
The least squares coefficients c1, c2 and c3 were calculated for sets of strides throughout the 50m run to capture the changing forces and accelerations. The sets of coefficients were calculated for ground contacts with one foot: the first set was contacts 1–4, then 2–5, 3–6, 4–7 etc. Given the change in acceleration and GRFs in the first strides, the coefficients were made time dependent so we write
where n is the stride number. Figure 3 shows the variation in absolute error through the run using constant coefficients generated from the data from the first four strides. The absolute error at the start is lower than for the strides once the acceleration phase was over. The time-varying coefficients (Equation (2)) were plotted against the mean number of strides used to generate the coefficients to see how the coefficients varied through the run. A least squares straight line was fitted to the points to produce an equation for coefficients as a function of stride number.
Using Equation (2), the model predicted the forces over the 50 m accurately, with r2 = 0.93. The coefficient equations were
The results of the model for participant 2 (Figure 4) are strongly linear however models for the other participants were less successful. Note that this linear fit is suitable in the first stages of the sprint until the maintenance phase, where a constant GRF is expected.
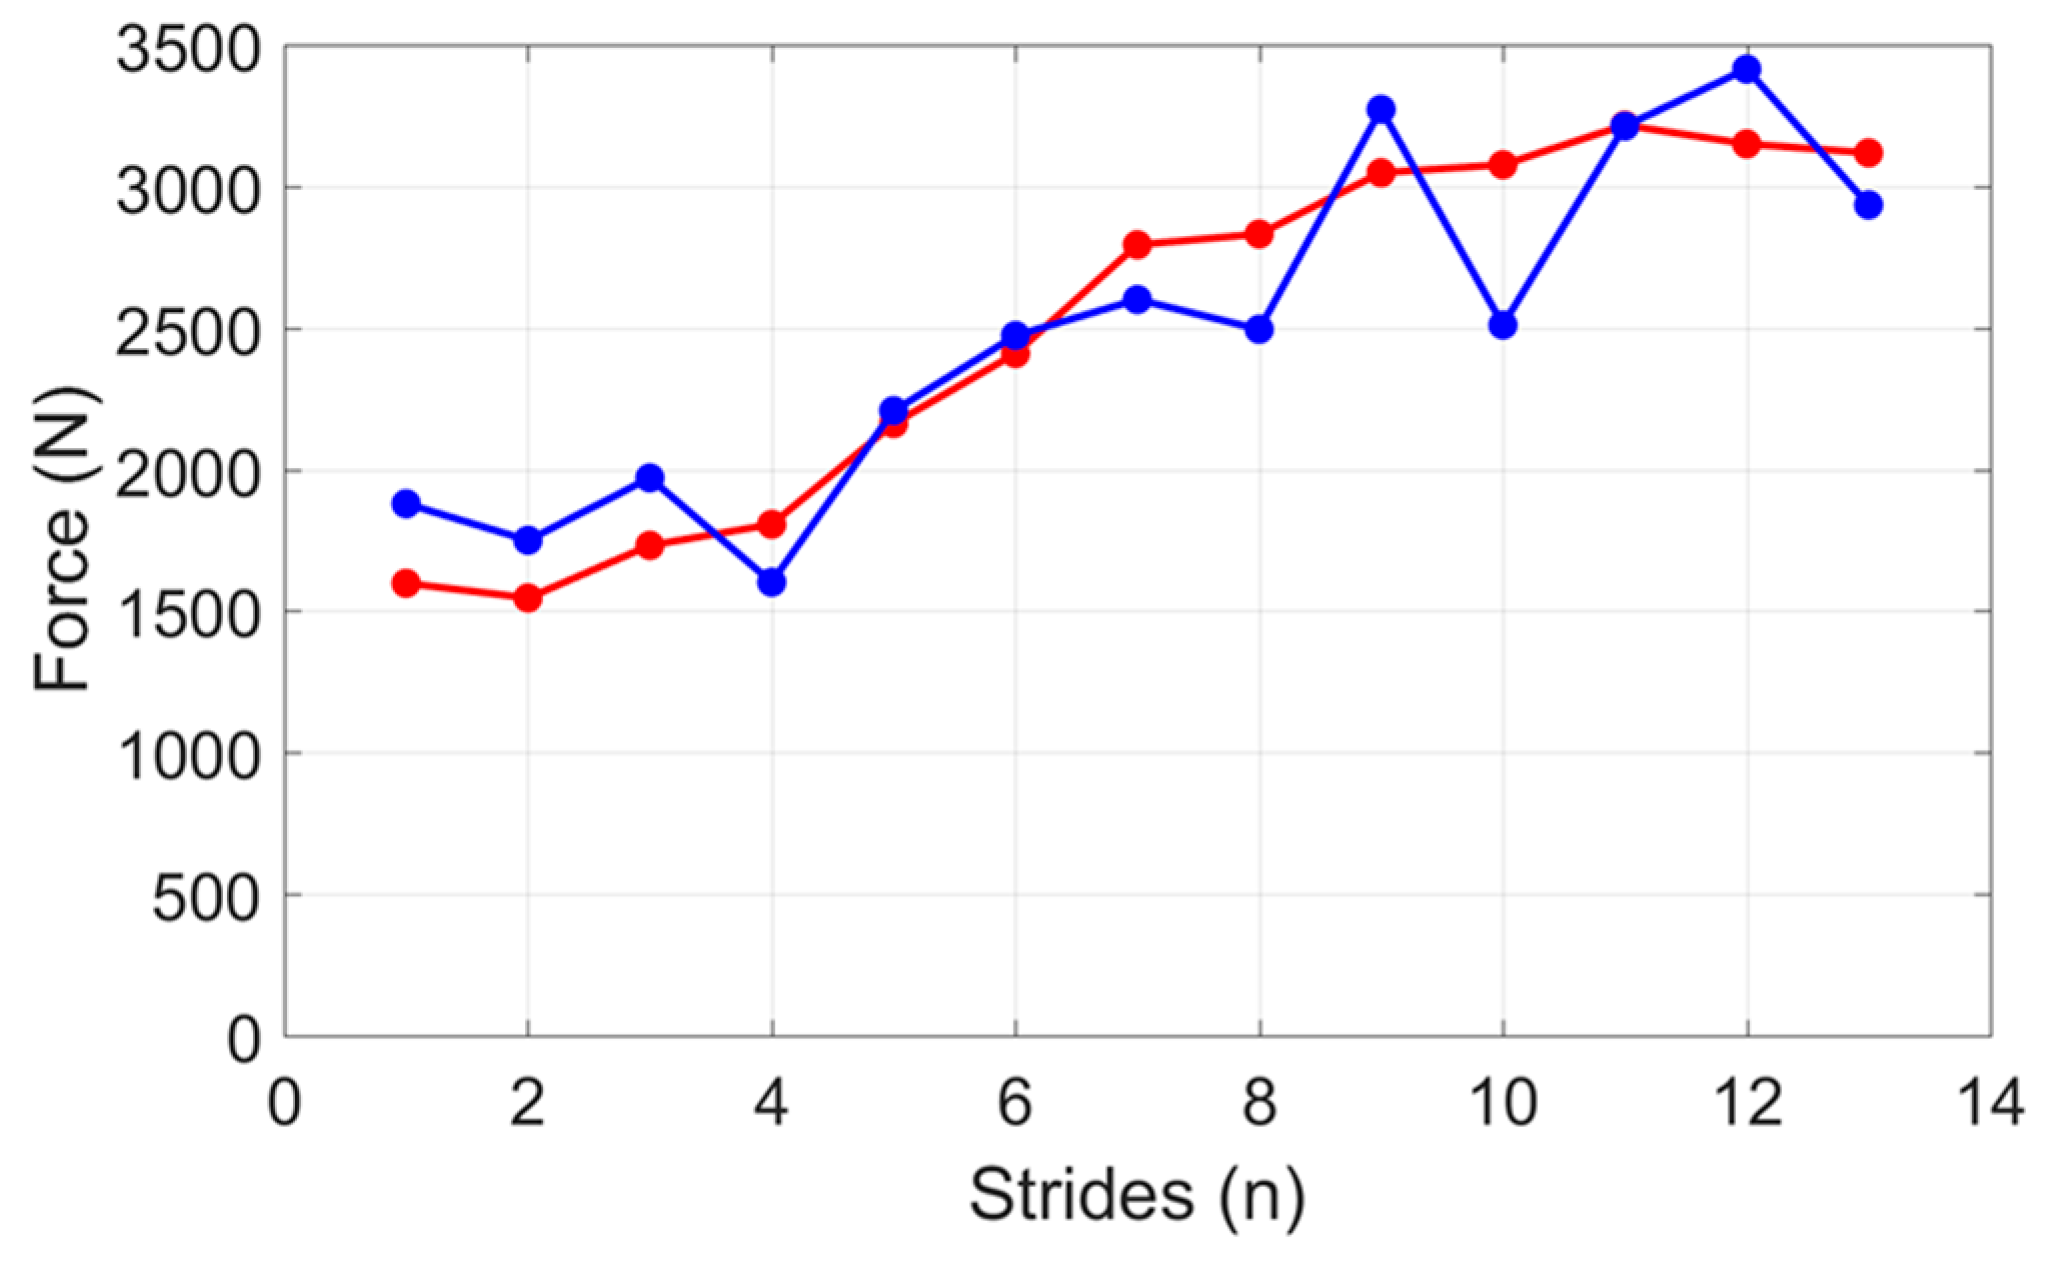
The shank angular velocity profile was filtered using a 5th order Butterworth low pass filter. This allowed the identification of the stance and swing phases in addition to the toe off and toe on times. This timing was used to automatically identify the times of maximum vertical acceleration and maximum vertical ground reaction force. Figure 5 is a scatter plot of the vertical GRF versus the RMS acceleration A determined using the equation

Figure 5.
Measured (red) vertical GRF from force plates and predicted (blue) vertical GRF from IMU using gyroscope and accelerometer. Sample data shown from participant two, right shank sensor.
The data for each run was fitted to straight lines with three of the four lines having a Pearson correlation coefficient r2 > 0.73.
4. Discussion
The raw data from the force plate and the IMUs show a high degree of repeatability in time and GDR profiles. This is only likely if the participants are well trained as was the case with the small sample of elite athletes tested. The data in Figure 1 shows the vertical GRF peaks increased in magnitude with stride number whilst the anterior-posterior peaks decrease in magnitude, indicative of the sprinter going from a crouched to erect position. The consistency and reproducibility of the GRFs from 1500 to 2000 N from all participants indicates a large signal to noise ratio and the potential for a prediction algorithm of the vertical GRF from the shank mounted IMU.
The difference noted between models at the start and during the maintenance phase of the sprint necessitate a linear force model (Equation (1)) with coefficients that vary with each stride. The method of predicting vertical GRF from a linear combination of acceleration components with stride varying coefficients from a right shank mounted IMU (Equation (2)) was reliable and accurate for one participant with a percentage error of 3.29% (r2 > 0.96). For the other participants, the method had varying degrees of success with an average percentage error of 33.32% (for all other participants and the two shanks). Filtered gyroscope data was used to locate the maximum vertical GRF and maximum net acceleration (Equation (4)). The relationship between these two parameters was linear (r2 > 0.73) for three of the four runs. Figure 4 and Figure 5 indicate a general underestimation between the force plates and the IMU prediction force. One potential source of this error could be the force attenuation at the ankle due to the musculoskeletal structure and the absorption of the running shoe. Subsequently an offset calibration for calculating for these individual differences could improve the accuracy of methods.
5. Conclusions
This study demonstrated that IMU data can be processed to provide a predictive equation for some elite runners to determine the GRF without a long force plated track. These participants ran from a crouched position on blocks to a natural erect running style so that the GRF changed in a predictable manner. The object of the study was to quantify the GDFs during normal running. With such information, a coach and athlete can determine if slight changes in running style, running shoes and track surfaces will lead to improved running times.
Acknowledgments
The authors would like to thank the National Institute of Fitness and Sport in Kanoya, Japan for their hospitality and access participants and technology. We would also like to thank the International Sports Engineering Association (ISEA) who generously provided the students from London and Netherlands with a travel support scholarship.
Conflicts of Interest
The authors declare no conflict of interest. The funding sponsors had no role in the design of the study; in the collection, analyses, or interpretation of data; in the writing of the manuscript, and in the decision to publish the results.
References
- International Association of Athletics Federations (IAAF). 100 Metres Men. In Senior Outdoor 2016 100 Metres Men; Monte IAAF: Carlo, Monaco, 2016; Available online: https://www.iaaf.org/records/toplists/sprints/100-metres/outdoor/men/senior/2016 (accessed on 5 November 2017).
- Philpott, L.K. Assessing wireless inertia measurement units for monitoring athletics sprint performance. In Proceedings of the 2014 IEEE Sensors, Valencia, Spain, 2–5 November 2014. [Google Scholar]
- Kawamori, N.; Nosaka, K.; Newton, R.U. Relationships between ground reaction impulse and sprint acceleration performance in team sport athletes. J. Strength Cond. Res. 2013, 27, 568–573. [Google Scholar] [CrossRef] [PubMed]
- Enoka, R. Neuromechanics of Human Movement, 5th ed.; Human Kinetics: Champaign, IL, USA, 2015. [Google Scholar]
- Liu, Y.; Chen, C.-K.; Chen, C.-Y. Optimization of ground reaction force during 100 m-sprint. In Proceedings of the ISBS, San Francisco, CA, USA, 30 March 2001; Volume 1, pp. 76–78. [Google Scholar]
- Rabita, G.; Dorel, S.; Slawinski, J.; Saez-de-Villarreal, E.; Couturier, A.; Samozino, P.; Morein, J. Sprint mechanics in world-class athletes: A new insight into the limits of human locomotion: Sprint mechanics in elite athletes. Scand. J. Med. Sci. Sports 2015, 25, 583–594. [Google Scholar] [CrossRef] [PubMed]
- Ortega, D.R.; Bíes, E.C.R.; de la Rosa, F.J.B. Analysis of the vertical ground reaction forces and temporal factors in the landing phase of a countermovement jump. J. Sports Sci. Med. 2010, 9, 282–287. [Google Scholar] [PubMed]
- Schmidt, M.; Rheinländer, C.; Nolte, K.F.; Wille, S.; Wehn, N.; Jaitner, T. IMU-based determination of stance duration during sprinting. Procedia Eng. 2016, 147, 747–752. [Google Scholar] [CrossRef]
- Espinosa, H.G.; Lee, J.; James, D.A. The inertial sensor: A base platform for wider adoption in sports science applications. J. Fit. Res. 2015, 4, 13–20. [Google Scholar]
- ALai, *!!! REPLACE !!!*; James, D.A.; Hayes, J.P.; Harvey, E.C. Semi-automatic calibration technique using six inertial frames of reference. In Proceedings of the SPIE Microelectronics: Design, Technology, and Packaging, Perth, Australia, 10–12 December 2003; Volume 5274, pp. 531–542. [Google Scholar]
- Leadbetter, R.; James, D. Platform technologies and visualisation tools for sensors in sport and health applications. Hum. Technol. 2016, 1, 9–10. [Google Scholar]

Publisher’s Note: MDPI stays neutral with regard to jurisdictional claims in published maps and institutional affiliations. |
© 2018 by the authors. Licensee MDPI, Basel, Switzerland. This article is an open access article distributed under the terms and conditions of the Creative Commons Attribution (CC BY) license (https://creativecommons.org/licenses/by/4.0/).