Feature Extraction from MEMS Accelerometer and Motion Tracking Measurements in Comparison with Smart Bands during Running †

Abstract
:1. Introduction
2. Methods
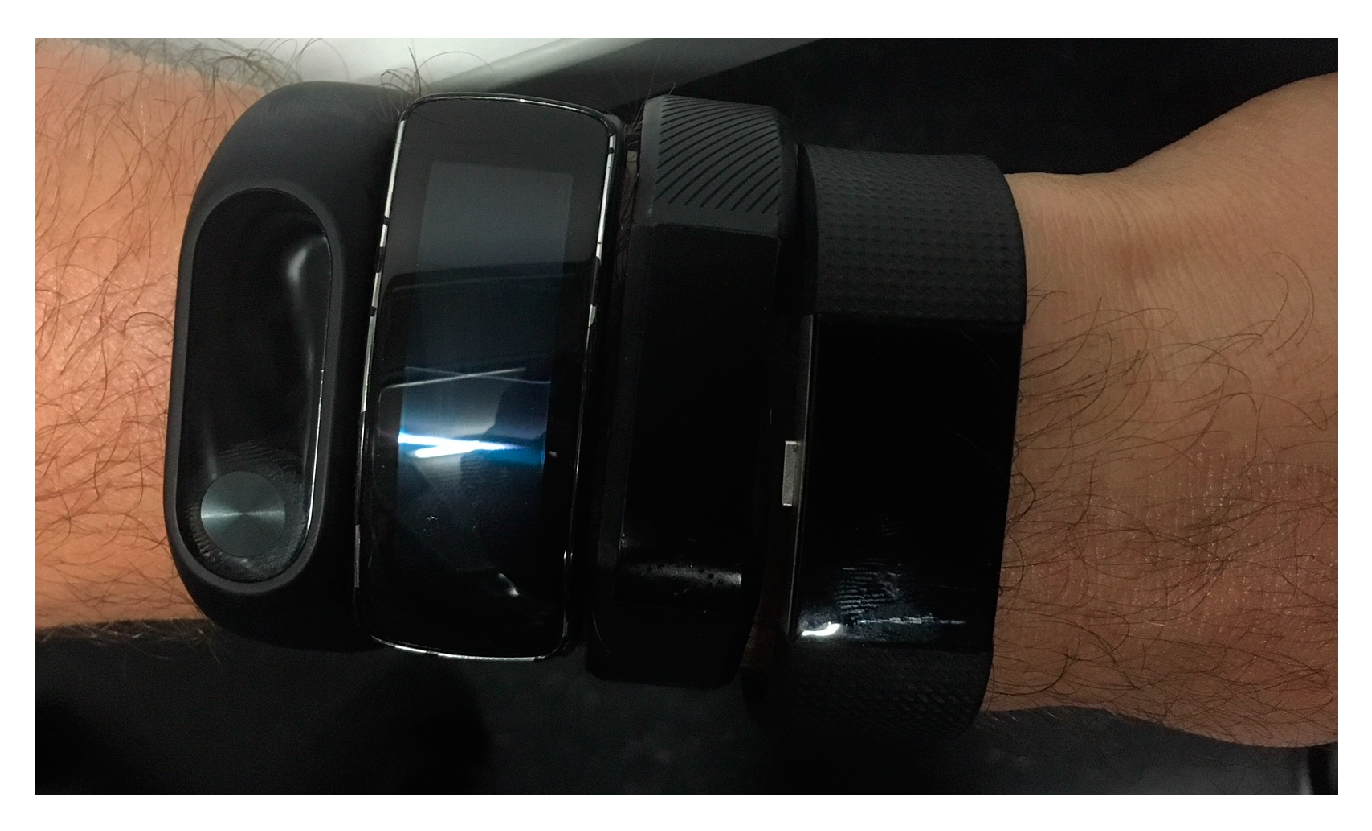
2.1. Instrumentation
2.2. Data Collection
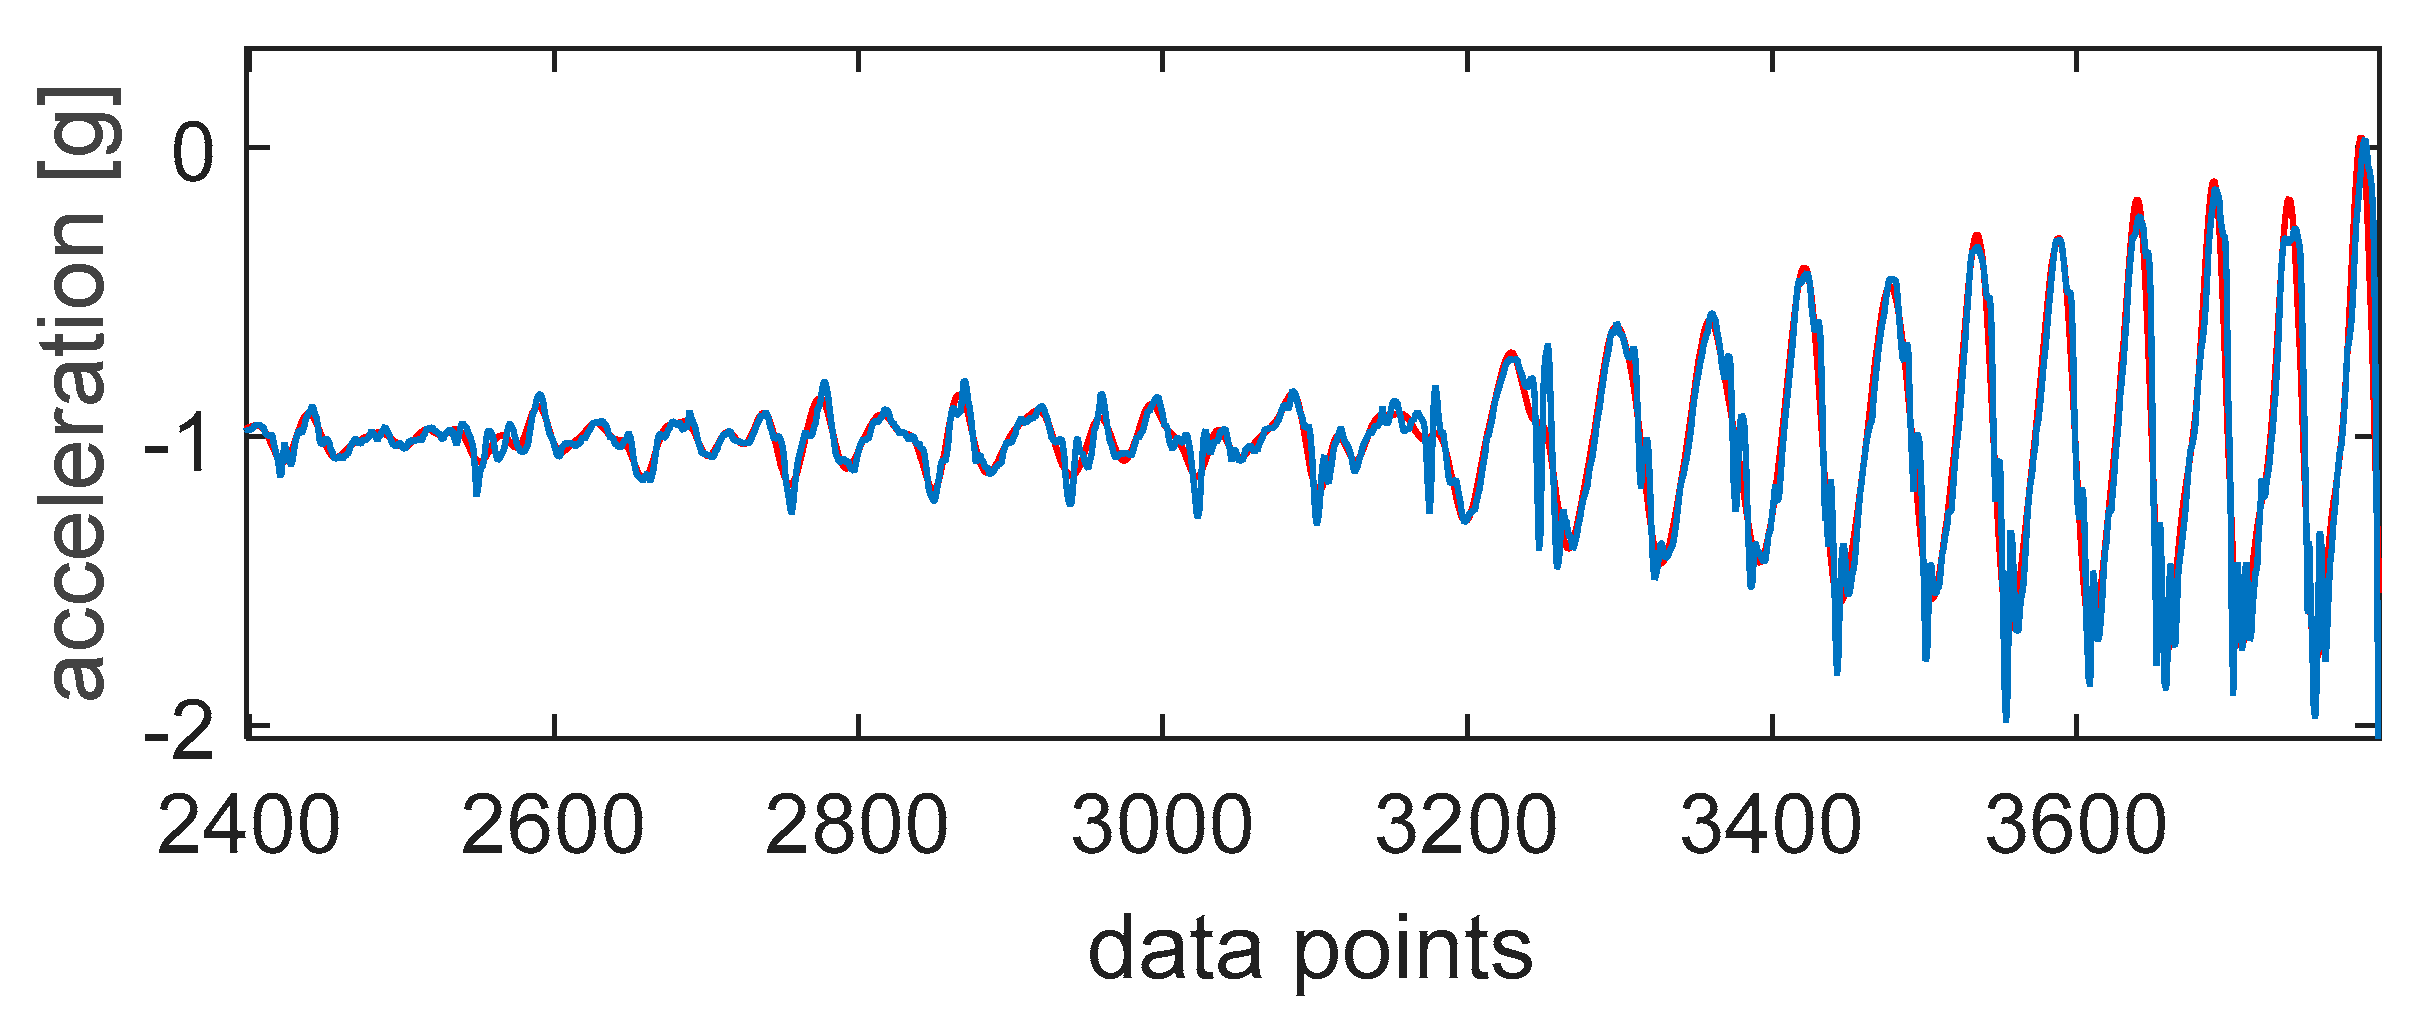
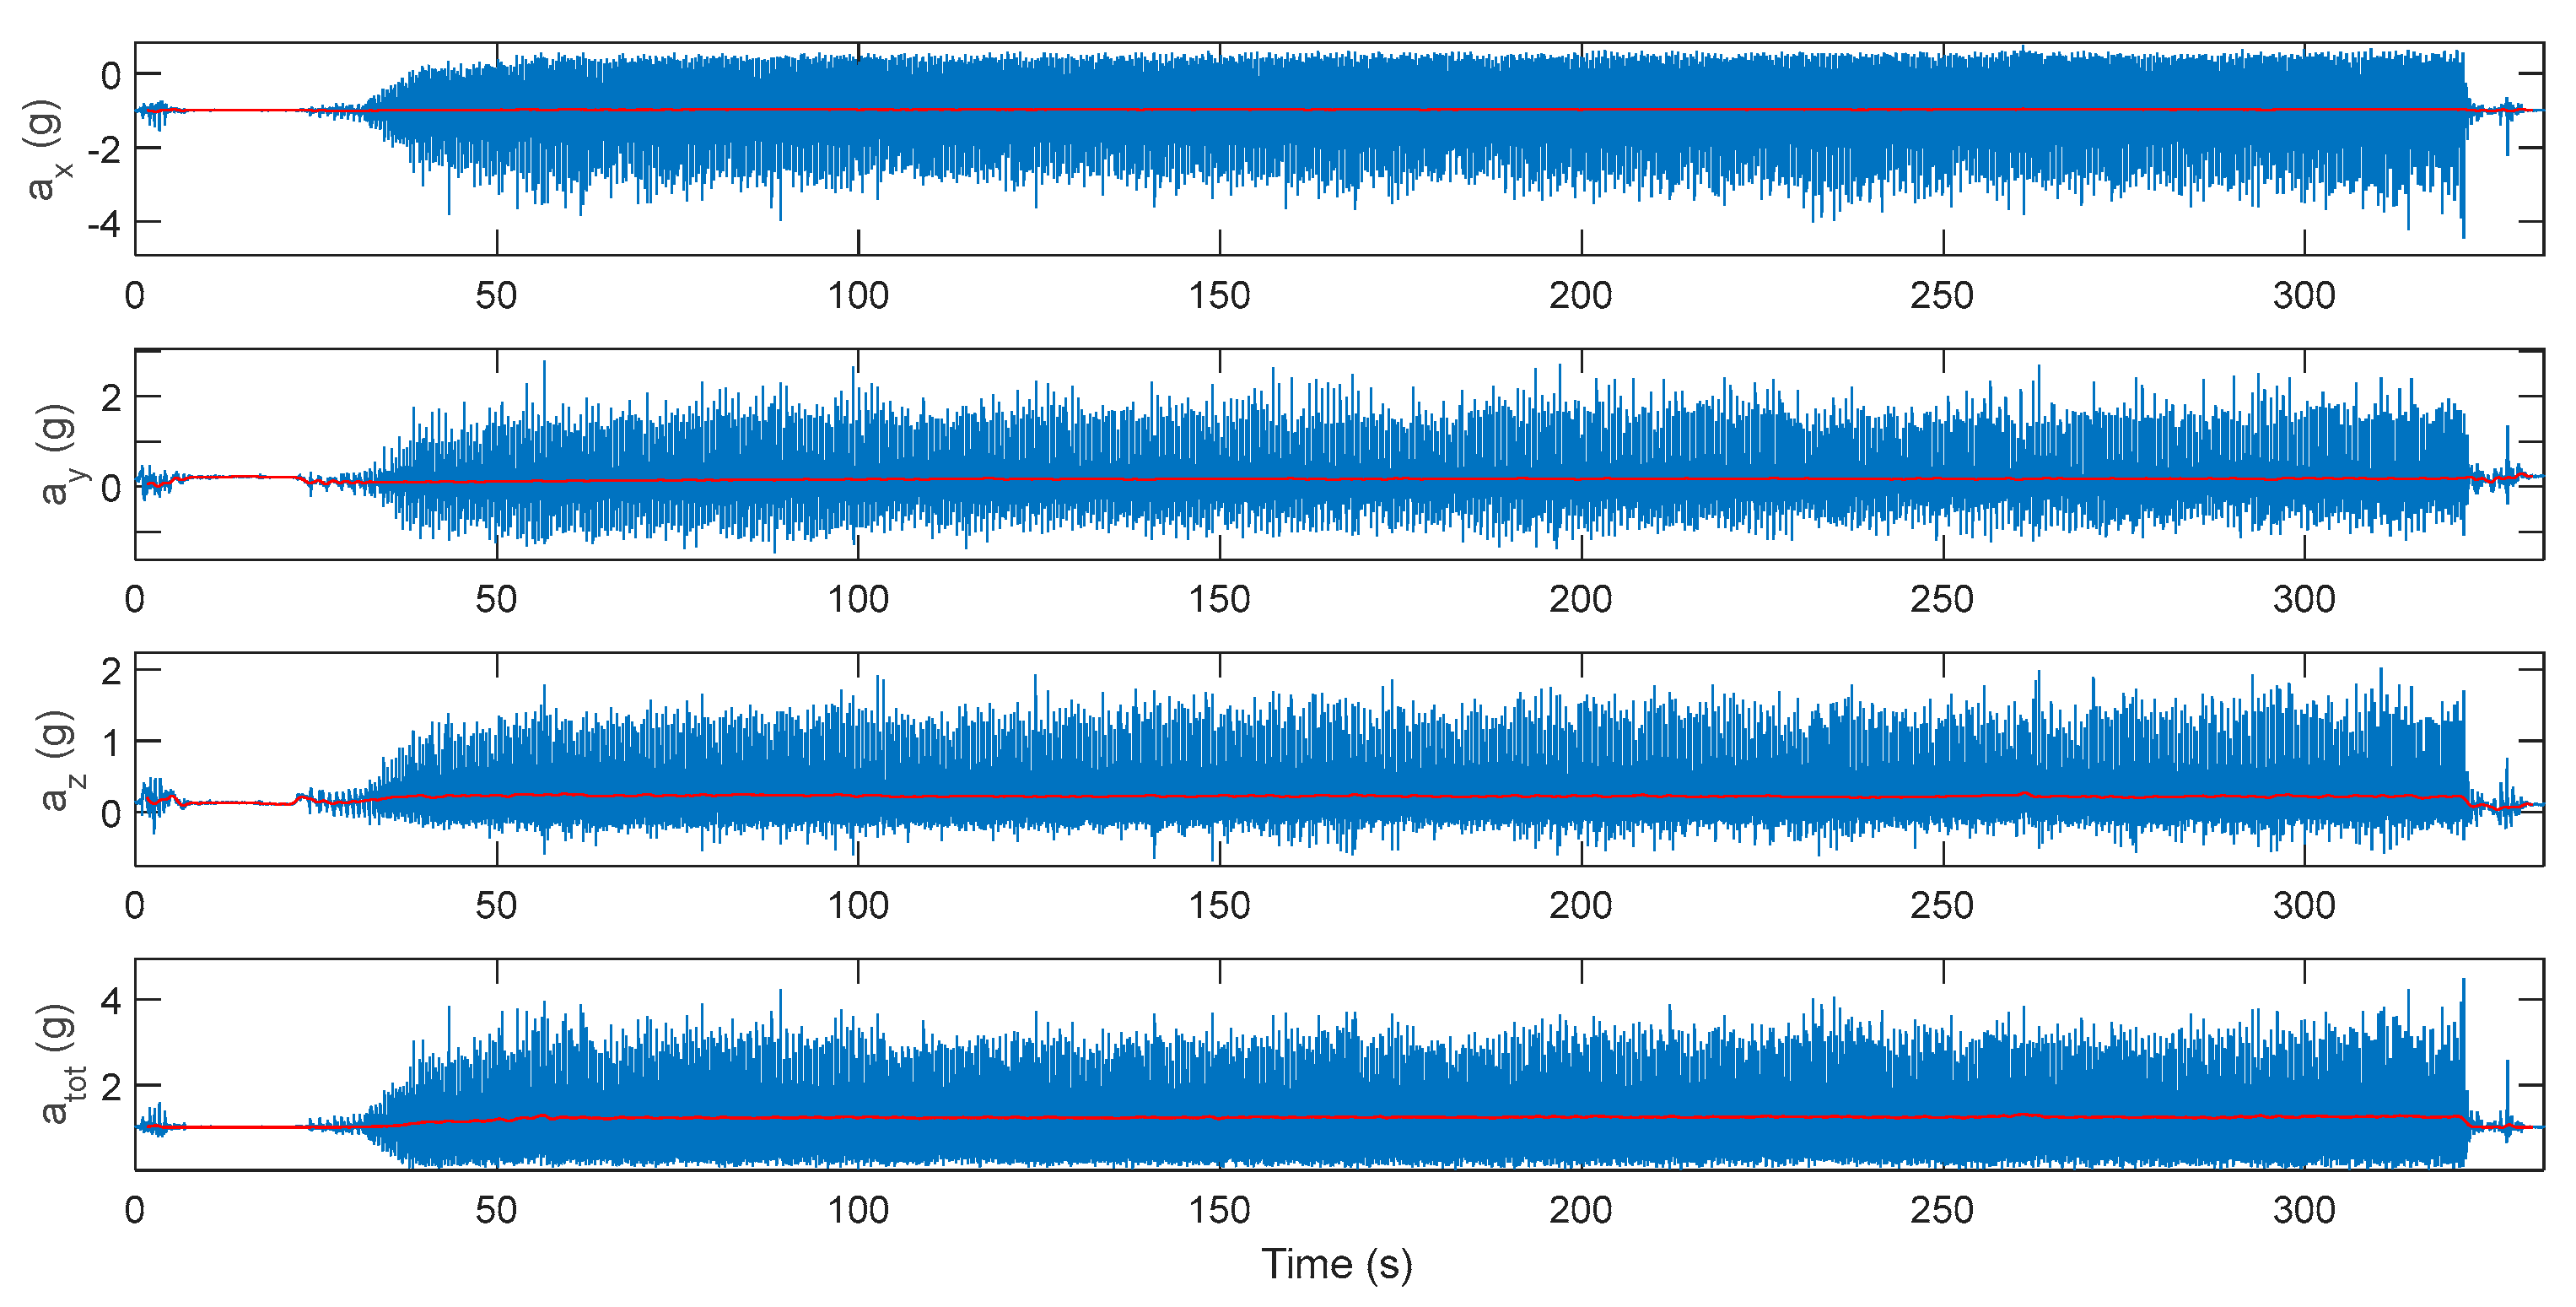
2.3. Data Analysis
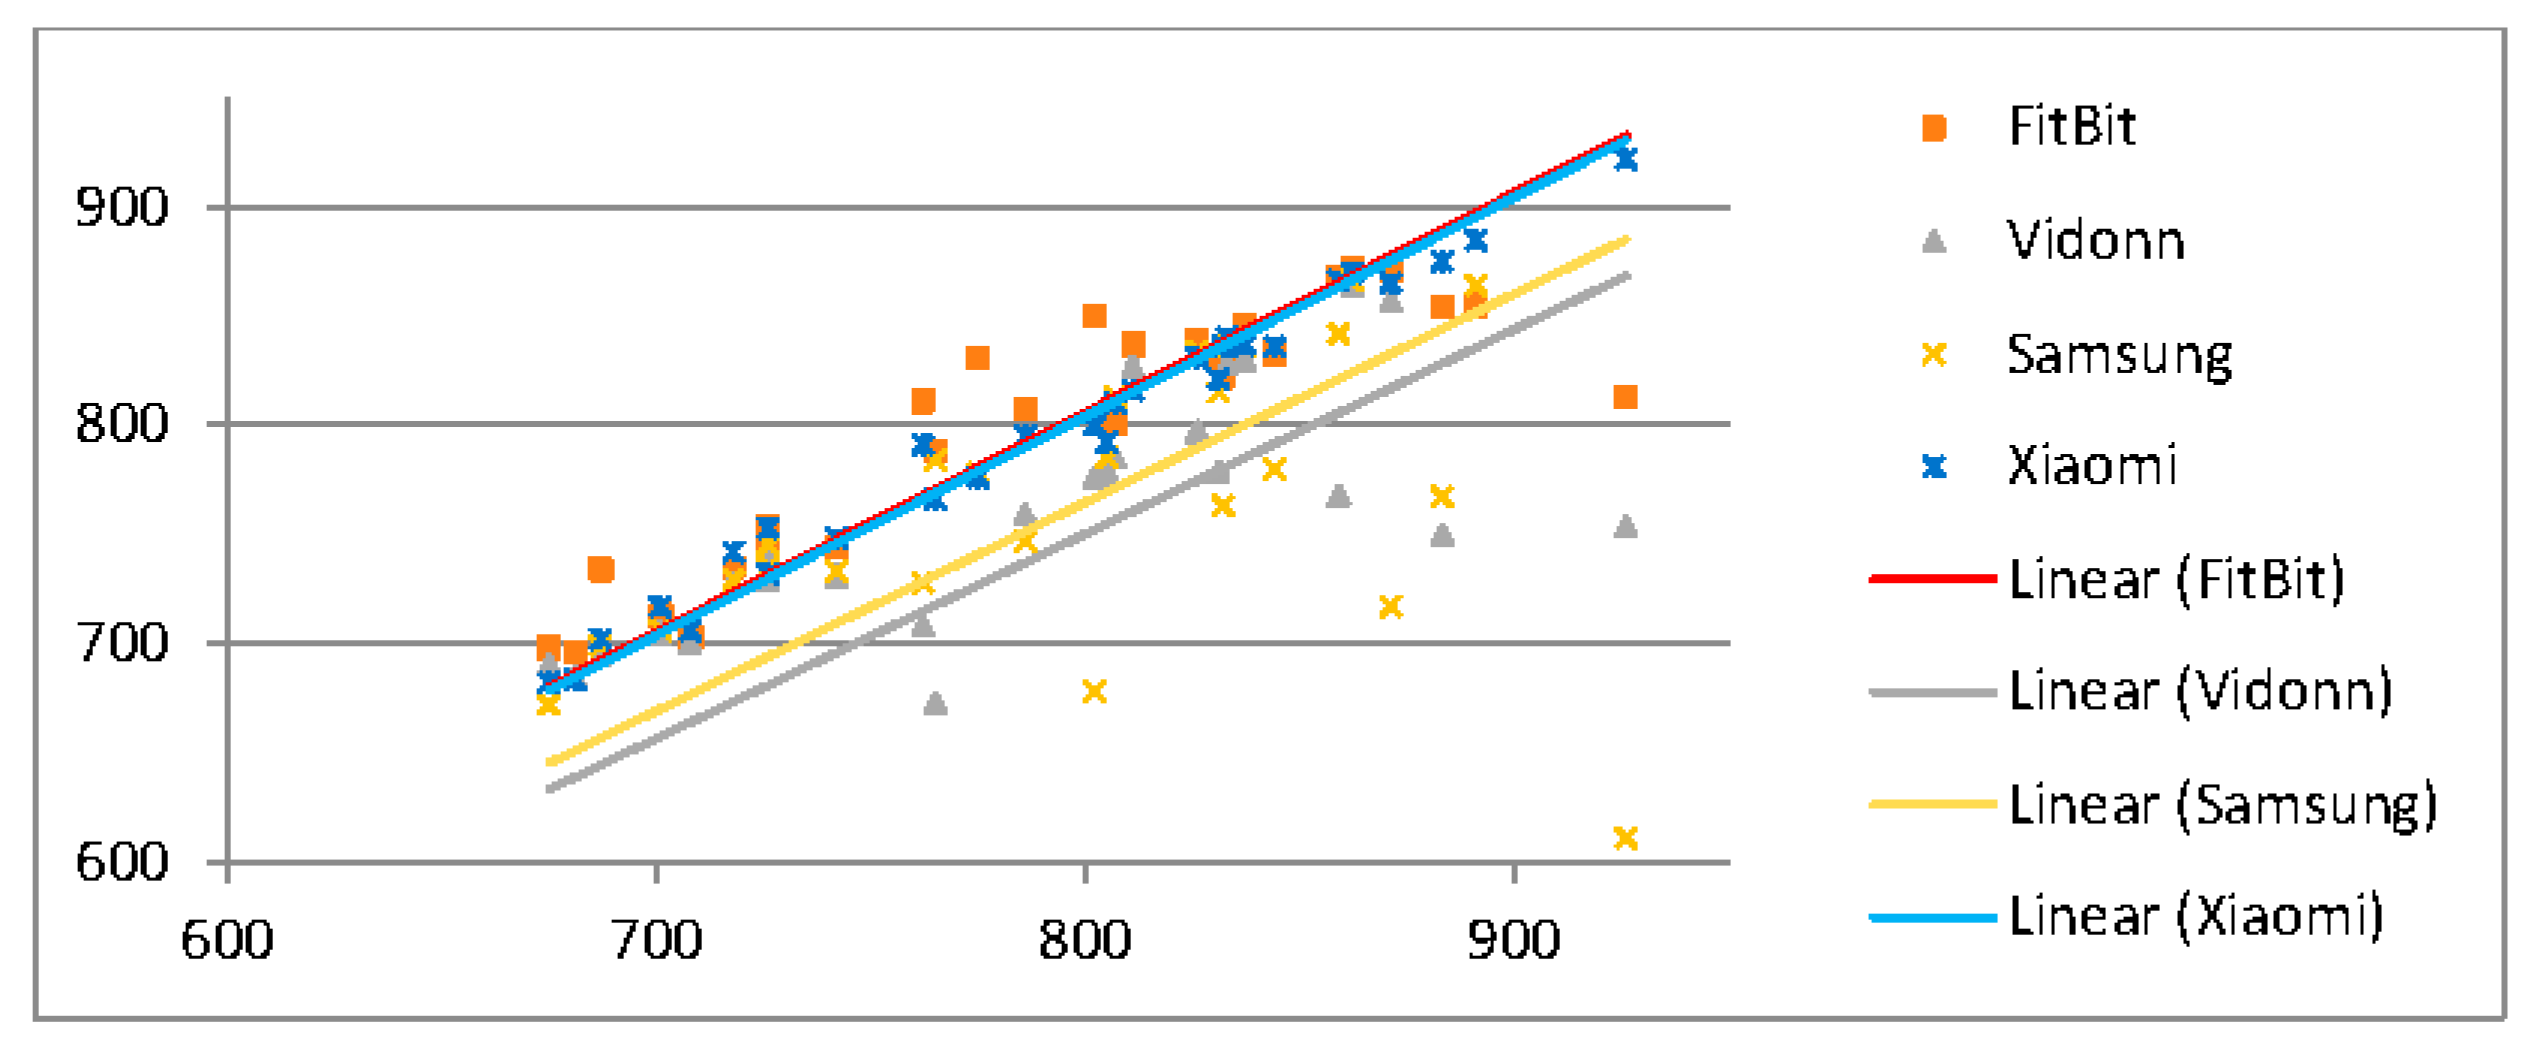
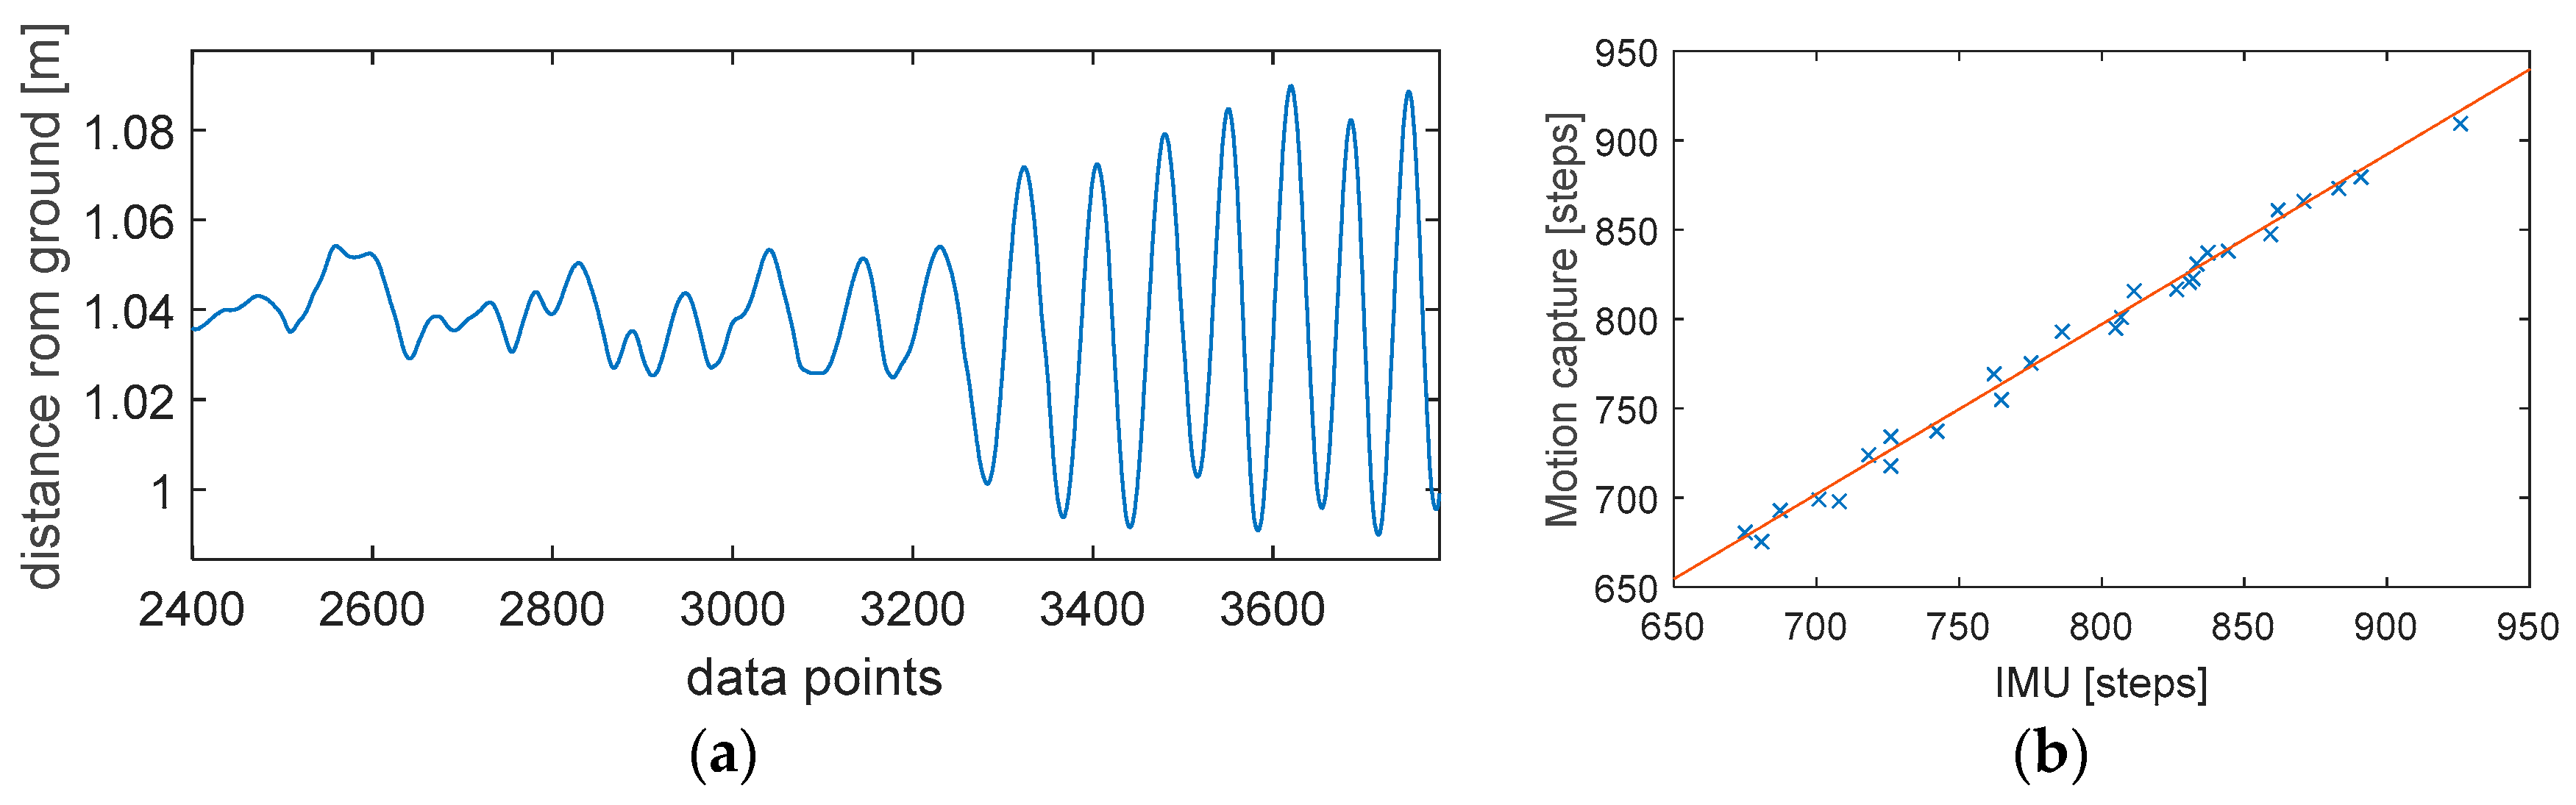
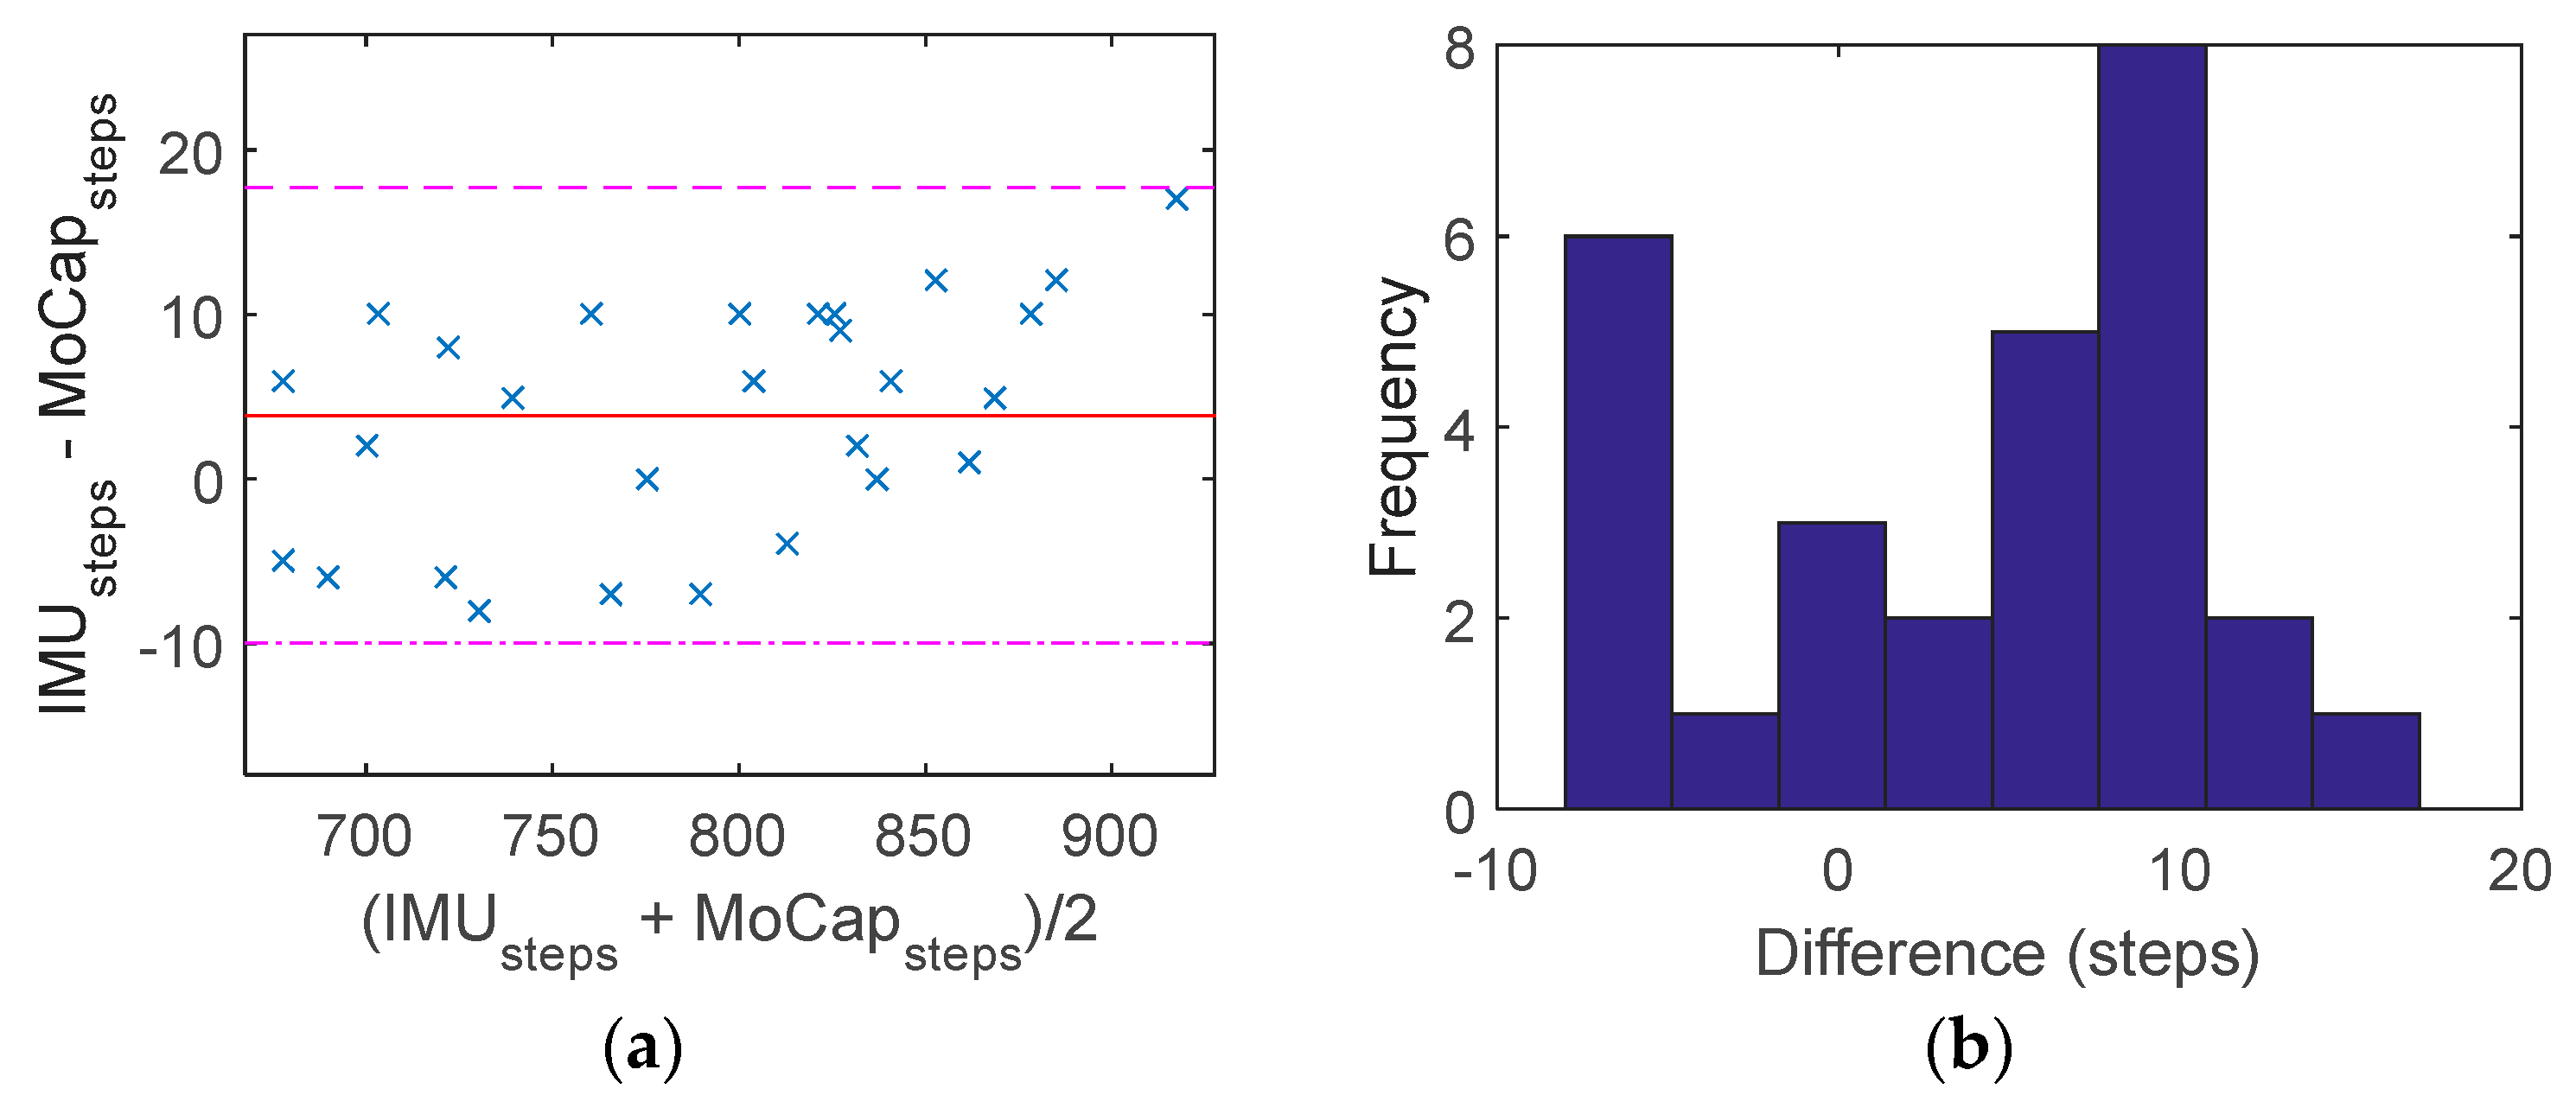
3. Results
4. Discussion & Conclusions
Acknowledgments
Conflicts of Interest
References
- Wang, J.R.; Parameswaran, N. Survey of sports video analysis: Research issues and applications. In Proceedings of the Pan-Sydney Area Workshop on Visual Information Processing, Sydney, Australia, 1 June 2004; pp. 87–90. [Google Scholar]
- Terrier, P.; Schutz, Y. Variability of gait patterns during unconstrained walking assessed by satellite positioning (GPS). Eur. J. Appl. Physiol. 2003, 90, 554–561. [Google Scholar] [CrossRef] [PubMed]
- Wixted, A.J.; Billing, D.C.; James, D.A. Validation of trunk mounted inertial sensors for analysing running biomechanics under field conditions, using synchronously collected foot contact data. Sports Eng. 2010, 12, 207–212. [Google Scholar] [CrossRef]
- Alonge, F.; Cucco, E.; Ippolito, F.; Pulizzotto, A. The Use of Accelerometers and Gyroscopes to Estimate Hip and Knee Angles on Gait Analysis. Sensors 2014, 14, 8430–8446. [Google Scholar] [CrossRef] [PubMed]
- Tong, K.; Granat, M.H. A practical gait analysis system using gyroscopes. Med. Eng. Phys. 1999, 21, 87–94. [Google Scholar] [CrossRef]
- Espinosa, J.L.H.G.; James, D.A. The inertial sensor: A base platform for wider adoption in sport science applications. J. Fit. Res. 2015, 4, 13–20. [Google Scholar]
- U.N.O. LTX6. 2017. Available online: http://www.benysports.de/assets/bedienungsanleitung_ltx6_inst-manual-2012.12.20.pdf (accessed on 1 December 2017).
- FitBit. Alta. Available online: https://www.fitbit.com/uk/alta#features (accessed on 1 December 2017).
- Samsung. Gear Fit SM-R350. Available online: http://www.samsung.com/uk/wearables/gear-fit-r350/ (accessed on 1 December 2017).
- Vidonn. X6. Available online: http://en.vidonn.com/ProductX6.html (accessed on 1 December 2017).
- Xiaomi. MiBand 2. Available online: http://www.mi.com/en/miband2/ (accessed on 1 December 2017).
- OptiTrack. Prime 13. Available online: http://optitrack.com/products/prime-13/ (accessed on 1 December 2017).
- OptiTrack. Motive. Available online: http://optitrack.com/products/motive/ (accessed on 1 December 2017).
- Lai, A.; James, D.A.; Hayes, J.P.; Harvey, E.C. Semi-automatic calibration technique using six inertial frames of reference. In Proceedings of the Microelectronics: Design, Technology, and Packaging, Perth, Australia, 30 March 2004. [Google Scholar]
- Stamm, A.; Thiel, D.V. Investigating Forward Velocity and Symmetry in Freestyle Swimming Using Inertial Sensors. Procedia Eng. 2015, 112, 522–527. [Google Scholar] [CrossRef]


| Participant Number | Height (cm) | Mass (kg) | Experience | Gender |
|---|---|---|---|---|
| 1 | 185 | 82 | Novice | Male |
| 2 | 161 | 67 | Novice | Male |
| 3 | 167 | 57 | Novice | Female |
| 4 | 176 | 89 | Recreational | Male |
| 5 | 171 | 62 | Recreational | Male |
| 6 | 166 | 65 | Triathlete | Female |
| Runner 4 | Steps Recorded | |||||
|---|---|---|---|---|---|---|
| Trial | IMU | Motion Tracking | FitBit | Samsung | Vidonn | Xiaomi |
| 1 | 811 | 815 | 837 | 816 | 827 | 816 |
| 2 | 833 | 831 | 830 | 837 | 828 | 840 |
| 3 | 862 | 861 | 872 | 866 | 864 | 870 |
| 4 | 837 | 837 | 846 | 836 | 830 | 837 |
| 5 | 871 | 866 | 871 | 717 | 857 | 865 |
| Device | IMU | |
|---|---|---|
| Slope | r2 | |
| Motion tracking | 1.011 | 0.998 |
| FitBit | 1.003 | 0.963 |
| Samsung | 0.942 | 0.815 |
| Vidonn | 0.906 | 0.769 |
| Xiaomi | 1.006 | 0.996 |
Publisher’s Note: MDPI stays neutral with regard to jurisdictional claims in published maps and institutional affiliations. |
© 2018 by the authors. Licensee MDPI, Basel, Switzerland. This article is an open access article distributed under the terms and conditions of the Creative Commons Attribution (CC BY) license (https://creativecommons.org/licenses/by/4.0/).
Share and Cite
Stamm, A.; Hartanto, R. Feature Extraction from MEMS Accelerometer and Motion Tracking Measurements in Comparison with Smart Bands during Running. Proceedings 2018, 2, 197. https://doi.org/10.3390/proceedings2060197
Stamm A, Hartanto R. Feature Extraction from MEMS Accelerometer and Motion Tracking Measurements in Comparison with Smart Bands during Running. Proceedings. 2018; 2(6):197. https://doi.org/10.3390/proceedings2060197
Chicago/Turabian StyleStamm, Andy, and Ronny Hartanto. 2018. "Feature Extraction from MEMS Accelerometer and Motion Tracking Measurements in Comparison with Smart Bands during Running" Proceedings 2, no. 6: 197. https://doi.org/10.3390/proceedings2060197
APA StyleStamm, A., & Hartanto, R. (2018). Feature Extraction from MEMS Accelerometer and Motion Tracking Measurements in Comparison with Smart Bands during Running. Proceedings, 2(6), 197. https://doi.org/10.3390/proceedings2060197