Proceeding Paper

Total, Dissolved and Particulate N:P Stoichiometry in Canadian Prairie Streams in Relation to Land Cover and Hydrologic Variability †

by
Kim J. Rattan
* and
Patricia A. Chambers
Environment and Climate Change Canada, Centre for Inland Waters, Burlington, ON L7S 1A1, Canada
*
Author to whom correspondence should be addressed.
Presented at the 2nd International Electronic Conference on Water Sciences, 16–30 November 2017; Available online: http://sciforum.net/conference/ecws-2.
Proceedings 2018, 2(5), 183; https://doi.org/10.3390/ecws-2-04952
Published: 16 November 2017
(This article belongs to the Proceedings of The 2nd International Electronic Conference on Water Sciences)

Abstract

:
Riverine concentrations and loads of nitrogen (N) and phosphorus (P), in both dissolved and particulate fractions, are influenced by land cover and hydrologic variability. Previous studies on relationships between watershed characteristics and stream chemistry have focused on the response of individual N and P fractions. However, marine and lakes studies have shown the value of using individual nutrient fractions as well as nutrient ratios (e.g., N:P) to assess ecosystem condition. This study examined variation in total, dissolved, and particulate N:P ratios in response to changes in crop cover and hydrologic variability in agricultural catchments in the Red River Basin, southern Manitoba, Canada. For both study years (2013 and 2014), discharge was greatest during snowmelt; however, flow ceased in early June 2013 due to lack of precipitation whereas discharge peaks were observed during summer and fall 2014 in response to persistent multi-day rain events. Despite hydrologic differences between the two years, total, dissolved, and particulate N:P concentration ratios did not differ (p > 0.05) between years (expressed as either annual or seasonal means) or vary with crop cover. In contrast, N:P load ratios were associated with watershed characteristics: total N:P and dissolved load ratios differed (p < 0.05) both seasonally and with extent of crop cover whereas particulate N:P load ratios differed (p < 0.05) among seasons and between years. These findings suggest that dissolved load ratios are more closely linked to land use activities whereas particulate load ratios are largely influenced by climate and discharge variability. Improved knowledge of dominant nutrient fractions and their transport pathways will assist in determining appropriate mitigation practices to reduce nutrient loads under a changing climate.

1. Introduction

Runoff and seepage from agricultural land cover are a major source of nutrient loading to aquatic ecosystems [1], resulting in eutrophication and loss of valuable ecosystem services. In the North American Great Plains, more than 82% of tallgrass prairie has been lost as a result of conversion to agricultural and urban land cover [2]. These land-use changes, as well as stream manipulations (e.g., channelization; riparian and instream vegetation removal), have increased nutrient export to aquatic ecosystems, contributing to eutrophication of prairie lakes, toxic algal blooms and loss of sensitive species [2,3,4].
Concentrations and loads of nitrogen (N) and phosphorus (P), in both dissolved and particulate fractions, are sensitive to land cover and hydrologic variability. This is particularly true in cold regions where strong seasonality of climate and hydrology drives the transport and delivery of nutrients and other pollutants from source watersheds to downstream receiving waters [4]. For example, a three-year study of seasonality of nutrient export from 11 Canadian prairie streams showed that total P and total N concentrations and loads both peaked during the snowmelt season [5]. Similarly, in selected Finnish catchments, total P and total suspended solids concentrations tracked changes in seasonal discharge, with highest values in April during snowmelt [6]. This flush of nutrients associated with snowmelt in cold regions is caused by the combined effect of intense runoff (which is dependent upon antecedent moisture conditions such as snow depth as well as the rate of warming [7]), frozen soils which restrict infiltration of snowmelt [7], and the presence of nutrients in the form of residual inorganic fertilizer or organic matter residue (crop, pasture or riparian material; [8]). An additional Scandinavian study in Swedish agricultural catchments draining to the Baltic Sea have been estimated to contribute around 40% of the total anthropogenic load [9]. These non-point P losses from agricultural lands are largely snowmelt driven and the impact of drainage P losses includes eutrophication and potential harmful algal bloom formation. Because nutrient losses from cold region watersheds are closely tied to hydroclimatology, changes in the amount of snowpack influence the timing and magnitude of nutrient loss from the land base to proximate streams and, ultimately, downstream waterbodies.
Although increased loss of nitrogen (N) and phosphorus (P) from the land base would be expected to increase nutrient concentrations in receiving waters, differences in uptake and retention of these nutrients (both on the land and along water courses) can lead to proportional changes in stoichiometric ratios [10,11]. Such changes may be related to specific drivers if one nutrient responds strongly to a driver (e.g., nitrogen loss through denitrification) but the other is unaffected. Conversely, ratios will remain relatively constant if concentrations of both N and P respond similarly to a driver (e.g., both nutrients increase in response to waste water effluent discharge) [12]. For agriculturally dominated watersheds, river-water dissolved N:P ratios are frequently indicative of the types and extent of agriculture in the basin. Fertilizer application to cropland contributes the majority of N to rivers in agriculturally-dominated watersheds, leading to high total and dissolved N:P ratios in river water. In contrast, livestock manure has a low N:P ratio and application of manure to meet crop N requirements results in excess P applied to the field and, in turn, low total and dissolved N:P ratios in river water [13]. Temporal variation in N:P ratios has significant implications for aquatic food webs, particularly the productivity and composition of algal communities. For example, the 2011 record-setting algal bloom in Lake Erie consisted of Microcystis sp. followed by Anabaena sp. [14]. This species replacement was likely related to shifts in N and P concentrations: Microcystis sp. abundance was made possible by high concentrations of soluble reactive P and dissolved inorganic N, whereas N-fixing Anabaena sp. occurred after the Microcystis sp. bloom when DIN was likely depleted [14]. Similarly, in eastern catchments located in the Baltic Sea drainage basin, the N:P ratio gradually declined, largely caused by increases in P loadings from agricultural catchments and point sources from waste water treating plants and factories. The result from declining N:P ratios was eutrophication caused by green algal blooms [15]. Yet, comparatively little is known about riverine N:P ratios, particularly particulate N:P ratios, and the influence of changing land use and hydroclimatology in controlling N:P ratio mobilization and delivery in tributaries.
The objective of this research was to assess the response of N:P ratios, expressed as both concentrations and loads, to changes in crop cover and hydrologic variability in agricultural catchments in the Red River Valley (RRV), southern Manitoba, Canada. Prior research (Rattan et al. in submission) showed that 2013 and 2014 were very different hydrological years in the RRV. Streamflow in 2013 showed a pattern typical of the Canadian prairies with high discharge during snowmelt followed by cessation of flow in early June due to lack of precipitation. In contrast, the 2014 hydrologic cycle was consistent with future climate predictions: discharge still peaked during snowmelt but, compared to 2013, was 49% lower during snowmelt yet 21% higher during summer and fall due to greater rainfall. By assessing N:P mobilization in relation to both hydrological conditions and land cover, we identified factors influencing the nutrient stoichiometry of prairie streams. Such information is critical for management of eutrophication of downstream water bodies, such as Lake Winnipeg.

2. Material and Methods
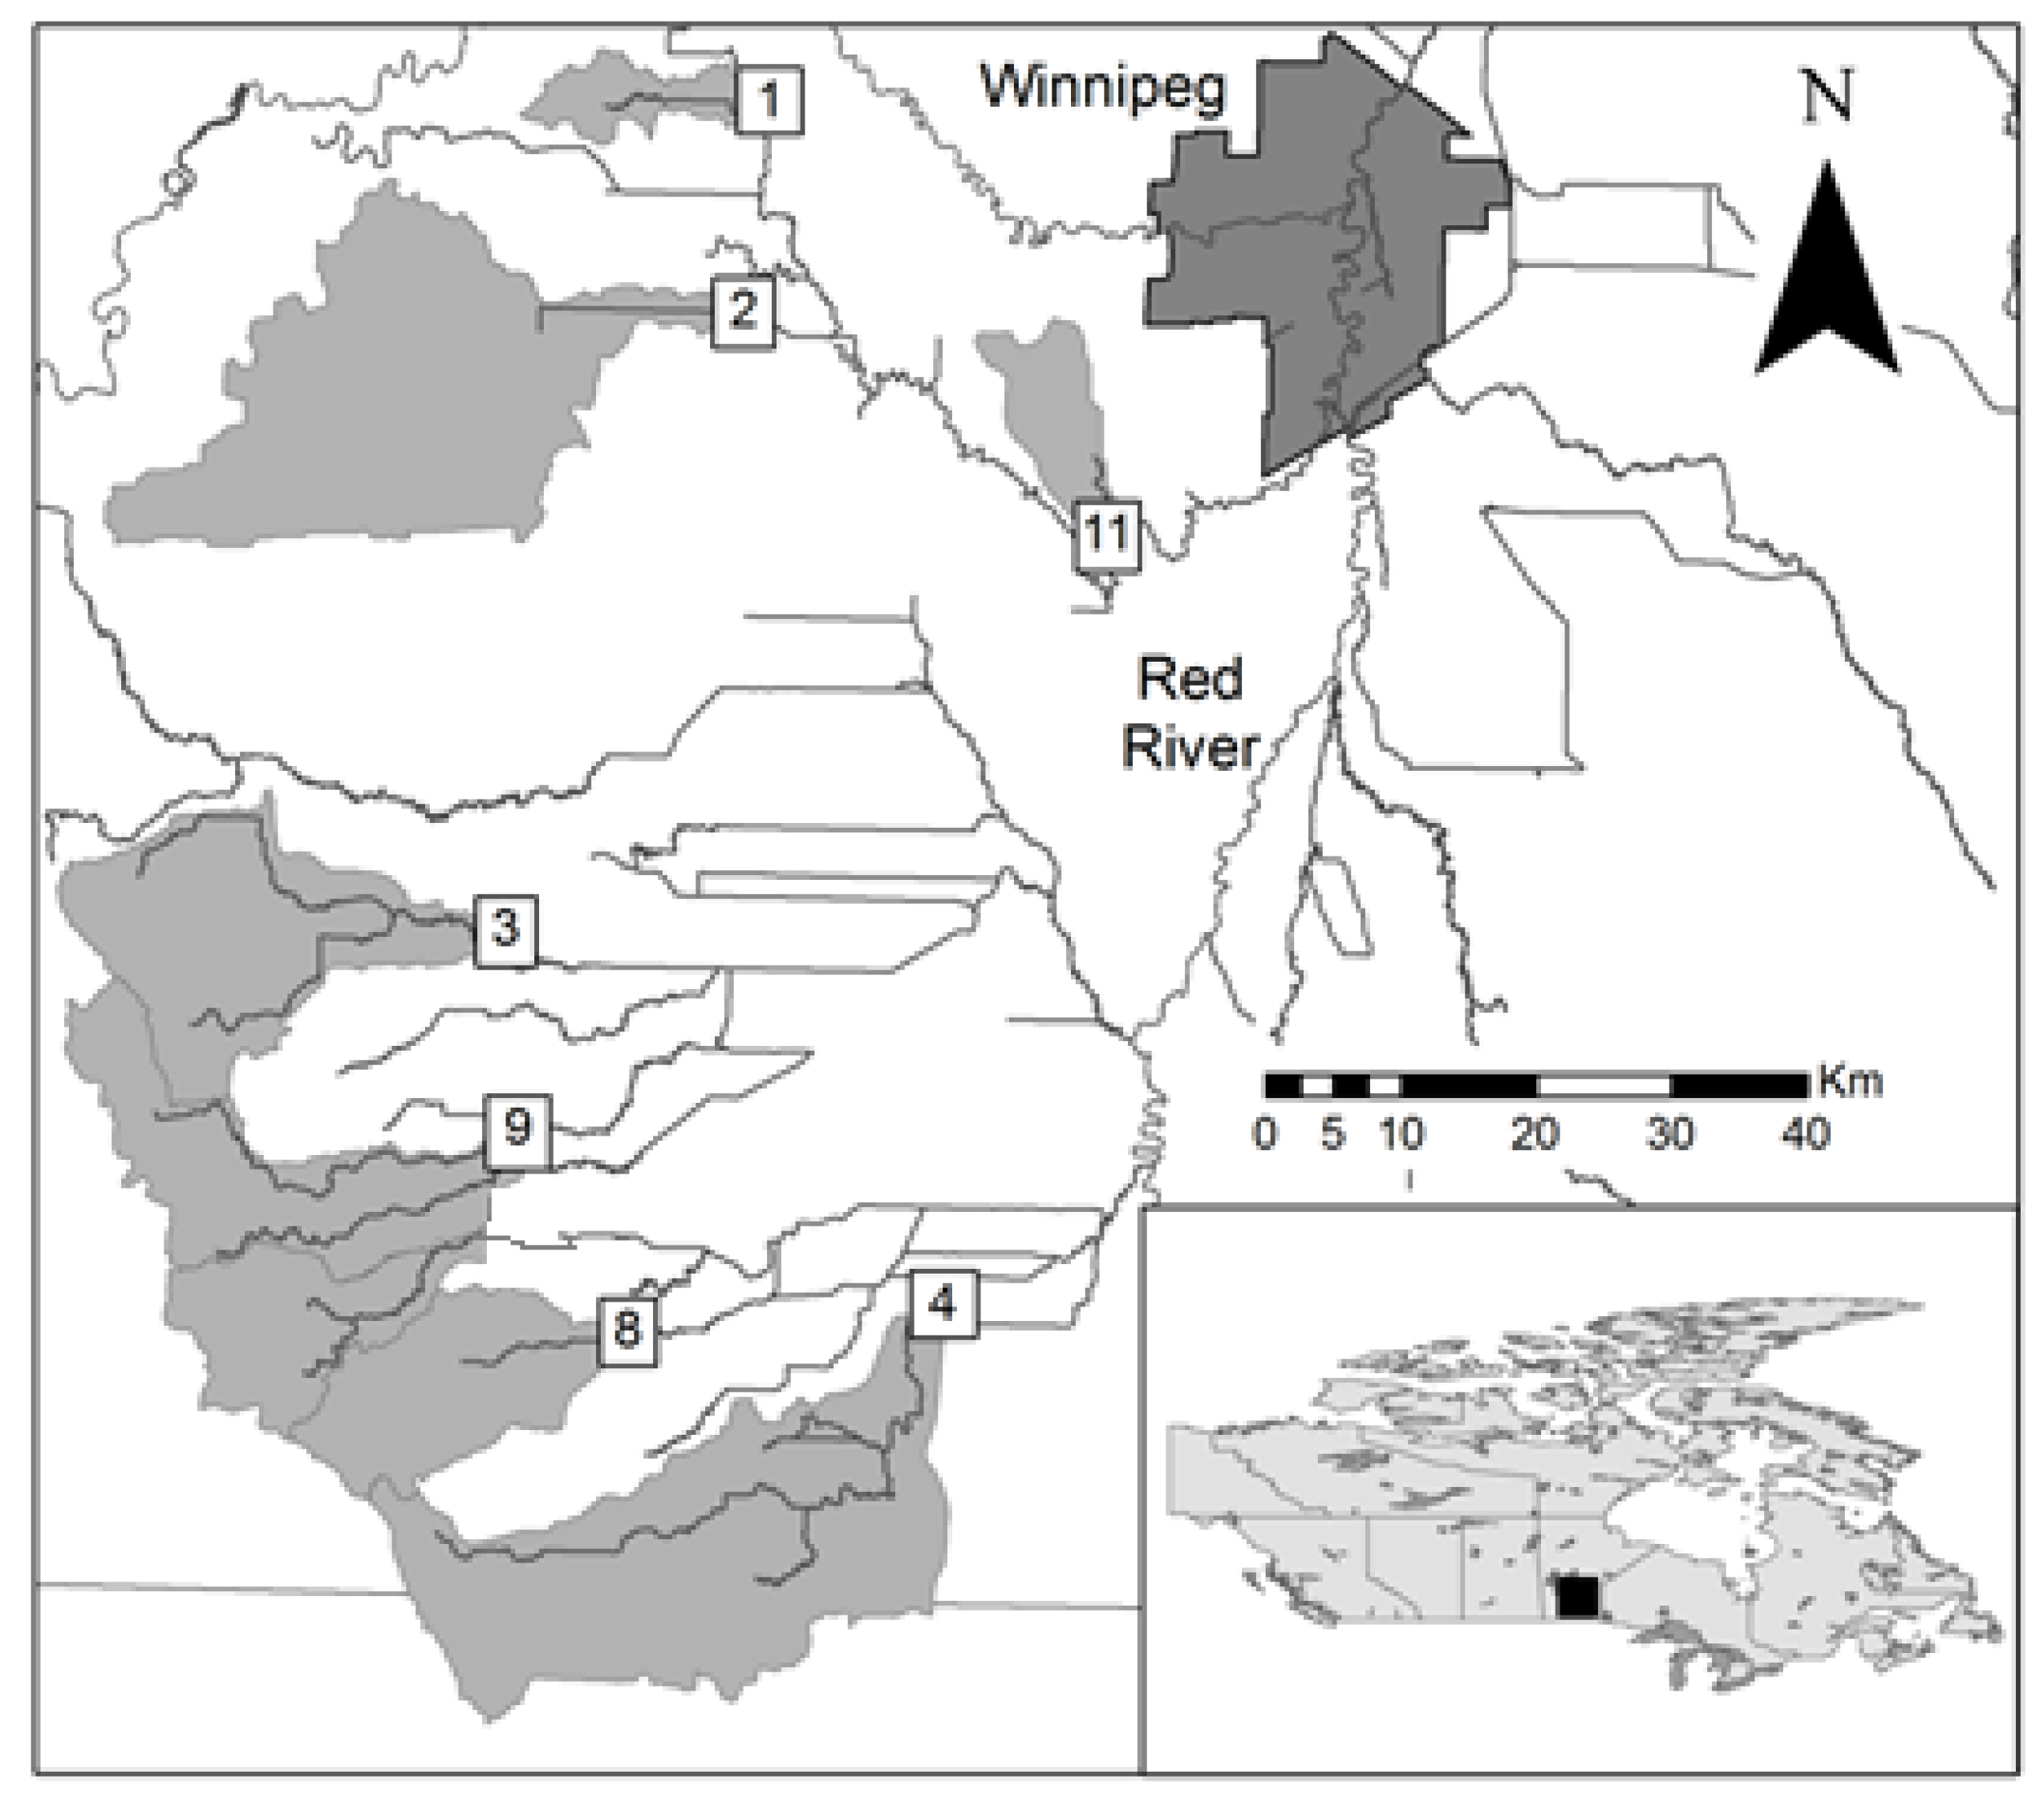
2.1. Study Area

This study was conducted in the RRV of southern Manitoba (Figure 1). Seven sub-watersheds were selected [6] to span a gradient in nutrient-producing human activities resulting primarily from livestock density and crop cover (Table 1). A detailed description of the methods of calculation of human activity intensity (livestock and crop) is given by [16]. Briefly, livestock production estimates were derived from the 2006 Canadian Census data (http://www.statcan.gc.ca/pub/95-629-x/2007000/4123856-eng.html) and crop cover was calculated using data from the Manitoba Agricultural Services Corporation (www.mmpp.com/mmpp.nsf/mmpp_publications.html, 2006). The extent of crop cover varied from 59% to 92% across all seven sub-watersheds, which made this land use activity suitable for testing whether changes in crop cover affect total, dissolved, and particulate N:P concentration and load ratios.
All sites were characterized by low topographic relief with soils dominated by fine silt and clay [16]. The region experiences a cold continental climate with the warmest month being July (20 °C) and the coldest January (−14.6 °C) (1981–2010 records for Morden, MB; http://climate.weather.gc.ca/). Annual precipitation averages 426 mm, with 27.1% occurring as snow (1981–2010 records for Morden, MB; www.climate.weatheroffice.gc.ca). Most snowfall occurs from October to May, with 19–59 mm of precipitation in each of those months. Air temperature (mean daily values, °C), rain precipitation, and snow accumulation were obtained from the Morden, MB station (www.climate.weatheroffice.gc.ca).

2.2. Hydrology and Chemistry

Hydrology and chemistry data were collected during the open-water of 2013 and 2014, as reported in Rattan et al. (in submission). In brief, water levels and temperature were recorded every 30 min at each site with a pressure transducer logger (HOBOware). Daily discharge for each site was estimated from the relationship between water level measured at the site and discharge at the nearest Water Survey of Canada (WSC) station (https://wateroffice.ec.gc.ca), corrected for the difference in watershed area between the WSC station and sample site [3]. Grab water samples (from a depth of 20 cm) were collected during the open-water seasons (25 April–31 October) of 2013 and (7 April–31 October) of 2014. Samples were not collected during winter as rivers in the RRV (with the exception of the largest) typically freeze to the bottom. Nutrient samples were analyzed for total P (TP), dissolved phosphorus, soluble reactive phosphorus (SRP), total N (TN), dissolved nitrogen and dissolved inorganic nitrogen (DIN) using standard methods. Particulate P and N were determined by subtracting total dissolved from total concentrations of P and N [17]. Nutrient loads were calculated as the product of discharge and nutrient concentration. For dates with missing daily discharge or concentration measurements, values were linearly interpolated between the nearest two sampling dates.

2.3. Statistical Analyses

Data were analyzed for the 2013 and 2014 open-water years or by season. Snowmelt and spring started on 25 April and 13 May in 2013 compared to 7 April and 28 April in 2014. Summer and fall seasons were the same for both years: 1 June–31 August and 1 September–31 October, respectively. Analysis of co-variance (ANCOVA), with crop cover as the co-variate, was used to identify differences (p < 0.05) in nutrient concentration and load ratios (TN:TP, DIN:SRP, and PN:PP) among seasons and between years. Data that did not meet normality assumptions (Shapiro–Wilk test) were log-transformed to meet parametric assumptions. Post hoc Tukey’s test was used to identify significant differences (p < 0.05). All statistical tests were performed using Minitab ver. 14 (State College, PA, USA).

3. Results and Discussion

Comparison of nutrient stoichiometry of prairie streams in relation to hydrological conditions showed that N:P load ratios, but not concentrations ratios, differed between a “classic” (snowmelt-driven) hydrologic year of 2013 and a rainier, warmer year of 2014. Despite temporal differences in discharge, total, dissolved and particulate N:P concentration ratios did not differ (p > 0.05) between years (expressed as either annual or seasonal means) or seasons within a year (Table 2). In contrast, total and dissolved nutrient load ratios differed seasonally (p < 0.05) while particulate load ratios differed both annually and seasonally. Prior research showed that our two study years, although sequential, represented two different hydroclimatological scenarios: 2013 was typical of historical Canadian prairie climate and hydrology (i.e., snowy winter, spring rain followed by a dry summer) whereas 2014 was consistent with future climate scenarios (i.e., less snow cover, earlier snow depletion, and a wet summer) (Table 2, Rattan et al., in submission). Furthermore, differences in hydroclimatological properties between our two study years were consistent with long-term (>40 year) records for the northern prairies, in that recent years are characterized by reduced snow depth and shorter snow cover duration [18,19], increased and persistent rain events, and greater delivery of rain during summer [20,21].

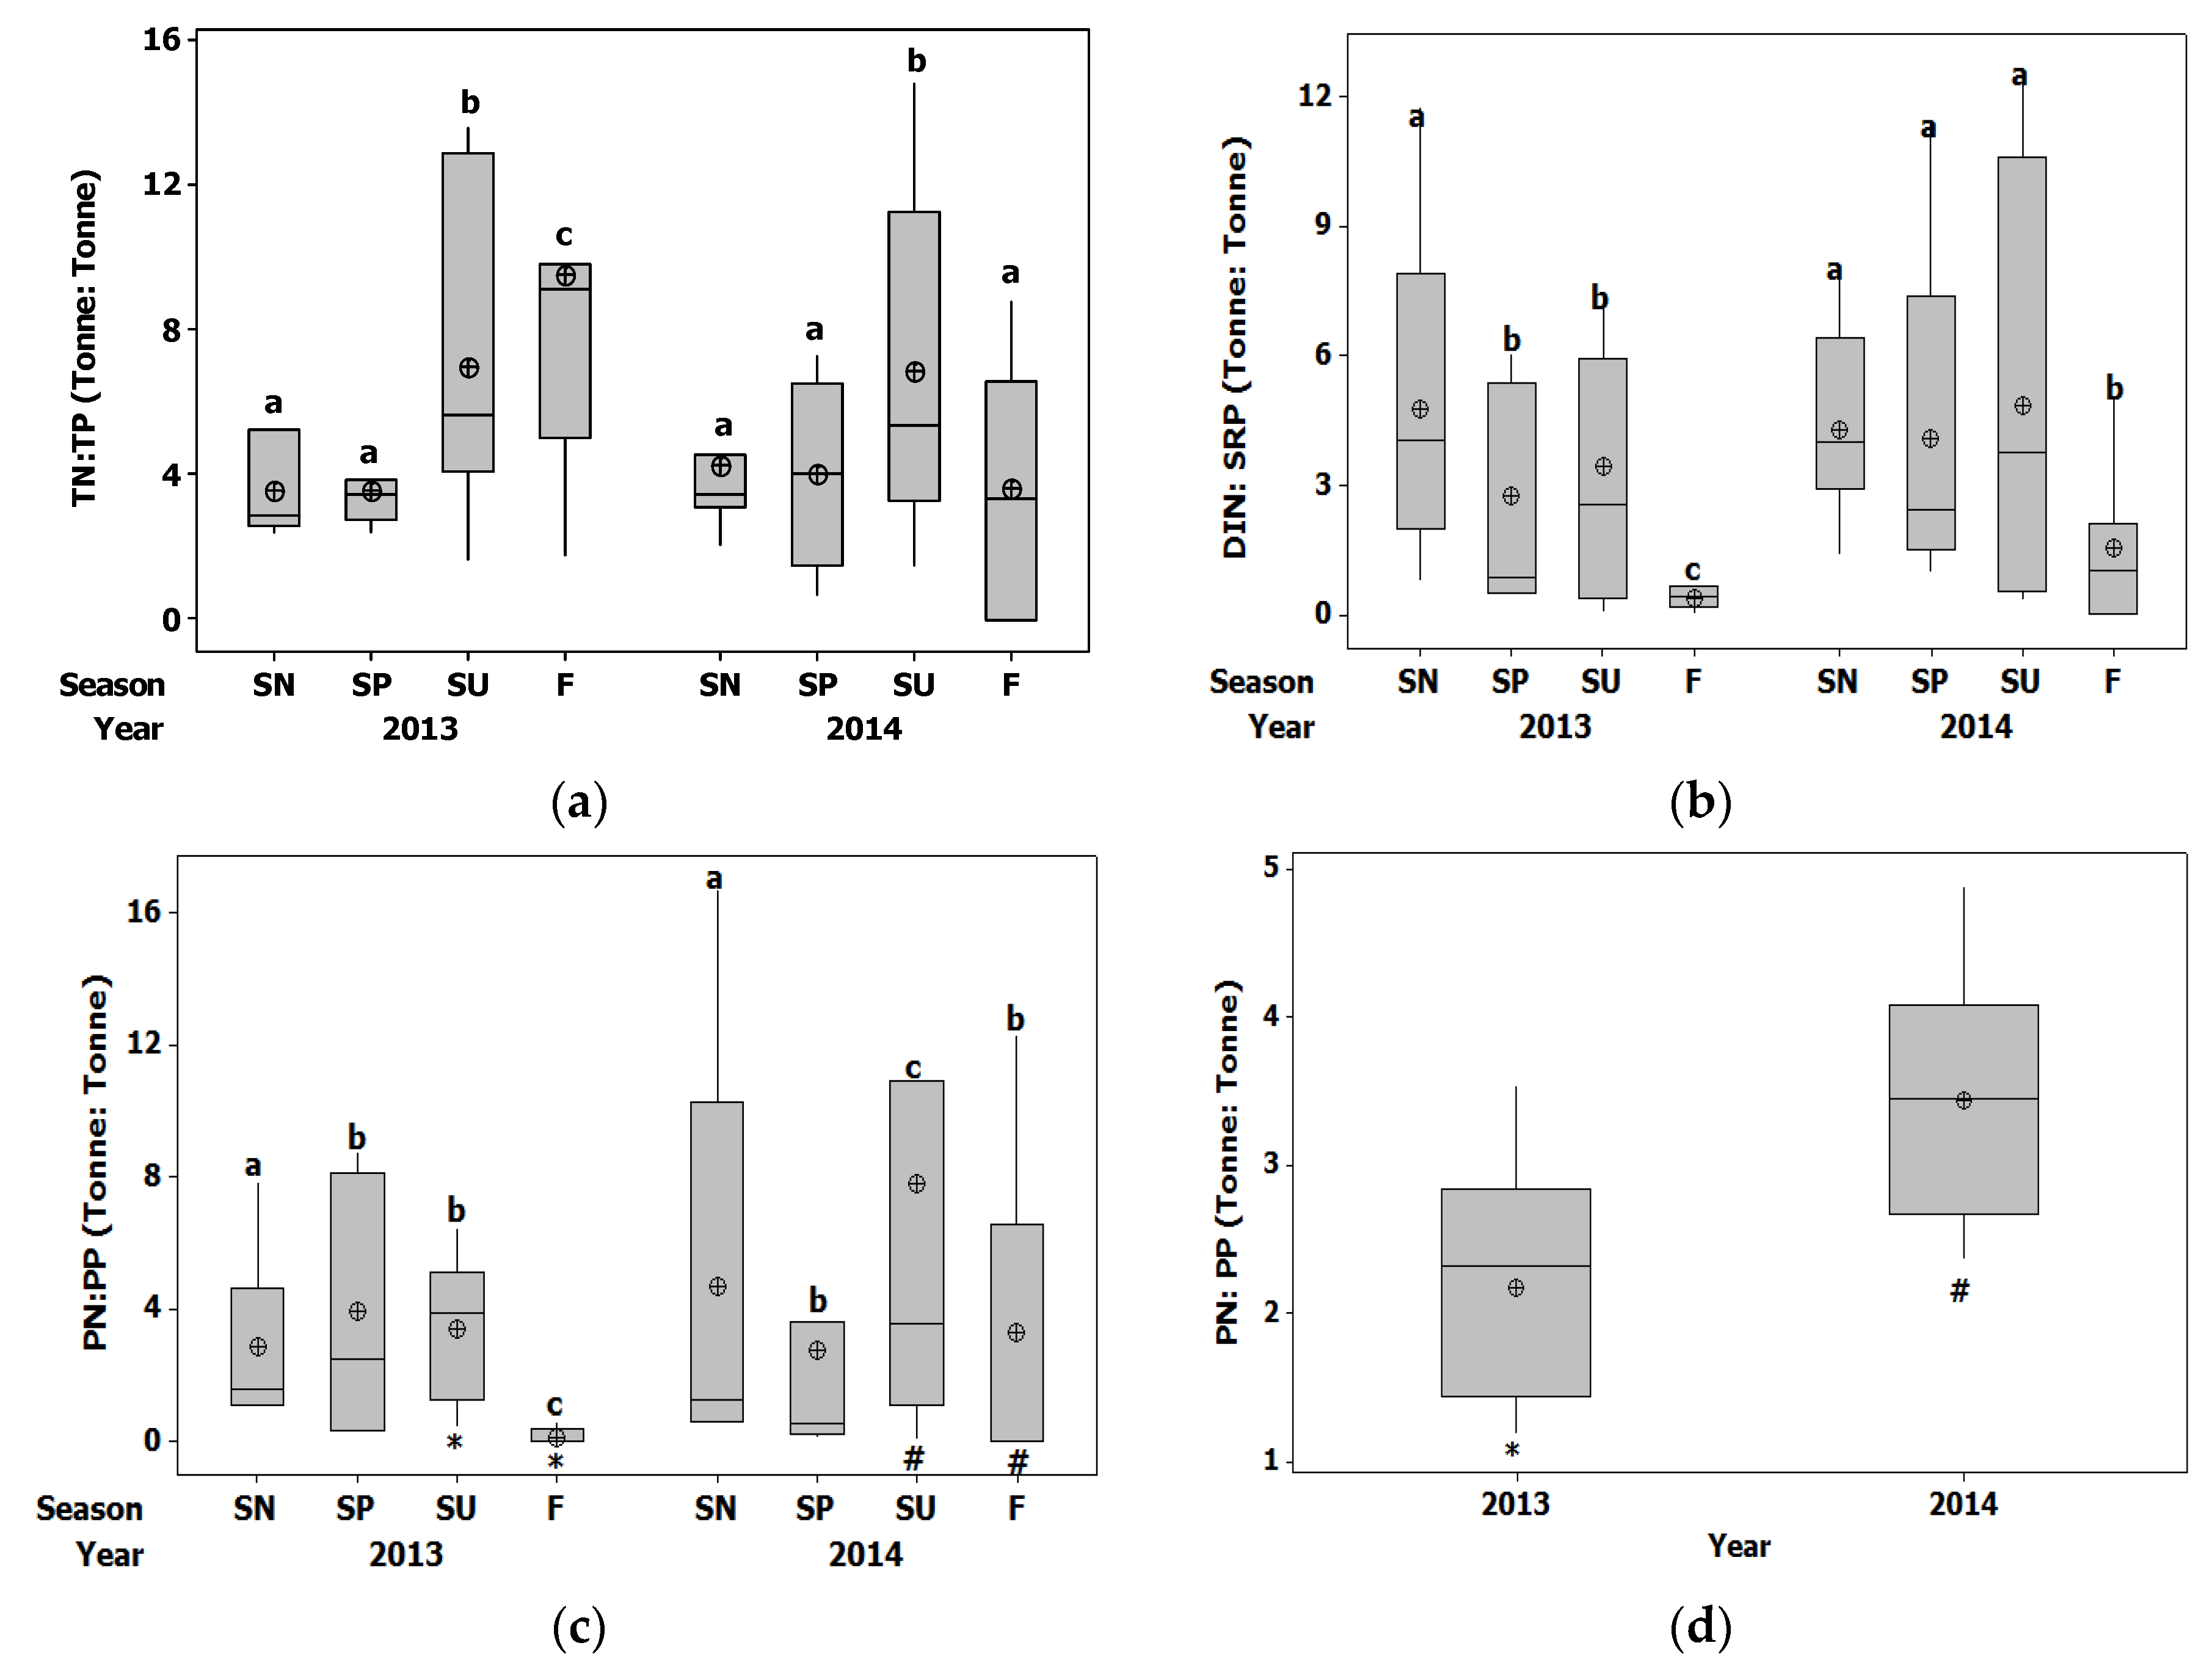
3.1. Nutrient Concentrations Ratios

Analysis of nutrient ratios using two-factor Analysis of Covariance showed that, on an annual basis, concentration ratios exhibited no significant (p > 0.05) relationship with temporal variables (year, season) or percent crop cover (Table 3). Concentration ratios remained relatively constant at 6–7 TN:TP, 2–5 DIN:SRP and 10–12 PN:PP between years and among seasons (Table 2), despite differences in concentrations between years and among seasons for certain nutrient parameters (Table 3). The lack of relationship between N:P concentration ratios and both hydroclimatology and land cover probably relates to nutrient delivery and biological activity. While both dissolved and total N and P concentrations peaked during snowmelt as a result of rapid transfer of land-based nutrient sources, this was a period of low biological activity [6]. During summer, lower rates of transfer of nutrients from land to water and high rates of biogeochemical processes (nutrient cycling and primary production) may contribute to shifts in nutrient concentrations. However, our finding that N:P concentrations ratios did not change between snowmelt and summer signifies that N and P were taken up in similar proportion by biota, little biological activity occurred during summer, or there was an over-riding abiotic control of stream nutrients [22]. Our observations of moderate to high planktonic algal abundance (13.7 µg/L summer mean and 58.0 µg/L summer maximum Chl a concentration; K. Rattan unpublished data) and low N:P concentration ratios (i.e., TN:TP and DIN:SRP consistently <16) suggest that enhanced algal production during summer should have been associated with a stoichiometric shift. The lack of stoichiometric difference in N:P concentration ratios between snowmelt and summer, as well as high N and P concentrations throughout the year, suggest that streamwater nutrient concentrations were primarily determined by abiotic nutrient sources (e.g., agricultural inputs, groundwater inputs, point sources, internal loading) [22,23].

3.2. Nutrient Load Ratios

Two-factor ANCOVA applied to N:P load ratios showed significant effects of year (particulate ratio), season (total, dissolved and particulate ratios), and crop cover (total and dissolved ratios) (Table 3). In the case of PN:PP ratios, values were significantly greater in 2014 (the rainier, warmer year) versus 2013 (snowmelt-driven year). Moreover, within each year, values were greater during seasons when the soil was wet but not frozen (spring 2013 and summer 2014) (Figure 2). These findings suggest that under wetter soil conditions, greater quantities of PN are exported relative to PP. Export of PN relative to PP was not, however, associated with the extent of crop cover in the watershed.
Total and dissolved N:P load ratios showed significant effects of season and crop cover for both 2013 and 2014 (Figure 2c). In the case of TP:TN, load ratios were higher (p < 0.05) in summer and fall than during snowmelt and spring. In contrast, dissolved N:P ratios were lowest during fall. The seasonality in total and dissolved N: P load ratios is likely attributable to weather conditions. Delivery of P to streams is influenced by hydrological activity whereas N typically moves through the landscape in dissolved forms with fluxes controlled by sources and sink of N in the landscape [24]. Rain events likely cause nutrient transport via soil water, which is more applicable to N due to the adsorptive nature of P [24].
Our finding that both TN:TP and DIN:SRP load ratios were positively correlated with percent crop cover agrees with other Midwestern prairie studies that show relationships between N:P stoichiometry and agricultural land use [3,12,25]. For example, work in small catchments in Iowa demonstrated that N:P stoichiometry was related to agricultural land use, such that lakes draining watersheds dominated by row crops had consistently higher N:P concentration ratios than lakes in watersheds dominated by pastureland [26]. Because crops have higher demands for N compared to P, intensive crop agriculture can result in a decline in N:P of receiving waters.

4. Conclusions

Our finding that dissolved versus particulate N:P load ratios responded differently to land use and hydrologic changes suggests that the dissolved load ratios are more closely linked to land use activities whereas particulate load ratios are largely influenced by interannual climate and discharge variability. In addition, our results showed that dissolved and total N:P load ratios were positively correlated with the extent of crop cover, indicating that the extent and type of agricultural land use led to fundamental differences in N:P ratios. The seasonal changes we observed in nutrient stoichiometry could be further exacerbated by future climate scenarios where more frequent multi-day precipitation events are expected to occur during summer and fall in southern Manitoba. The stoichiometry of streams draining the Red River Valley has important implications for downstream Lake Winnipeg. The southern basin of the lake experienced an ecosystem state change between 1990 and 2010, when increased hog and crop production in the basin was associated with higher soluble N and P concentrations and, in turn, more frequent and extensive formation of harmful algal blooms such as Microcystis sp. [27]. Being able to predict stoichiometry is important given its strong effects on a variety of ecological processes, including primary production [27].

Acknowledgments

We thank Ross MacKay, Zoey Duggan, Jon Challis, Julie Anderson, and Alistair Brown for their contributions to field data collection, and Adam Yates for ArcG.I.S. support. This project was funded by Environment and Climate Change Canada through the Lake Winnipeg Basin Initiative and a National Science Engineering Research Council (NSERC) Visiting Fellowship Award to K.J.R.

Conflicts of Interest

The authors declare no conflict of interest.

References

  1. Carpenter, S.R.; Caraco, N.F.; Correll, R.; Howarth, R.W.; Sharpley, A.N.; Smith, V.H. Non point pollution of surface waters with phosphorus and nitrogen. Ecol. Appl. 1998, 8, 559–568. [Google Scholar] [CrossRef]
  2. Dodds, W.K.; Gido, K.; Whiles, M.R.; Fritz, K.M.; Matthews, W.J. Life on the edge: The ecology of great plains: Prairie streams. Bioscience 2004, 54, 205–216. [Google Scholar] [CrossRef]
  3. Corriveau, J.; Chambers, P.A.; Yates, A.G.; Culp, J.M. Snowmelt and its role in the hydrologic and nutrient budgets of prairie streams. Water Sci. Technol. 2011, 64, 1590–1596. [Google Scholar] [CrossRef] [PubMed]
  4. Barnett, T.P.; Adam, J.C.; Lettenmaier, D.P. Potential impacts of a warming climate on water availability in snow-dominated regions. Nature 2005, 438, 303–311. [Google Scholar] [CrossRef] [PubMed]
  5. Rattan, K.J.; Corriveau, J.C.; Brua, R.B.; Culp, J.M.; Yates, A.G.; Chambers, P.A. Quantifying seasonal variation in total phosphorus and nitrogen from prairie streams in the Red River Basin, Manitoba Canada. Sci. Total Environ. 2017, 575, 649–659. [Google Scholar] [CrossRef]
  6. Rankinen, K.; Gao, G.; Granland, K.; Gronroos, J.; Vesikko, L. Comparison of impacts of human activities and climate change on water quantity and quality in Finnish agricultural catchments. Landsc. Ecol. 2015, 30, 415–428. [Google Scholar] [CrossRef]
  7. Fang, X.; Pomeroy, J.W.; Westbrook, X.; Guo, A.; Minke, G.; Brown, T. Prediction of snowmelt derived streamflow in a wetland dominated prairie basin. Hydrol. Earth Syst. Sci. 2010, 14, 991–1006. [Google Scholar] [CrossRef]
  8. Cade-Menun, B.J.; Bell, G.; Baker-Ismail, S.; Fouli, Y.; Hodder, K.; McMartin, D.W.; Perez-Valdivia, C.; Wu, K. Nutrient loss from Saskatchewan cropland and pasture in spring snowmelt runoff. Can. J. Soil Sci. 2013, 93, 445–458. [Google Scholar] [CrossRef]
  9. Bergstrom, L.; Kirchmann, H.; Djodjic, F.; Kyllmar, K.; Ulén, B.; Liu, J.; Andersson, H.; Aronsson, H.; Börjesson, G.; Kynkäänniemi, P.; et al. Turnover and losses of phosphorus in Swedish agricultural soils: Long term changes, leaching trends, and mitigation measures. J. Environ. Qual. 2015, 44, 512–523. [Google Scholar] [CrossRef]
  10. Vanni, M.J.; Renwick, W.H.; Bowling, A.M.; Horgan, M.J.; Christian, A.D. Nutrient stoichiometry of linked catchment-lake systems along a gradient of land use. Freshw. Biol. 2011, 56, 791–811. [Google Scholar] [CrossRef]
  11. Prater, C.; Frost, P.C.; Howell, T.E.; Watson, S.B.; Zastepa, A.; King, S.S.E.; Vogt, R.J.; Xenopoulos, M.A. Variation in particulate C:N:P stoichiometry across the Lake Erie watershed from tributaries to its outflow. Limnol. Oceanogr. 2017. [Google Scholar] [CrossRef]
  12. Collins, S.M.; Oliver, S.K.; LaPierre, J.-F.; Stanley, E.H.; Jones, J.R.; Wagner, T.; Soranno, P.A. Lake nutrient stoichiometry is less predictable than nutrient concentrations at regional and sub-continental scales. Ecol. Appl. 2017, 27, 1529–1540. [Google Scholar] [CrossRef]
  13. Powers, S.M.; Tank, J.L.; Robertson, D.M. Control of nitrogen and phosphorus transport by reservoirs in agricultural landscapes. Biogeochemistry 2015, 124, 417–439. [Google Scholar] [CrossRef]
  14. Michalak, A.M.; Anderson, E.J.; Beletsky, D.; Boland, S.; Bosch, N.S.; Bridgeman, T.B.; Chaffin, J.D.; Cho, K.; Confesor, R.; Daloglu, I.; et al. Record-setting algal bloom in Lake Erie caused by agricultural and meteorological trends consistent with expected future conditions. PNAS 2013, 100, 6448–6452. [Google Scholar] [CrossRef] [PubMed]
  15. Saaltink, R.; der Velde, Y.; Dekker, S.C.; Lyon, S.W.; Dahlke, H.E. Societal, land cover, and climatic controls on river nutrient flows into the Baltic Sea. J. Hydrol. Reg. Stud. 2014, 1, 44–56. [Google Scholar] [CrossRef]
  16. Yates, A.G.; Culp, J.M.; Chambers, P.A. Estimating nutrient production from human activities in sub catchments of the Red River, Manitoba. J. Great Lakes Res. 2012, 38, 106–114. [Google Scholar] [CrossRef]
  17. Yates, C.A.; Johnes, P.J. Nitrogen speciation and phosphorus fractionation dynamics in a lowland Chalk catchment. Sci. Total Environ. 2013, 444, 466–479. [Google Scholar] [CrossRef]
  18. Derksen, C.; Brown, R. Spring snow cover extent reductions in the 2008–2012 period exceeding climate model projections. Geophys. Res. Lett. 2012, 39. [Google Scholar] [CrossRef]
  19. DeBeer, C.M.; Wheater, H.S.; Carey, S.K.; Chun, K.P. Recent climatic, cryospheric, and hydrological changes over the interior of western Canada: A review and synthesis. Hydrol. Earth Syst. Sci. 2016, 20, 1573–1598. [Google Scholar] [CrossRef]
  20. Dumanski, S.; Pomeroy, J.W.; Westbrook, C.J. Hydrological regime changes in a Canadian Prairie basin. Hydrol. Proc. 2015, 29, 3893–3904. [Google Scholar] [CrossRef]
  21. Vincent, L.A.; Zhang, X.; Brown, R.; Feng, Y.; Mekis, E.J.; Milewska, E.; Wan, H.; Wang, X.L. Observed trends in Canada’s climate and influence of low-frequency variability modes. J. Clim. 2015, 28, 4545–4560. [Google Scholar] [CrossRef]
  22. McDowell, R.W.; Elkin, K.R.; Kleinman, J.A. Temperature and nitrogen effects on phosphorus uptake by agricultural stream-bed sediments. J. Environ. Qual. 2017, 46, 295–301. [Google Scholar] [CrossRef] [PubMed]
  23. Green, M.B.; Nieber, J.B.; Johnson, G.; Magner, J.; Schaefer, B. Flow path influence on a N:P ratio in two headwater streams: A paired watershed study. J. Geophys. Res. 2007, 112, G03015. [Google Scholar] [CrossRef]
  24. Howarth, R.W.; Swaney, D.P.; Boyer, E.W.; Marino, R.; Jaworski, N.; Goodale, C. The influence of climate on average nitrogen export from large watersheds in the North-eastern United States. Biogeochemistry 2006, 79, 163–186. [Google Scholar] [CrossRef]
  25. Arbuckle, K.E.; Downing, J.A. The influence of watershed land use on lake N:P in a predominantly agricultural landscape. Limnol. Oceanogr. 2001, 46, 970–975. [Google Scholar] [CrossRef]
  26. Bunting, L.; Leavitt, P.R.; Simpson, G.L.; Wissel, B.; Laird, K.R.; Cumming, B.F.; Amand, A.; Engstrom, D.R. Increased variability and sudden ecosystem state change in Lake Winnipeg, Canada, caused by 20th century agriculture. Limnol. Oceaongr. 2016, 61, 2090–2107. [Google Scholar] [CrossRef]
  27. Paerl, H.A.; Scott, J.T.; McCarthy, M.J.; Newell, S.E.; Gardner, W.S.; Havens, K.E.; Hoffman, D.K.; Wilhelm, S.W.; Wurtsbaugh, W.A. It takes two to tango: When and where duel nutrient (N and P) reductions are needed to protect lakes and downstream ecosystems. Environ. Sci. Technol. 2016, 50, 10805–10813. [Google Scholar] [CrossRef] [PubMed]
Figure 1. Lake Winnipeg Basin, Canada, showing the seven sub-catchments (drainage areas between 65 and 626 km2) with grey areas representing the drainage areas. Watersheds are numbered according to Table 1.
Proceedings 02 00183 g001
Figure 2. (a) seasonal TN:TP load ratios (b) seasonal DIN:SRP load ratios (c) seasonal PN:PP load ratios and (d) annual PN:PP load ratios for seven streams in the Red River Valley, Manitoba, Canada. Boxplots include mean (circle), median (line), interquartile range (box), and whiskers. Letters (a–d) above bars identify seasonal means that differ (p < 0.05) within a year; symbols (*, #) below bars identify seasonal means that differ (p < 0.05) between years. SN = snowmelt, SP = spring, SU = summer, and F = Fall (with dates identified in the methods section).
Proceedings 02 00183 g002
Table 1. Characteristics of seven sub-watersheds in the Red River Valley, Manitoba, Canada including site location, the nearest Water Survey of Canada (WSC) hydrometric gauge station, and catchment area. Livestock density is reported as nutrient units (NU) per square kilometer.
Site NumberSub-Watershed NameWSCArea (km2)Fertilizer P (kg/ha/year)Fertilizer N (kg/ha/year)Crop Cover (%)Livestock (NU/km2)
1West Branch La Salle05OG0086526.965.78725.1
2Elm05OG00560210.828.07015.9
3Tobacco05OF02435018.0 61.37122.1
4Buffalo05OC01962617.742.45918.8
8Hespeler05OC01618017.352.06923.3
9Shannon05OF01427917.836.96521.9
11Big Coulee05OG0088425.270.29224.3
Table 2. Annual and seasonal averages (as well as standard error) for discharge (m3/s), N:P concentrations ratios and N:P load ratios for seven streams in southern Manitoba. Bold = significant difference (p < 0.05) in means between years; a–d = significant difference (p < 0.05) among seasons within a year.
VariableYearAnnualSnowmeltSpringSummerFall
MeanSEMeanSEMeanSEMeanSEMeanSE
Discharge20132.300.41115.3 a2.413.50 b0.6500.709 c0.5820.050 d0.00
20140.9010.1196.80 a0.7600.705 b0.0800.400 c0.1200.040 d0.00
Concentration Ratios
TN:TP20136.640.3105.960.3666.210.4126.450.4027.110.499
20146.700.2286.400.3437.110.6397.230.5446.060.715
DIN:SRP20133.430.2395.360.3483.870.2382.400.2082.710.188
20144.030.3495.150.2553.640.1992.240.1983.090.244
PN:PP201311.52.7711.41.3312.51.0211.60.98210.62.65
201410.92.5012.20.66810.40.71510.50.78811.64.32
Load Ratios
TN:TP20136.240.1443.81 a0.0243.54 a0.0846.97 b0.0769.50 c0.088
20145.340.1854.29 a0.0844.02 a0.1446.86 b0.1053.85 c0.112
DIN:SRP20132.480.1064.96 a0.0882.96 b0.1142.11 b0.1070.474 c0.073
20142.670.1845.94 a0.1093.22 b0.2111.66 b0.1181.25 c0.154
PN:PP20132.570.1122.83 a0.1003.95 b0.0883.38 b0.0760.132 c0.059
20144.640.1034.65 a0.0562.76 b0.0237.82 c0.0493.32 b0.086
Table 3. Results of two factor analysis of co-variance of total, dissolved, and particulate N and P, concentrations (mg/L), loads (Tonnes) and N: P ratios. (All analyses are based on annual data). Bold = statistical significant difference at p < 0.05.
ResponseConcentrationsLoads
DFFpDFFp
TN
    Season3100.003120.00
    Year12.000.1612.60.10
    Crop (co-variate)10.310.8718.20.00
DIN
    Season39.40.003190.00
    Year18.50.0011.60.20
    Crop (co-variate)14.20.0219.80.00
PN
    Season32.70.0837.50.00
    Year12.20.0718.80.00
    Crop (co-variate)12.40.0712.00.07
TP
    Season33.40.013150.00
    Year10.410.6512.60.08
    Crop (co-variate)19.30.0017.80.01
SRP
    Season3100.003130.00
    Year13.60.0110.330.57
    Crop (co-variate)15.80.0017.80.01
PP
    Season32.30.0834.50.02
    Year12.10.1413.70.03
    Crop (co-variate)10.040.8411.90.08
TN: TP
    Season31.80.1236.80.00
    Year10.920.3410.740.41
    Crop (co-variate)11.00.1816.40.02
DIN: SRP
    Season34.70.0536.10.00
    Year12.20.0810.890.35
    Crop (co-variate)11.10.2215.70.02
PN: PP
    Season32.80.0635.40.00
    Year11.30.2417.90.01
    Crop (co-variate)10.010.9310.00.96
Publisher’s Note: MDPI stays neutral with regard to jurisdictional claims in published maps and institutional affiliations.

