1. Introduction
There has been a large increase in interest in measures of systemic risk in the since the last financial crisis. A few of the new measures include Mahalanobis Distance, the SRISK Index, the Absorption Ratio (AR), and the Information Processing Ratio (R/C) among many others. Despite their disparate origins the AR and R/C share important similarities. These similarities and the potential for joint use of these measures will be the focus of this paper.
2. Materials and Methods
The Kritzman et al. 2010 absorption ratio is calculated as seen in formula 1.
where,
AR = Absorption Ratio
N = number of assets
n = number of eigenvectors used
= variance of the i-th eigenvector
= variance of the j-th asset.
Kritzman et al. 2010 examined the variance of returns of 51 industries that make up the MSCI index from 1 January 1998 through 31 January 2010. They began by calculating an eigenvector that explains the largest proportion of the assets’ total variance. They then proceeded to calculate another orthogonal eigenvector that explains the next greatest proportion of the assets’ total variance. This process is continued for a total of ten eigenvectors as described in [
1].
The entropic yield curve was derived in [
2] by blending concepts from information theory with traditional financial ideas. “Information whether it is communicated through space as traditionally imagined or through time can be lost, corrupted, or otherwise misprocessed. An economy’s efficiency in processing and communicating information is related to the economy’s interest rates through the following entropic yield curve equation” [
2]:
where from (Burnashev 1976):
The Implied Information Processing Rate (IIPR) or (R/C) can be estimated by matching the entropic yield curve to the observed yields in the markets and then solving for IIPR
3. Results
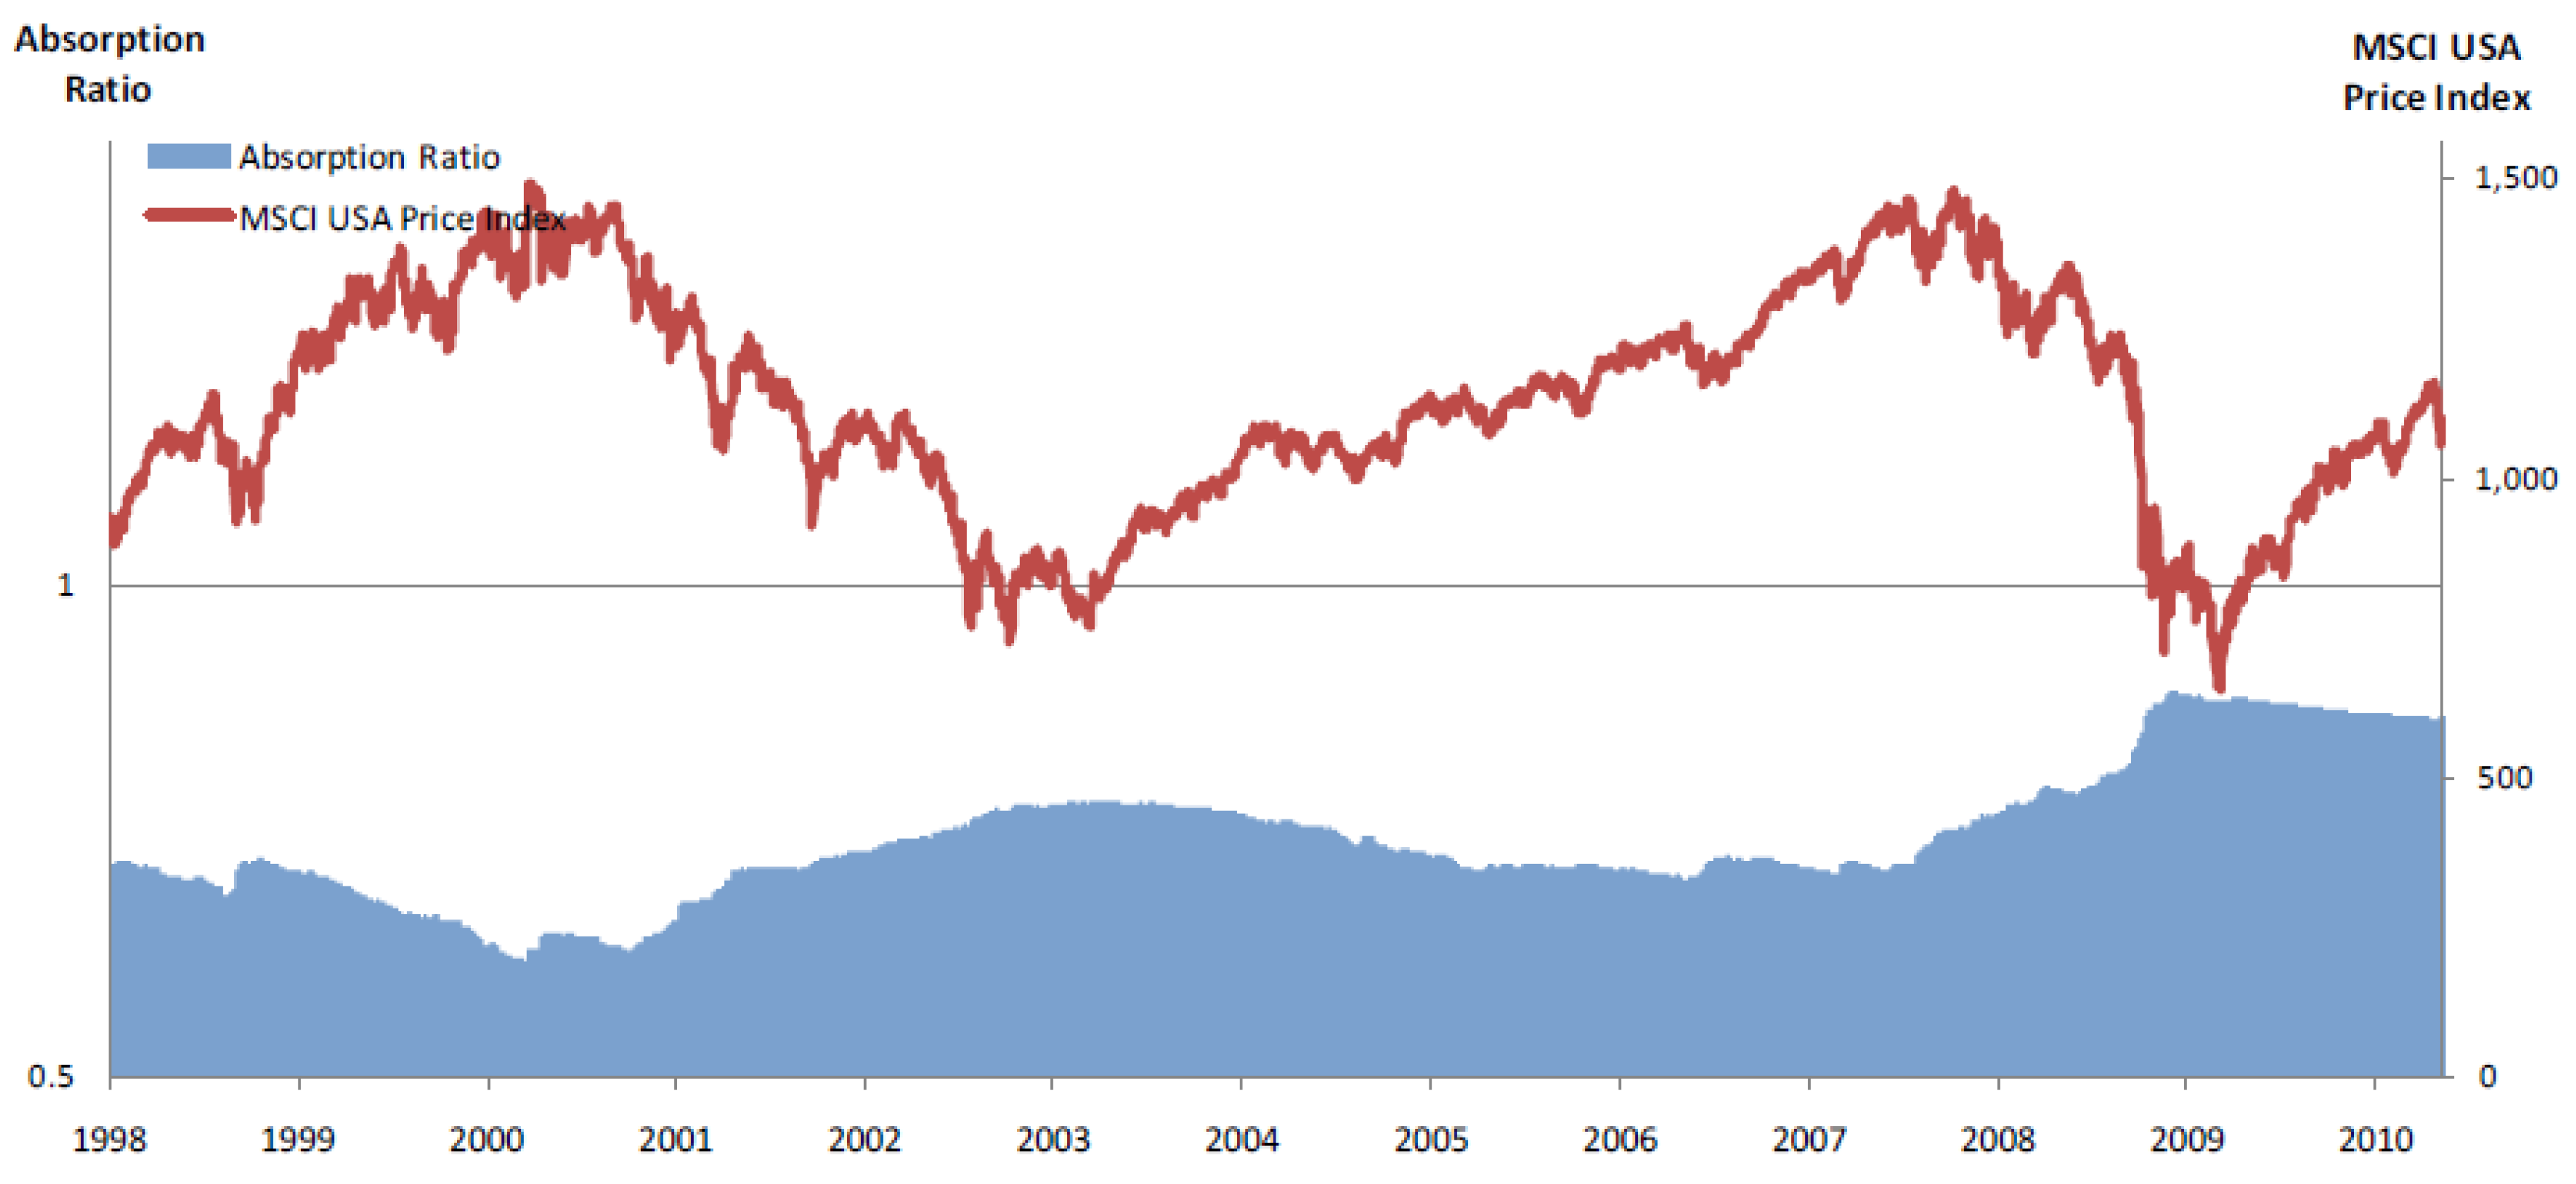
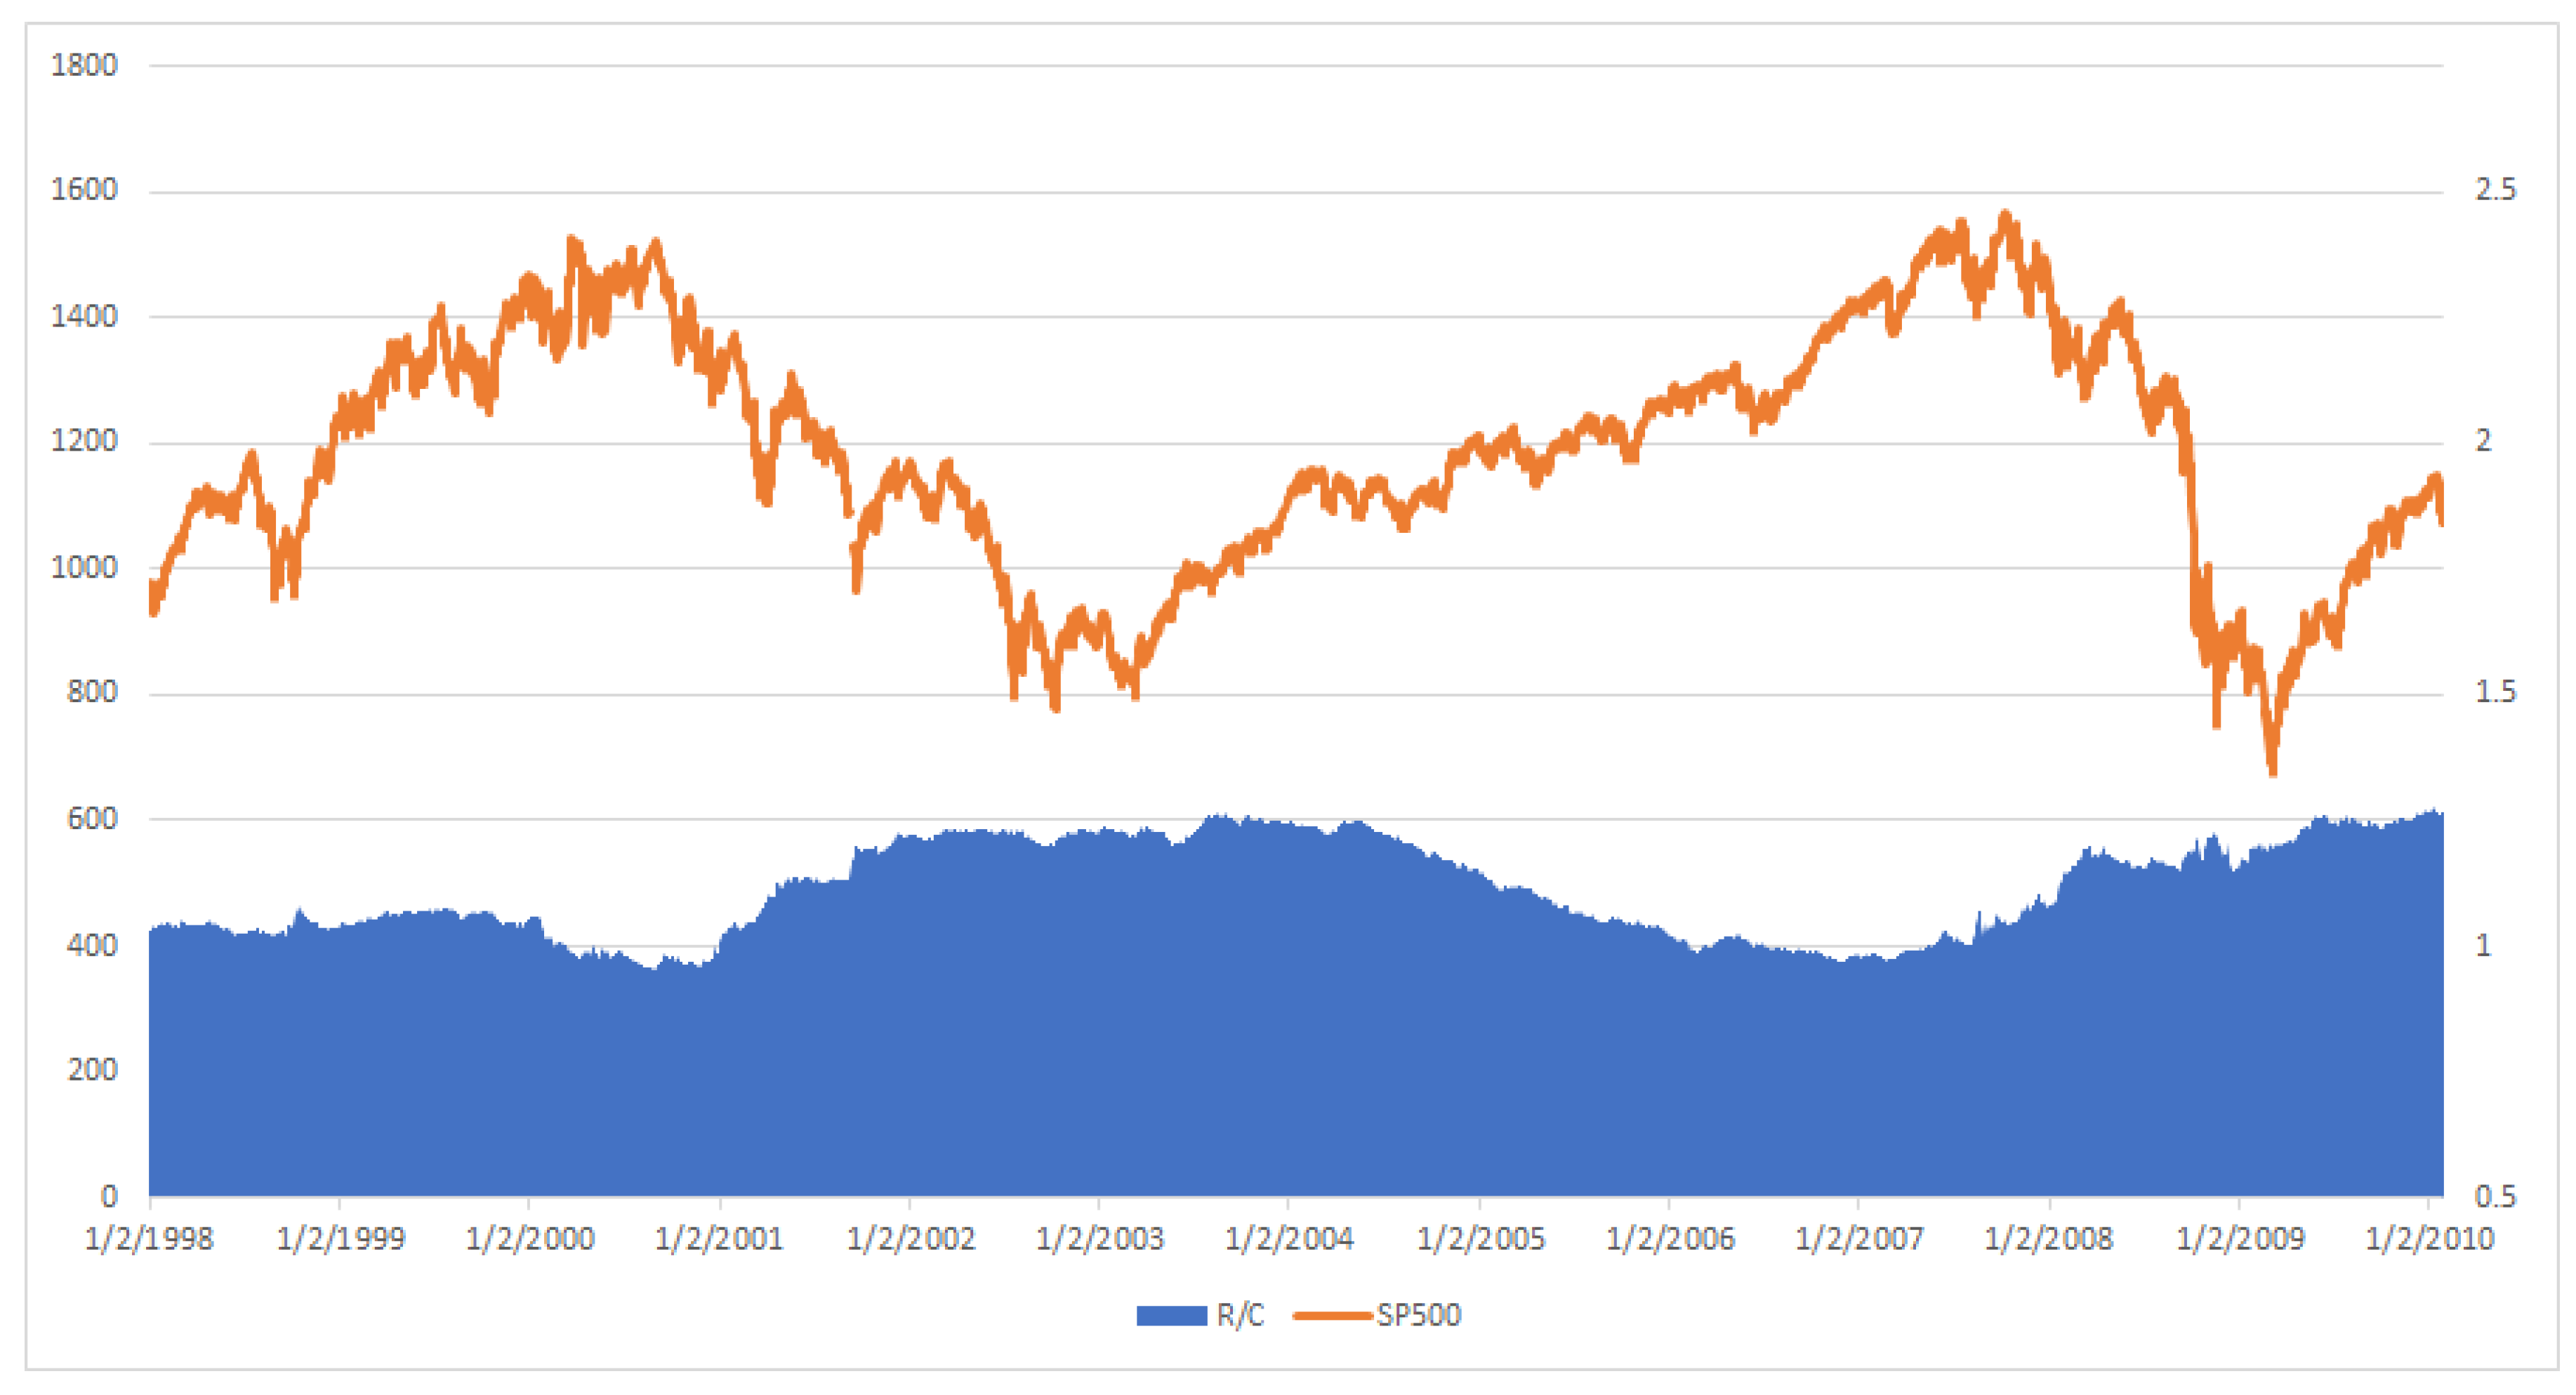
The absorption ratio (AR) from 1 January 1998 through 31 January 2010 is plotted against the MSCI index in
Figure 1 (Reprinted in accordance of the copyright permissions stated on page 1 in [
1]). This may be compared against
Figure 2 in which the implied information processing rate R/C is plotted against the SP500 index. (Note the SP500 and MCSI indices are largely composed of the same components and exhibit extremely similar behavior as seen in the figures below. However historical values of the SP500 index are more widely and freely available). Immediately apparent is the similar countercyclical nature of both the AR and R/C against the market measures. The variables AR and R/C seem to rise and fall largely in synchronicity over the two financial cycles represented in the studied time period. One difference is AR seems to have a trend component in addition to its cycle over the time period, while R/C is trend stationary over its cycle.
4. Discussion
(Kritzman et al. 2010) [
1] briefly mentions the appearance of an inverse relationship between the absorption ratio and stock prices. However, the focus the 2010 study was not this countercyclical relationship but rather the association between spikes in the AR and market downturns. They explain that as AR rapidly rises markets become more tightly coupled. The strong coupling of financial markets makes them more susceptible to shocks. This greater susceptibility to shocks means the probability of a large market drop is more likely when AR spikes upward is high.
The importance of volatility spikes in R/C in association with market downturns was studied in [
2]. While the countercyclical structure of R/C compared to the SP500 was the focus of [
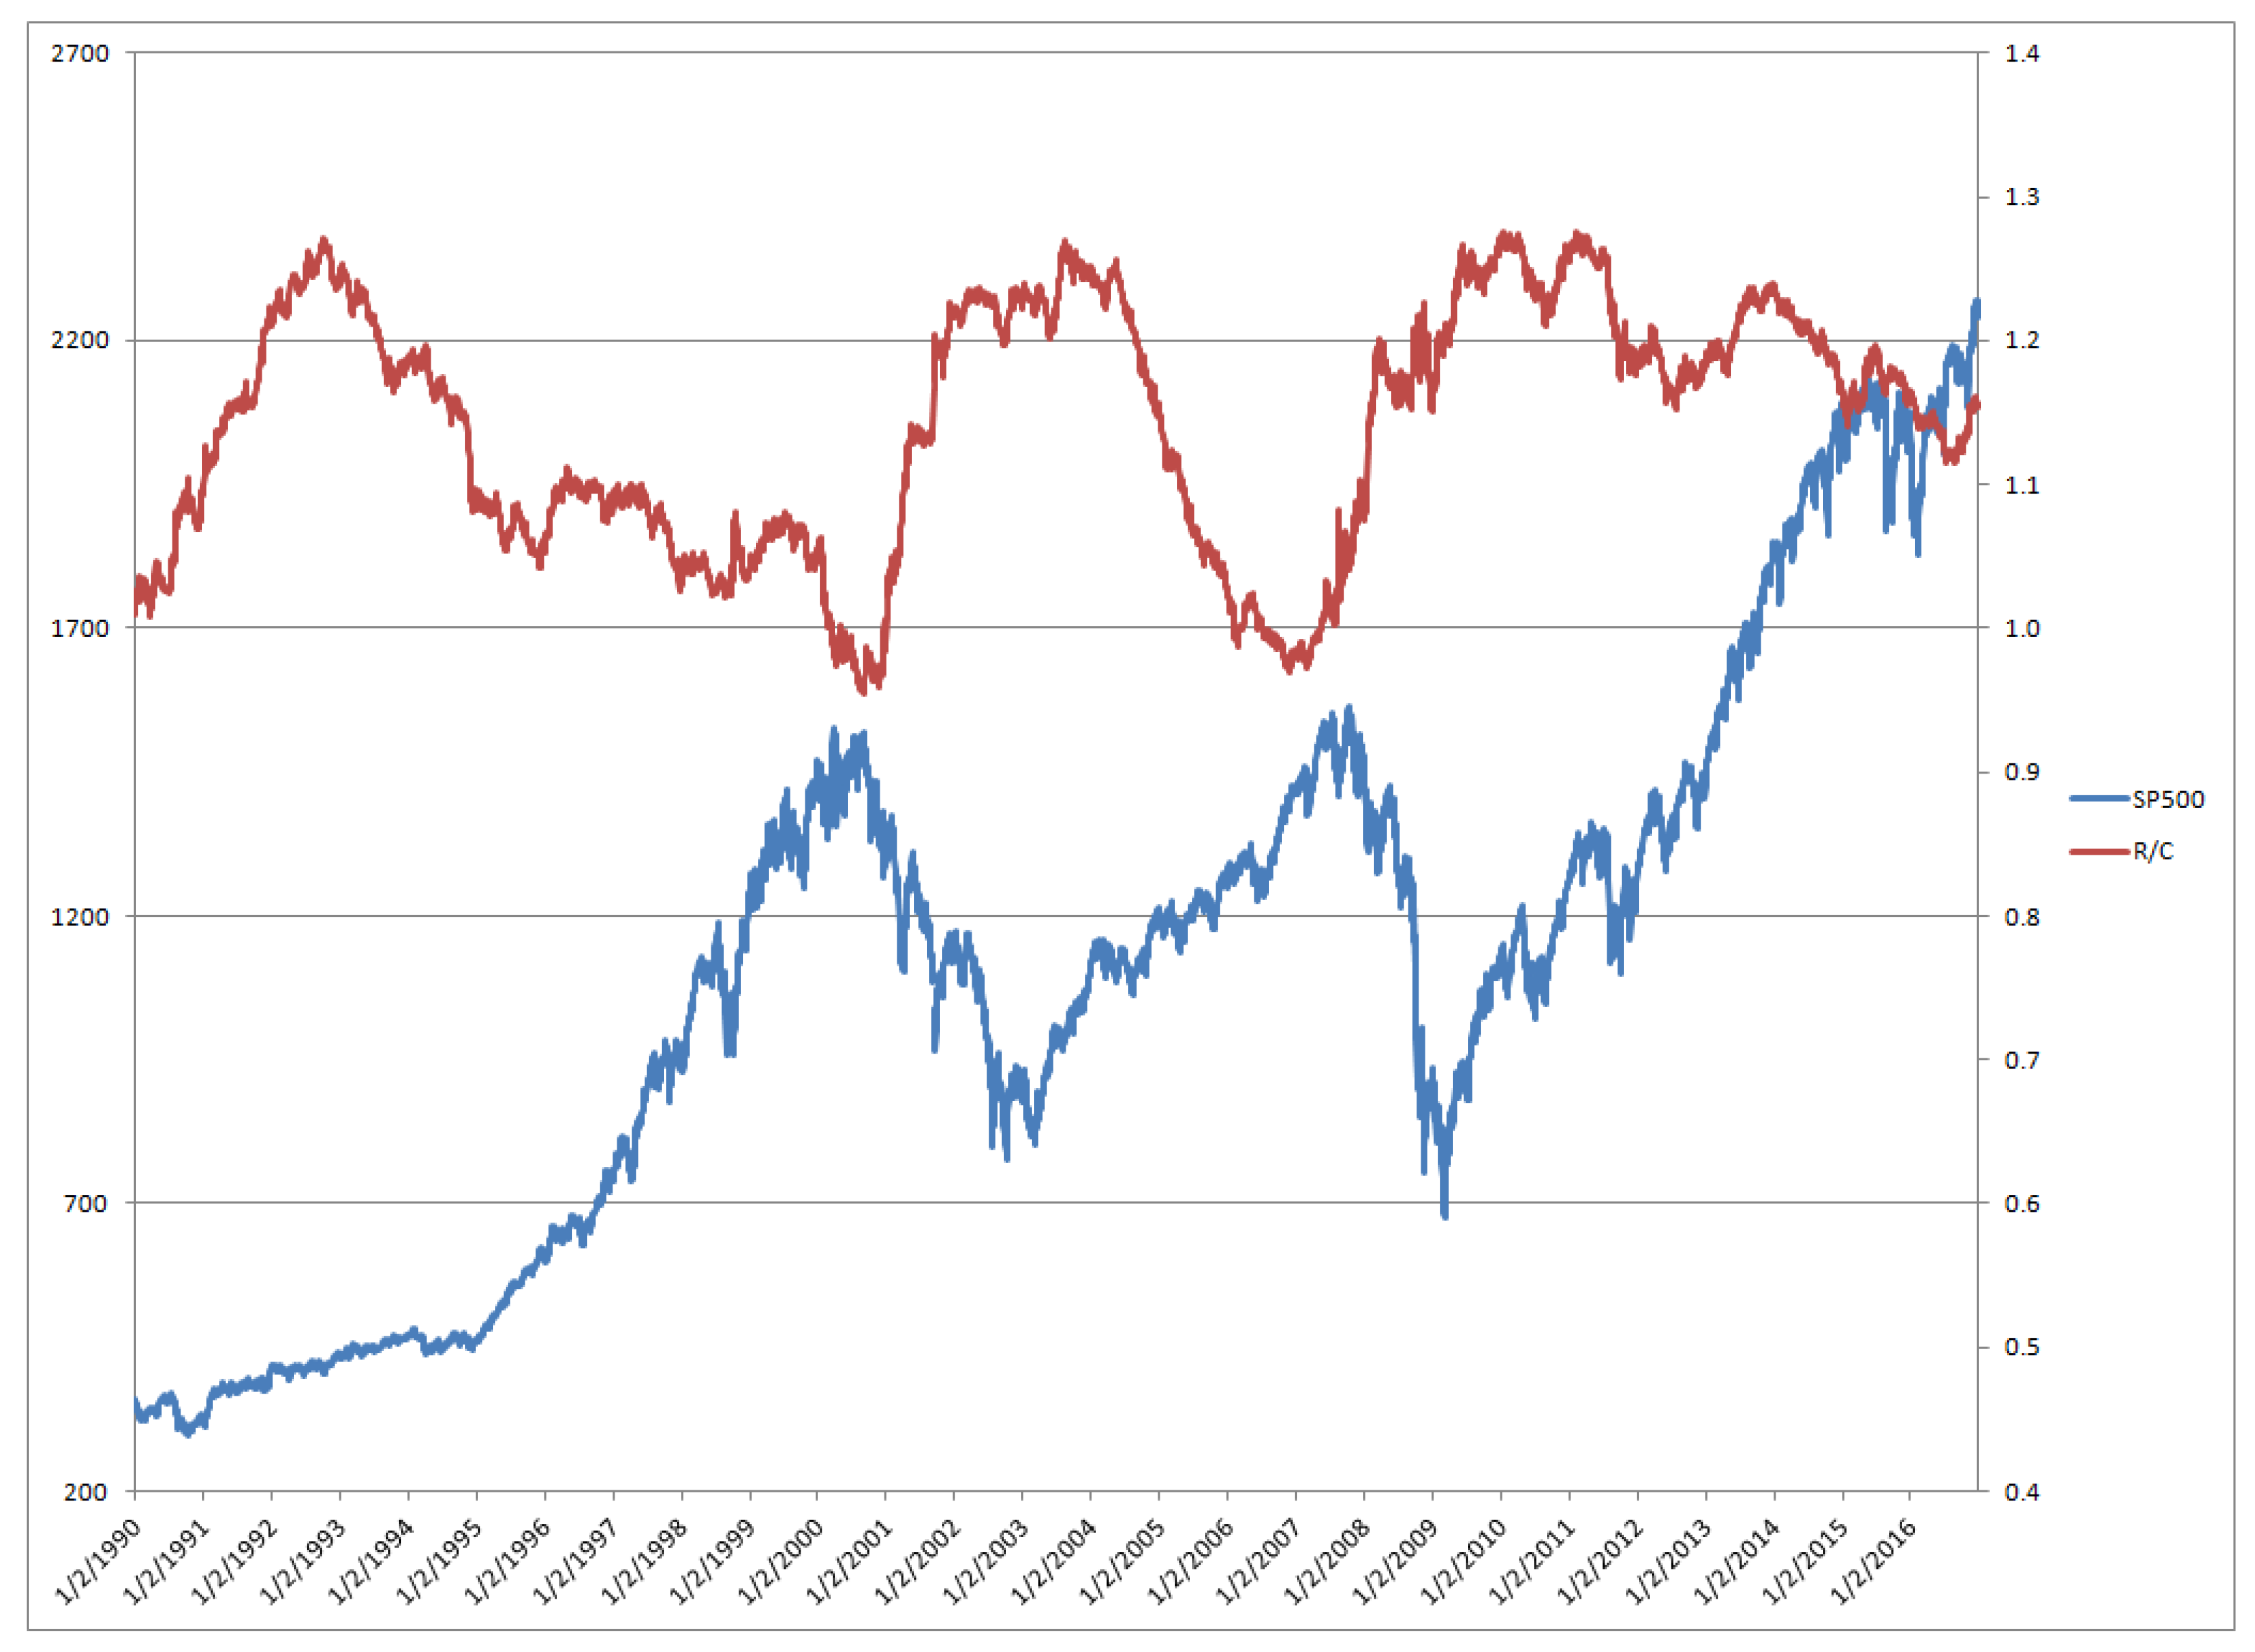
3]. In the latter study the values of the level of R/C over the information cycle were shown to help predict market peaks and troughs. In
Figure 3 below R/C is plotted against SP500 from 1990 to 2016. When R/C hits its stationary peaks at 1.27 the SP500 is at its bottom. Similarly, when R/C is at its minimums of 0.95 the SP 500 is at its peaks.
Thus R/C provides a potential explanation of the AR trended cycle. As described in [
3] high levels R/C correspond to periods when the economy is fully organized around a new technology and is ready to begin effectively “mining” the amply available data. At higher levels of R/C the volatility of R/C was seen to be lower.
Similarly, AR as seen in
Figure 1 experiences higher levels near the same market lows as R/C. As stated by [
1] it is the spikes in AR that signify increased market downturn risk. High levels but low volatility of AR may represent markets which are relatively tightly coupled but less prone to damaging shocks. For both the absorption ratio and the information processing ratio important information about systemic financial market risks are given by both the level and variance of the measures.
Additionally, despite their similar behavior over financial cycles these measures are constructed from widely different foundations. AR is completely derived from equity data. R/C on the other hand is computed from the entropic yield curve equation using only treasury yield data. The use of these variables in concert is of obvious potential value.
The measures may reinforce confidence in risk assessment assumptions when in agreement. When in disagreement the measures may point to the potential of arbitrage opportunities. These opportunities may include capital structure arbitrage type strategies.


