Proceeding Paper

Sustainability Enhancement of a Biomass Boiler through Exergy Analysis †

Applied Energy Research Laboratory (AERL), Department of Mechanical Engineering, College of Engineering, University of Idaho, 875 Perimeter Dr., Moscow, ID 83844-0902, USA
*
Author to whom correspondence should be addressed.
Presented at the 4th International Electronic Conference on Entropy and Its Applications, 21 November–1 December 2017; Available online: http://sciforum.net/conference/ecea-4
Proceedings 2018, 2(4), 159; https://doi.org/10.3390/ecea-4-05012
Published: 20 November 2017

Abstract

:
Investigations on exergy resources are important from the point of energy sustainability. In the presented study, an energy and exergy analysis of the operating biomass and natural gas boilers at the University of Idaho (UI) district energy plant is conducted. Exergy flows through the components of the steam cycle associated with the biomass boiler are quantified to identify major sources of exergy destruction in the district heating system. It is found that the biomass boiler has reduced energy and exergy efficiency compared to the natural gas boilers. Thermal efficiency varies from 76 to 85%, while exergy efficiency is significantly lower at 24 to 27% for all the boilers. Exergy accounting reveals that the biomass boiler and furnace account for the greatest exergy destruction, at approximately 68% of the exergy provided by the fuel. Steam use on campus represents about 6% of exergy losses while the pressure reducer is responsible for 4%.

1. Introduction

Fossil fuels such as coal, oil, and natural gas are by far the largest sources of energy on the planet. While there is much debate on how long fossil fuels will be available in sufficient quantities, it is known that the greenhouse gas (GHG) emissions created after combustion have negative impacts on the environment and GHG concentrations have increased substantially since the pre-industrial era [1]. Research into sustainable energy generation is growing, however development is not yet at a point where fossil fuels can be replaced fully. For a system to be completely sustainable it must also be reversible, however all real processes are inherently irreversible and thus must impact the environment. Ultimately no activity can be perfectly sustainable, but it is possible to approach sustainability on a timespan that can be benefit both current and future generations [2].
District energy (DE) has been shown to be an energy efficient means of providing heating, cooling, and electricity to multiple buildings with reduced environmental impacts, such as CO2 production, compared to more conventional systems [3,4]. Energy can be from a variety of sources such as fossil fuels, geothermal, solar, or biomass. DE systems can be more economically feasible based on the proximity to these sources and Lake, et al. have reviewed case studies investigating identification, energy sources, and design considerations of DE systems [5]. Older district energy systems commonly use low pressure steam; however newer designs produce hot and/or chilled water in a central location. This makes them ideal for scenarios such as industrial processes with excess waste heat or high population density locations where individual heating and cooling equipment can be eliminated.
Exergy accounting can provide a means to measure the potential impacts on the environment from an energy source [6]. Exergy is commonly considered to be the maximum work that can obtained from a system within a specified reference environment, or the quality of the energy source [7,8,9]. Unlike energy, exergy is not a conserved quantity and thus can account for inputs, losses, and wastes of a process [10]. Links between energy, exergy, and sustainable development have been made by Dincer and Rosen [6,11,12,13,14] and suggest that exergy might provide a basis for measuring the potential an energy source has of impacting the environment. Kallert et al. have investigated the advantages of using exergy methods to improve the efficiency of small scale DE networks utilizing different fuel sources [15].
The main University of Idaho (UI) campus in Moscow, Idaho, USA utilizes a DE system for heating and cooling needs. Steam requirements are met using a biomass fueled boiler, together with three supplementary natural gas boilers. Nearly all of the steam produced on campus is supplied by the biomass boiler, resulting in over $1 M in saving annually compared to natural gas [16]. Boilers play a critical role in any district energy system and comprise a significant portion of U.S. energy consumption [17]. Because of this, it is important that fuel is consumed in an efficient and sustainable manner to minimize the production of greenhouse gases. Efforts to identify exergy losses commonly focus on boilers without including potential losses from the rest of the steam cycle. Methods to estimate exergy losses in steam boilers have been developed by Behbahaninia et al. to identify primary sources of exergy destruction [18]. Terhan et al. conducted a study to investigate sources of exergy losses in natural gas boilers [19]. The energy and exergy losses through the flue gas emphasize the importance of breaking down exergy flows through the entire boiler and steam network to locate losses. Da Silva et al. have identified potential improvements to reduce exergy losses in a coal fired steam generator [20]. Gürtük, et al. investigated sources of exergy destruction in a circulating fluidized bed boiler cogeneration (CHP) system [21]. They also determined that the exergy efficiency of the boiler was low when compared to other boilers in similar configurations.
In this paper a case study is developed to investigate the sustainability and boiler evolution of the district energy plant and quantify the primary exergy losses in the biomass boiler steam cycle at the main University of Idaho campus energy plant. Accounting for exergy flows and destruction rates provides a means to assess how efficient the use of a resource is and can be a measure of the potential for causing environmental harm through waste emissions [22,23].

2. Methods

To begin the exergy analysis, the reference, or “dead”, state must be defined. Exergy is always evaluated with respect to a dead state since useable work requires a difference between the states of the system and the surrounding environment [24]. The reference state is often determined by the ambient weather conditions at the time of the analysis. The specific physical exergy for each flow state, which is a measure of the maximum work that can be generated from the flow while interacting with the dead state, can be expressed as
ψ = h o u t h 0 T 0 ( s o u t s 0 ) + V o u t 2 2 + g z o u t
The exergy destruction rate of a steady state system can be formulated as
( X ˙ Q i n X ˙ Q o u t ) + ( X ˙ W i n X ˙ W o u t ) + m ˙ ( ψ i n ψ o u t ) X ˙ d e s = d X s y s d t
The exergy rate associated with work is defined as
X ˙ W = W ˙
The exergy rate associated with heat transfer can be defined as follows, where Tb is the system boundary absolute temperature where heat is being transferred
X ˙ Q = Q ˙ ( 1 T o T b )
The exergy rate provided by the fuel input to the furnace can be approximated as the average higher heating value of the wood chip fuel multiplied by the mass flow rate
X ˙ f u e l = m ˙ f u e l H H V f u e l
In general terms, the exergy efficiency is defined as
η X = p r o d u c t   e x e r g y   o u t p u t e x e r g y   i n p u t
An exergy efficiency of 100% would represent a completely reversible, and thus sustainable process, whereas an efficiency of 0% would correspond to the opposite, since the resource is completely without anything useful being accomplished [25]. The exergy efficiency can be written as the ratio of exergy transfer between the hot and cold fluids as follows for heat exchangers such as boilers, where m ˙ c o l d and m ˙ h o t are defined as the mass flow rate of feed water and flue gases in this analysis, respectively
η X = m ˙ c o l d ( ψ o u t ψ i n ) c o l d m ˙ h o t ( ψ o u t ψ i n ) h o t

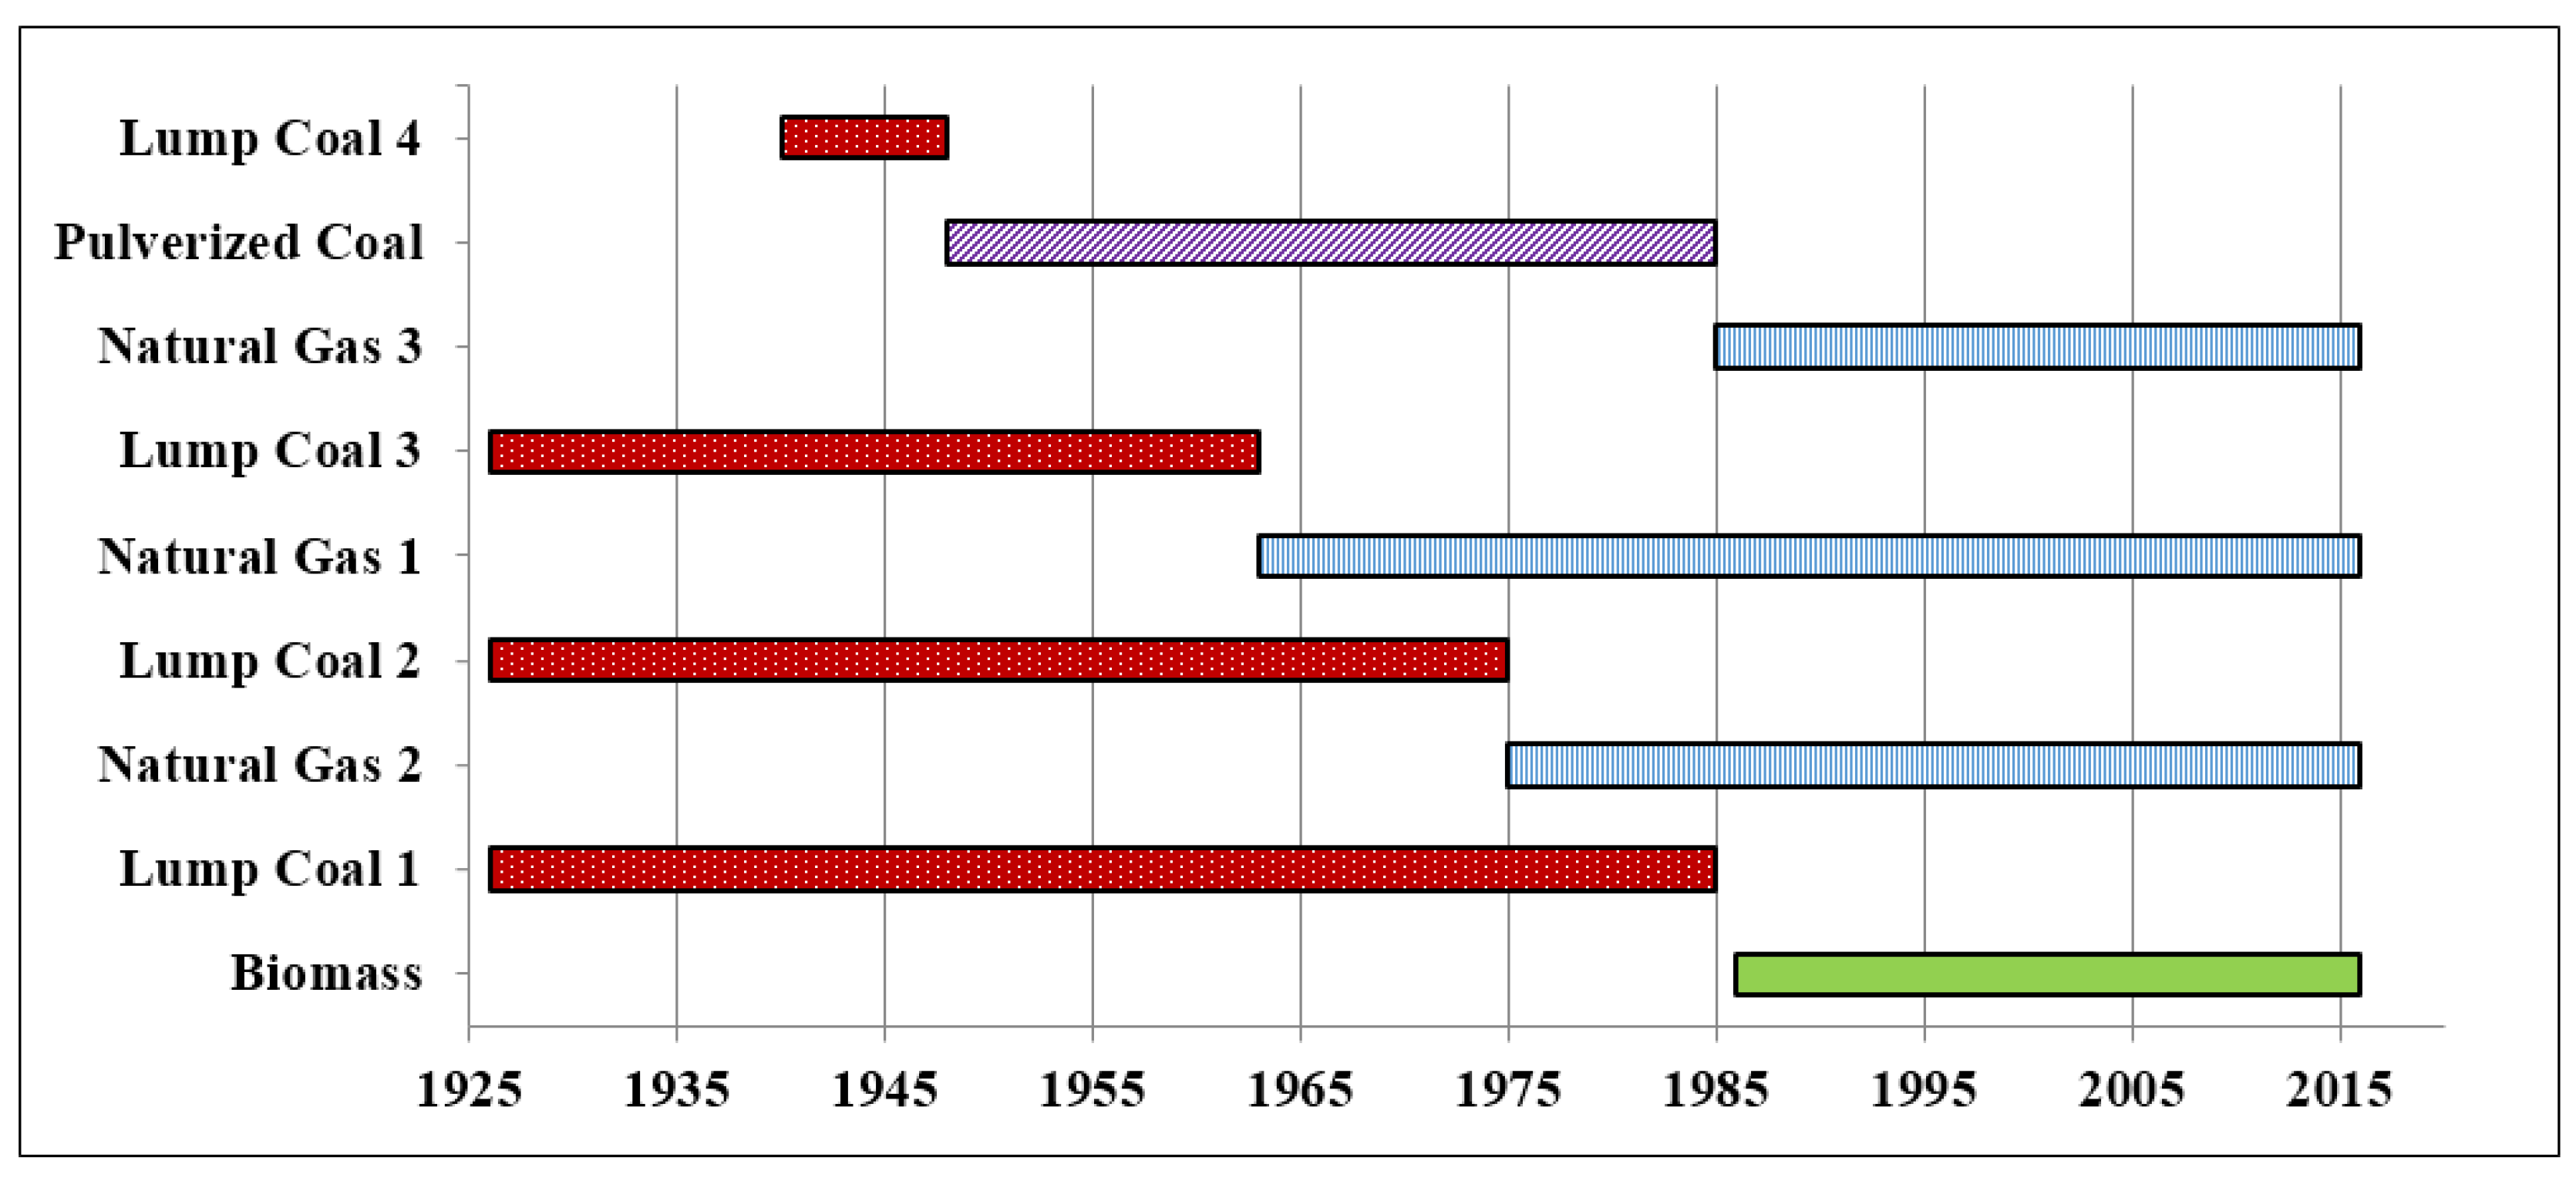
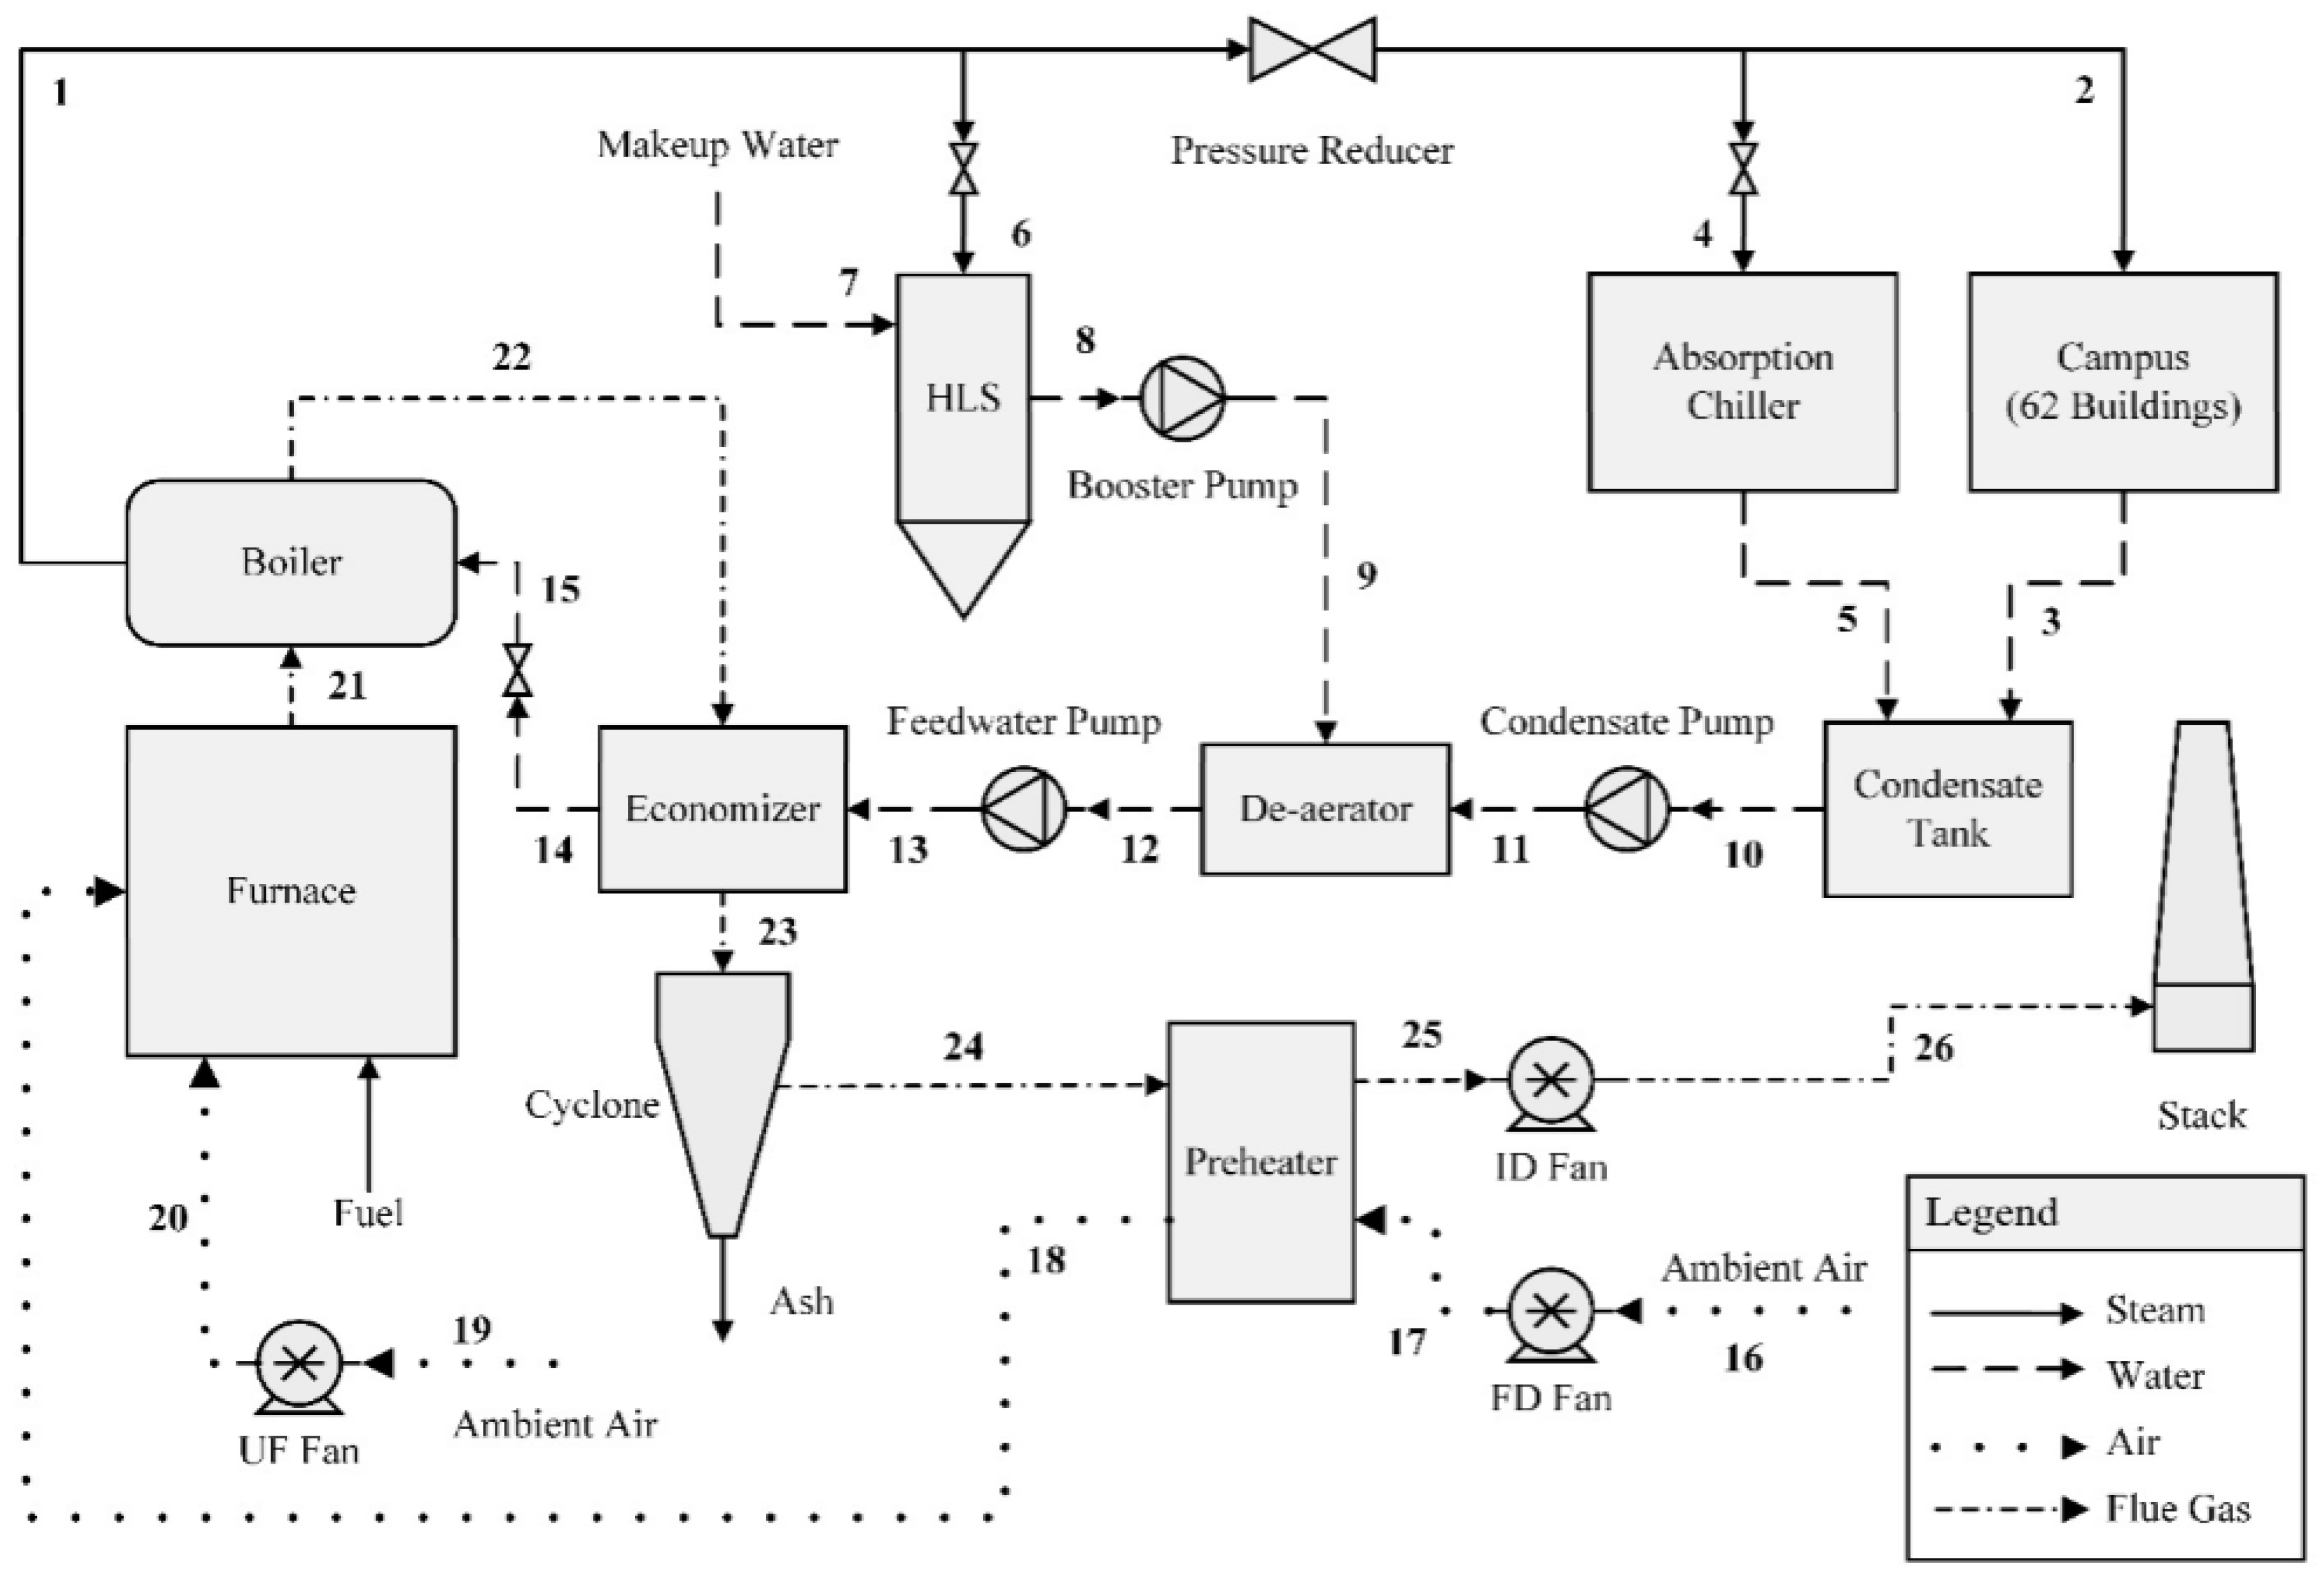
3. Case Study: University of Idaho
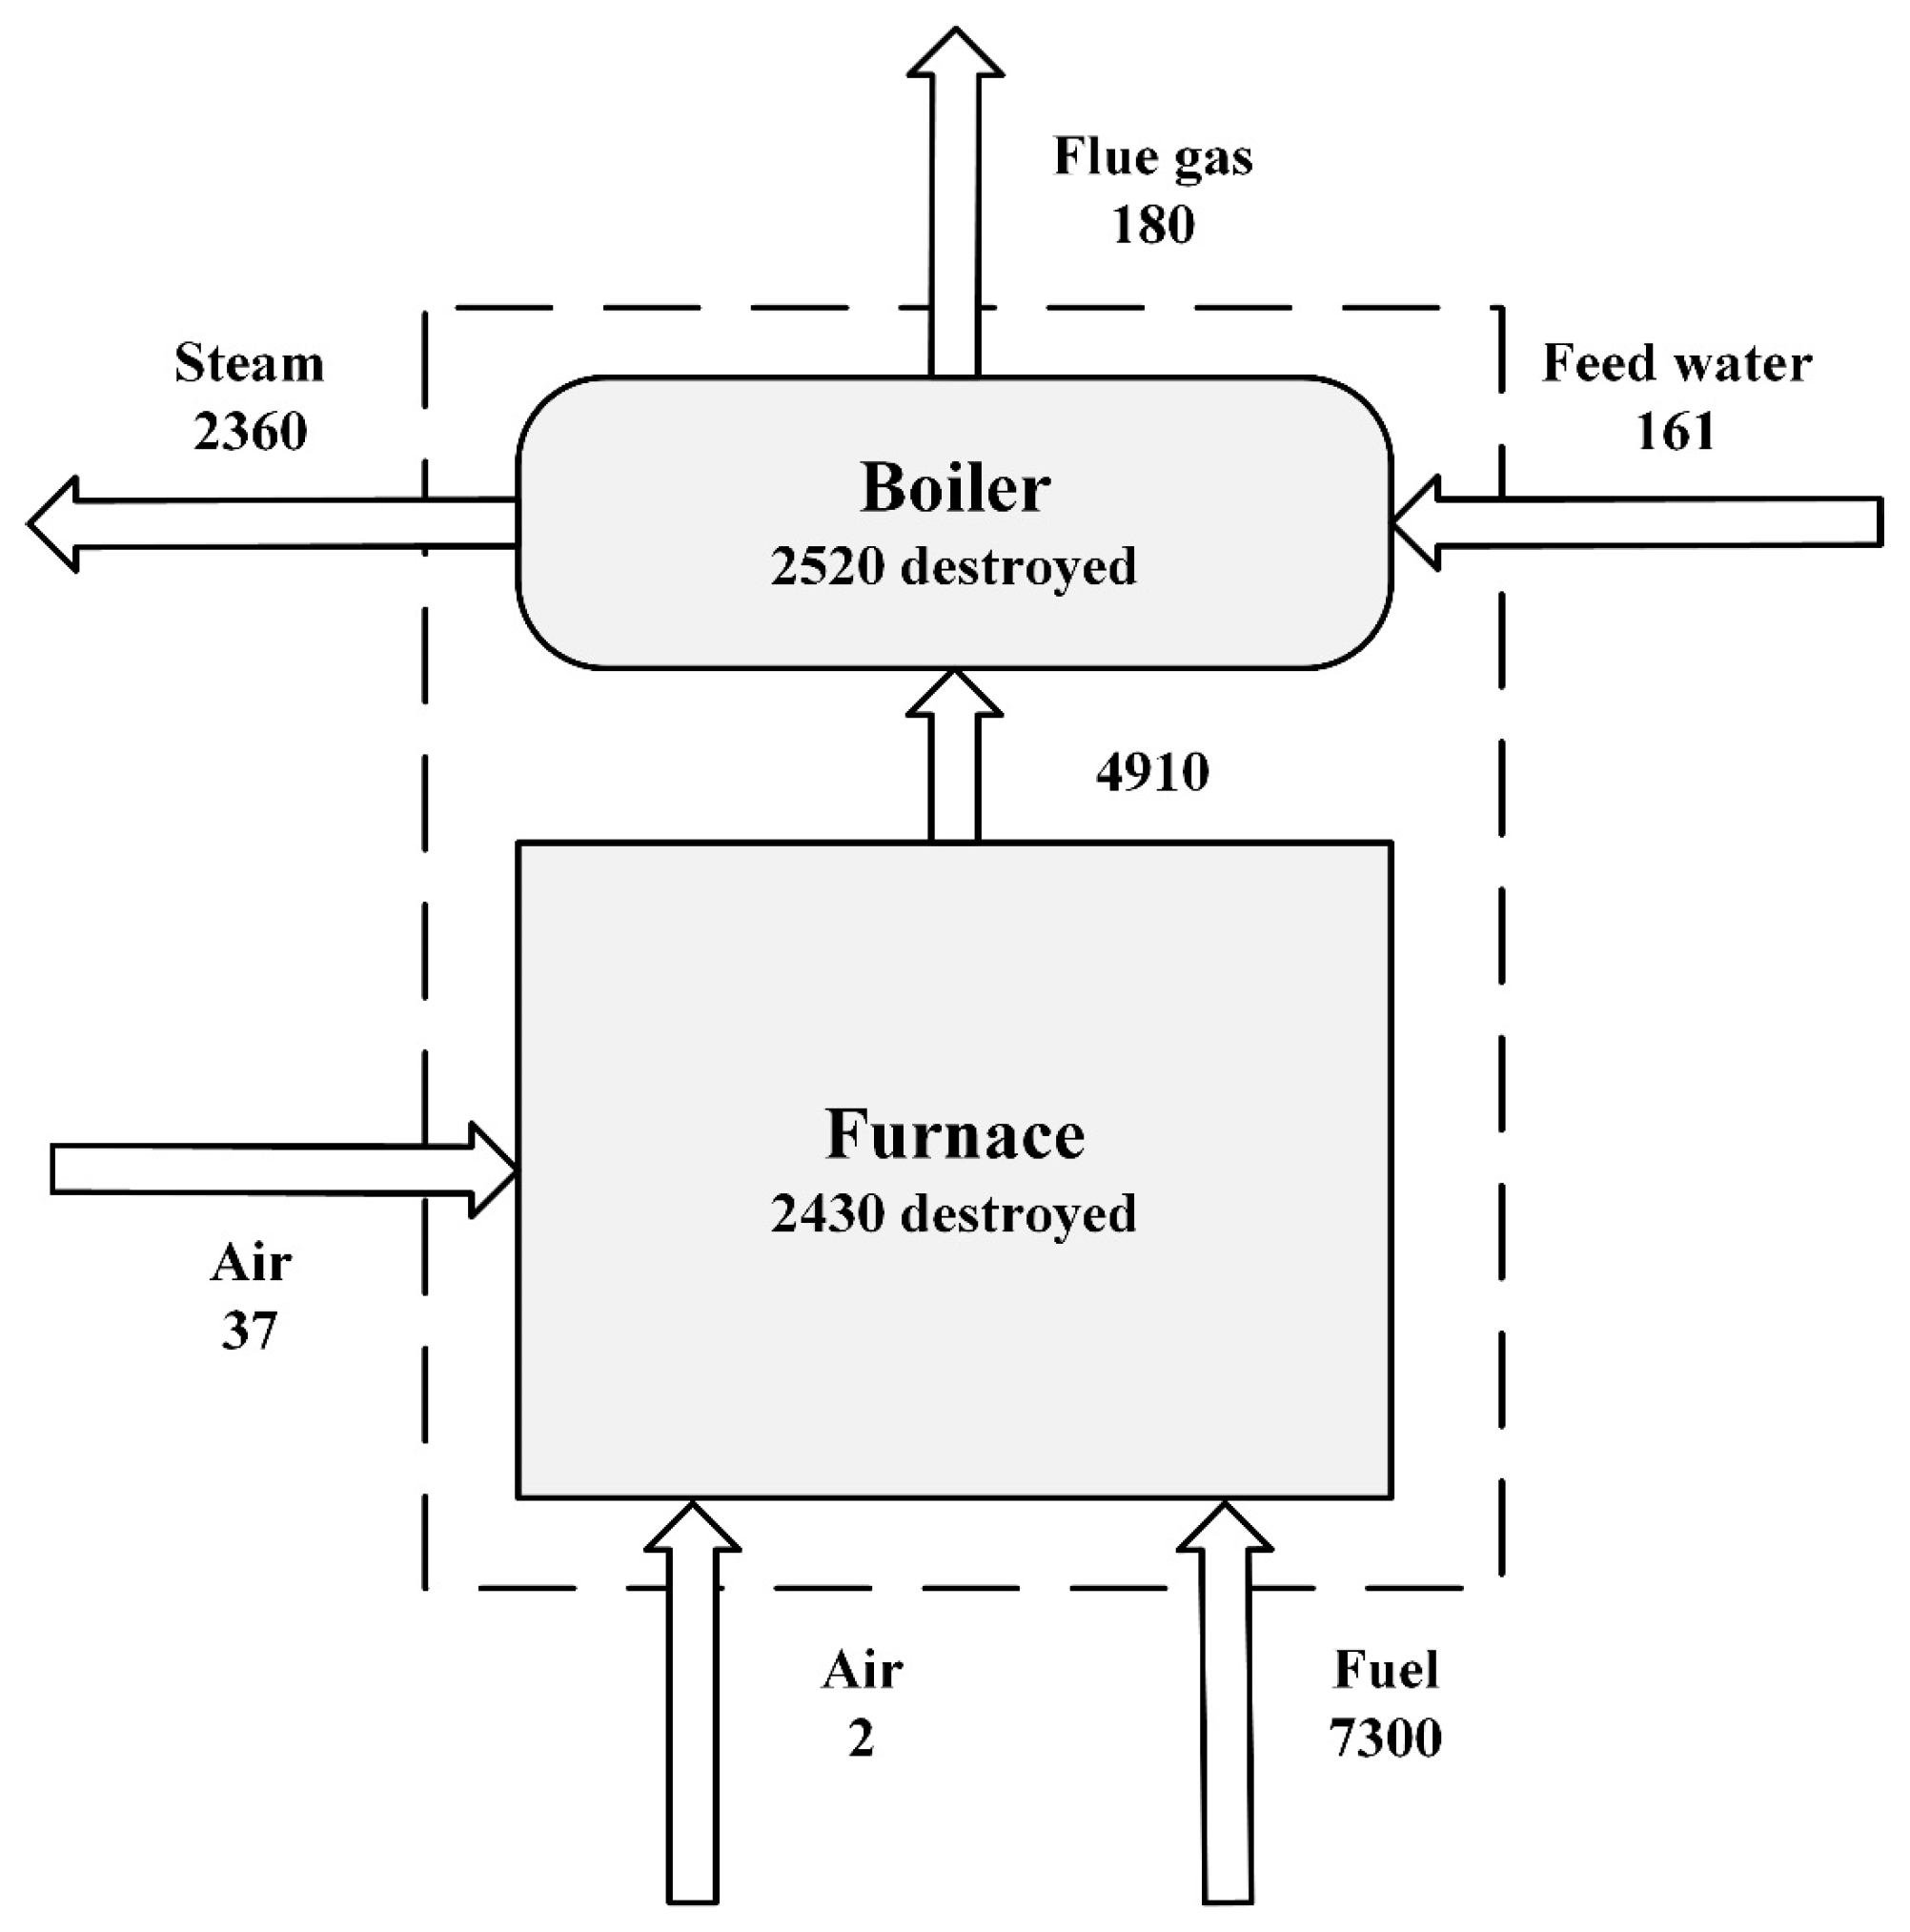
Originally built in 1926 with 3 lump coal fired boilers, the energy plant at the main UI campus has gone through a series of upgrades over the years, with the timeline shown below in Figure 1. The last shipment of coal arrived in 1985 and today over 95% of campus steam requirements are met using a biomass boiler, along with 3 natural gas boilers used as backups. The energy plant provides over 120 million kg of steam to campus annually for heating and cooling needs. A steam turbine is not used to produce electricity at the energy plant since the campus steam requirements are too low in the warm summer months for efficient operation. Steam pressure levels through the boilers are quite low as a result, minimizing pumping costs.
Each one of the boilers has a different equipment configuration, shown in Table 1, with natural gas boiler 2 having no equipment installed and providing a usual baseline when considering the impacts of additional equipment. Since the biomass boiler supplies most of the steam required on campus, efforts have been made to improve its efficiency as much as possible. Additional air is added using computer controls as needed to maintain 2–6% excess oxygen levels in the exhaust.
Biomass fuel comes to the UI energy plant in the form of wood chips composed primarily of western red cedar. Wood chips are sourced from the local logging industry and sizes range from 1–15 cm. Higher heating values have previously been calculated experimentally and range between 20.22–20.97 MJ/kg on a bone dry basis [26]. The use of biomass at UI provides the opportunity for the logging industry in the northwest to dispose of waste from producing lumber in an environmentally responsible manner, while at the same time allowing UI to produce steam sustainably at reduced costs and minimal reliance on fossil fuels.
Figure 2 shows the schematic diagram of the steam cycle through the biomass. An economizer is used to preheat the feed water before it enters the boiler. A pressure reducer is used to reduce the steam pressure to levels more suitable for the needs in campus buildings. On an annual basis, 3% of the steam is lost in the cycle and required makeup water is introduced in the hot lime softener (HLS) tank. This allows for the water to be preheated before entering the de-aerator. Condensate from the absorption chiller and campus is returned at atmospheric pressure to the condensate tank.
On average, 0.5% of the wood chips by weight leaves the furnace as fly ash, which is removed from the flue gas in the multi-cone cyclonic separator. Heat energy in the flue gas is recovered using an air preheater. This reduces the flue gas temperature, and thus energy losses, while increasing the overall efficiency of the cycle. It is important to note that the temperature of the flue gas entering the stack can only be reduced so much however, as the increased potential for condensation forming can lead to accelerated corrosion. Under-fire air introduced in the furnace is at ambient conditions.

4. Analysis

Generally, the biomass boiler operates throughout the year and is only shut down for maintenance purposes. Additional boilers are brought online as needed during peak load times in the winter. Because of this, measurement data is not available for the 3 natural gas boilers. To account for this when comparing the exergetic performance of the boilers, a baseline is created using the average thermal efficiencies of each boiler and the flow conditions presented in Table 2. Yearly steam production is known, allowing for the load requirements to be determined given a certain flow condition.
To identify sources of exergy destruction in the steam cycle through the biomass boiler, the cycle was analyzed with ambient conditions at the time of measurement of 300.4 K and 101.7 kPa. Temperatures and pressures are monitored at each major component and the thermodynamic properties of each state point have been summarized in Table 3.

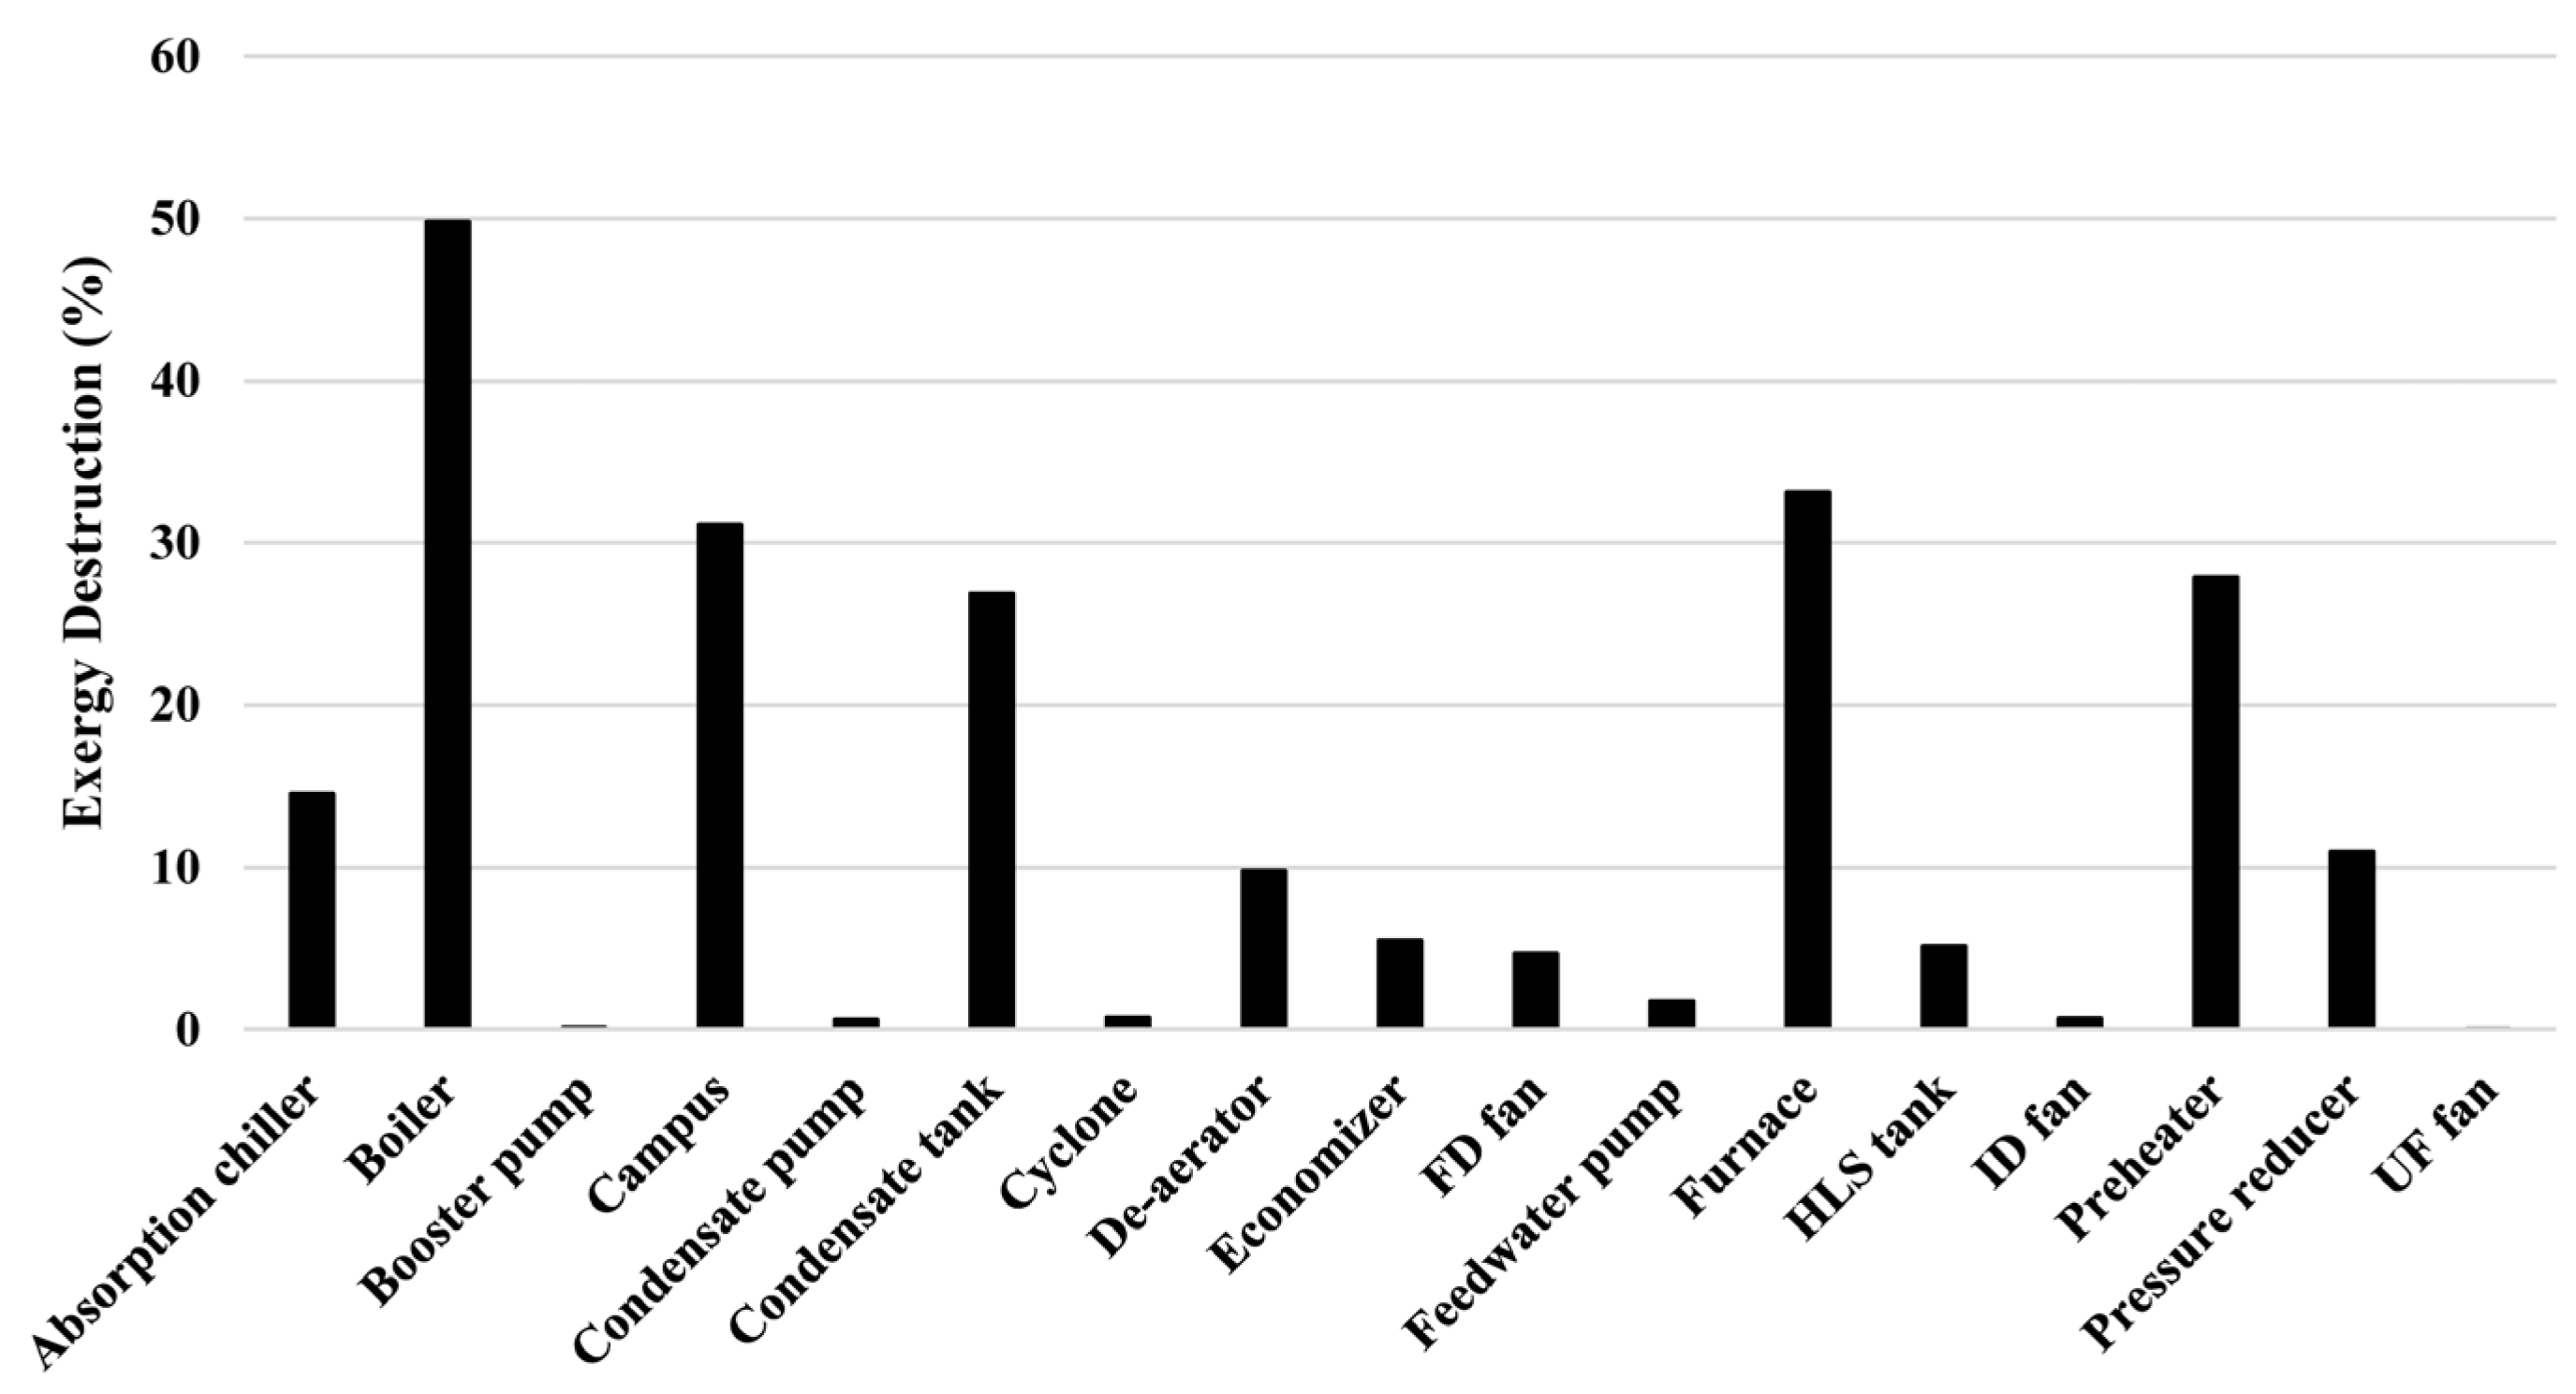
5. Results and Discussion

Table 4 shows the energy and exergy efficiencies of each boiler, given the flow conditions from Table 3. It is expected that the energy and exergy efficiency values for the biomass boiler are lower than the natural gas boilers due to the lower heating value of the fuel, despite having equipment installed to improve efficiency.
The efficiencies of each boiler are of some interest. Natural gas boiler 3, built in 1940, has comparable performance with the newest boiler due to the equipment upgrades introduced throughout its life. With no upgrades, natural gas boiler 2 still uses 1960s technology and has a noticeably reduced energy efficiency compared to the other natural gas boilers. The efficiency of the biomass boiler is lower, but it is utilizing a waste stream from another industry and is more environmentally friendly than the other boilers. It is this lower efficiency that leads to the need to identify the primary sources of exergy destruction.
Figure 3 shows the exergy flow rates into and out of the biomass boiler and furnace with the values obtained by multiplying the mass flow rate by the specific flow exergy found in Table 3. Substantial amounts of the incoming exergy is destroyed in the combustion and phase change processes. Some exergy in the flue gas is later recovered in the economizer and air preheater before reaching the stack and ultimately 62 kW of the exergy is exhausted to the atmosphere once leaving the exhaust stack.
The exergy destroyed in each component of the system, when compared to the exergy input of the individual component, can be expressed as
X ˙ d e s ( % ) = X ˙ d e s e x e r g y   i n p u t × 100 ( % )
Figure 4 shows the percentage of exergy destruction for each component in the cycle. The boiler and furnace account for much of the exergy losses in the system. Other thermal devices such as the air preheater, campus load, and condensate tank destroy a significant portion of the exergy entering the respective component. In comparison, pumps and fans destroy very little of incoming exergy.
To help clarify which components have the largest impact on the total exergy destruction in the system, a common reference point is needed. For example, the air preheater destroys 28% of its exergy input however the total exergy through it is very low compared to components handling steam. Figure 5 below shows the exergy destruction rates in the components when compared to the exergy content of the fuel input, which can be expressed as
X ˙ d f u e l ( % ) = X ˙ d e s X ˙ f u e l × 100 ( % )
Many components in the cycle destroy significant amounts of flow exergy, indicating that improvements could be made. However, these flow exergies are often very small compared to the exergy input from the fuel, which is apparent in Figure 5. The largest sources of exergy destruction using Equation (9) are found in the boiler and furnace at approximately 35% and 33% of losses, respectively, followed by the heating equipment used on campus at 6% and the pressure reducer at 4%. Exergy destruction in most other components is negligible when compared to the exergy supplied by the fuel. Improvements and optimization efforts for the system are often more rational if they start at the components with the largest opportunities for improvement, to improve or maximize the potential benefits.

6. Conclusions

An investigation, based on the second law of exergy, of the boilers at the UI district energy plant has been conducted. Four different boilers, each with different configurations, are evaluated and the thermal and exergy efficiency of each is compared. Energy efficiency varies from 76 to 85%, while exergy efficiency is significantly lower at 24 to 27%. Much of the reduced exergy efficiency for both fuel types is due to the exergy destroyed during the combustion process, an unavoidable characteristic of combusting fuel. The reduced heating value of the wood chip fuel is the primary cause for the reduced efficiency when compared to natural gas, however the proximity of the fuel source still results in substantial economic savings and increases the sustainability footprint of the school thanks to reduced transportation costs. This minimizes the ancillary emissions created by regular shipments of wood chips delivered by trucks. Utilizing biomass as a fuel source is generally considered to be an environmentally friendly means to operate boilers since it does not emit net CO2 when combusted, unlike fossil fuels. If the fuel cannot be sourced locally the transportation costs, both economically and environmentally, could be costlier than fuels such as natural gas.
The study demonstrates which components in the steam cycle would benefit from enhancement and/or optimization. The biomass boiler and furnace account for the greatest exergy destruction, at approximately 68% of the total exergy provided by the fuel. Steam use on campus represents 6% of exergy losses while the pressure reducer is responsible for 4%. Possible methods of reducing exergy losses in these components include improvements in the heating equipment on campus as well as modifying the current plant by installing a steam turbine and generator for electricity production. Since work is considered to be pure exergy, this would substantially increase the exergy efficiency of the system.
Expanding the scope of this assessment to the natural gas boilers would provide further insight into the sustainability of the energy plant and provide a comparison of biomass against fossil fuels in a similar environment. The multiple configurations for each boiler also allow for the comparison between equipment such as economizers and preheaters. An in depth investigation into the piping and heating equipment on campus would reveal where losses are occurring as well.

Acknowledgments

The authors wish to thank Scott Smith who provided insight and expertise that greatly assisted the research.

Nomenclature

AFAir Fuel Ratio
boostbooster
Condcondensate
CTcondensate tank
DAde-aerator
DEdistrict energy
ηefficiency
econeconomizer
FDforced draft
feedfeed water
ggravitational constant
GHGgreenhouse gas
hspecific enthalpy (kJ/kg)
HLShot lime softener
HVheating value (kJ/kg)
IDinduced draft
m ˙ mass flow rate (kg/s)
Ppressure (kPa)
PHair preheater
PRPressure Reducer
ψspecific exergy (kJ/kg)
PTApercent theoretical air
Q ˙ heat transfer rate (kW)
sspecific entropy (kJ/kg-K)
Ttemperature (K)
TESthermal energy storage
UFunder-fire
Vvelocity (m/s)
X ˙ exergy rate (kW)
zheight (m)
Subscripts
0reference property
actActual
desdestroyed
fFlow
XExergy

References

  1. U.S. Environmental Protection Agency. Inventory of U.S. Greenhouse Gas Emissions and Sinks: 1990–2014; U.S. Environmental Protection Agency: Washington, DC, USA, 2016.
  2. Graedel, T.E.; Allenby, B.R. Industrial Ecology and Sustainable Engineering; Prentice Hall: Upper Saddle River, NJ, USA, 2010. [Google Scholar]
  3. Rezaie, B.; Rosen, M.A. District heating and cooling: Review of technology and potential enhancements. Appl. Energy 2012, 93, 2–10. [Google Scholar] [CrossRef]
  4. Nijjar, J.S.; Fung, A.S.; Hughes, L.; Taherian, H. District heating system design for rural Nova Scotian communities using building simulation and energy usage databases. Trans. Can. Soc. Mech. Eng. 2009, 33, 51–63. [Google Scholar] [CrossRef]
  5. Lake, A.; Rezaie, B.; Beyerlein, S. Review of district heating and cooling systems for a sustainable future. Renew. Sustain. Energy Rev. 2017, 67, 417–425. [Google Scholar] [CrossRef]
  6. Dincer, I. The role of exergy in energy policy making. Energy Policy 2002, 30, 137–149. [Google Scholar] [CrossRef]
  7. Regulagadda, P.; Dincer, I.; Naterer, G.F. Exergy analysis of a thermal power plant with measured boiler and turbine losses. Appl. Therm. Eng. 2010, 30, 8–9. [Google Scholar] [CrossRef]
  8. Torío, H.; Angelotti, A.; Schmidt, D. Exergy analysis of renewable energy-based climatisation systems for buildings: A critical view. Energy Build. 2009, 41, 248–271. [Google Scholar] [CrossRef]
  9. Sengupta, S.; Datta, A.; Duttagupta, S. Exergy analysis of a coal-based 210 MW thermal power plant. Int. J. Energy Res. 2007, 31, 14–38. [Google Scholar] [CrossRef]
  10. Ayres, R.U.; Ayres, L.; Martinas, K. Eco-thermodynamics: Exergy and Life Cycle Analysis; INSEAD: Fontainebleau, France, 1996; pp. 1–22. [Google Scholar]
  11. Rosen, M.A.; Dincer, I. Exergy as the confluence of energy, environment and sustainable development. Exergy Int. J. 2001, 1, 3–13. [Google Scholar] [CrossRef]
  12. Dincer, I.; Rosen, M.A. A worldwide perspective on energy, environment and sustainable development. Int. J. Energy Res. 1998, 22, 1305–1321. [Google Scholar] [CrossRef]
  13. Dincer, I.; Rosen, M.A. Energy, environment and sustainable development. Appl. Energy 1999, 64, 427–440. [Google Scholar] [CrossRef]
  14. Dincer, I.; Rosen, M.A. Thermodynamic aspects of renewables and sustainable development. Renew. Sustain. Energy Rev. 2005, 9, 169–189. [Google Scholar] [CrossRef]
  15. Kallert, A.; Schmidt, D.; Bläse, T. Exergy-based analysis of renewable multi-generation units for small scale low temperature district heating supply. Energy Procedia 2017, 116, 13–25. [Google Scholar] [CrossRef]
  16. Compton, M.; Rezaie, B. Enviro-exergy sustainability analysis of boiler evolution in district energy system. Energy 2017, 119, 257–265. [Google Scholar] [CrossRef]
  17. Energy and Environmtental Analysis Inc. Characterization of the U.S. Industrial/Commercial Boiler Population; Energy and Environmtental Analysis Inc.: Arlington, VA, USA, 2005. [Google Scholar]
  18. Behbahaninia, A.; Ramezani, S.; Hejrandoost, M.L. A loss method for exergy auditing of steam boilers. Energy 2017, 140, 253–260. [Google Scholar] [CrossRef]
  19. Terhan, M.; Comakli, K. Energy and exergy analyses of natural gas-fired boilers in a district heating system. Appl. Therm. Eng. 2017, 121, 380–387. [Google Scholar] [CrossRef]
  20. Da Silva, J.; Filho, S.Á.; Carvalho, M. Assessment of energy and exergy efficiencies in steam generators. J. Braz. Soc. Mech. Sci. Eng. 2017, 39, 3217–3226. [Google Scholar] [CrossRef]
  21. Gürtürk, M.; Oztop, H.F. Exergy analysis of a circulating fluidized bed boiler cogeneration power plant. Energy Convers. Manag. 2016, 120, 346–357. [Google Scholar] [CrossRef]
  22. Sciubba, E. Beyond thermoeconomics? The concept of extended exergy accounting and its application to the analysis and design of thermal systems. Exergy Int. J. 2001, 1, 68–84. [Google Scholar] [CrossRef]
  23. Dewulf, J.; Boesch, M.E.; de Meester, B.; van der Vorst, G.; van Langenhove, H.; Hellweg, S.; Huijbregts, M.A.J. Supporting information: Cumulative exergy extraction from the natural environment (CEENE): A comprehensive life cycle impact assessment method for resource accounting. Environ. Sci. Technol. 2007, 41, 8477–8483. [Google Scholar] [CrossRef]
  24. Gaggioli, R.A. The dead state. Int. J. Thermophys. 2012, 15, 191–199. [Google Scholar] [CrossRef]
  25. Kanoglu, M.; Dincer, I.; Rosen, M.A. Understanding energy and exergy efficiencies for improved energy management in power plants. Energy Policy 2007, 35, 3967–3978. [Google Scholar] [CrossRef]
  26. Wilson, P.L.; Funck, J.W.; Avery, R.B. Fuelwood Characteristics of Northwestern Conifers and Hardwoods (Updated); U.S. Department of Agriculture, Forest Service: Portland, OR, USA, 2010.
Figure 1. Timeline of boiler evolution at the UI district energy plant from 1926 to 2017.
Proceedings 02 00159 g001
Figure 2. Flow diagram of the steam cycle including the biomass boiler.
Proceedings 02 00159 g002
Figure 3. Exergy flow and destruction rates (in kW) for the biomass boiler and furnace.
Proceedings 02 00159 g003
Figure 4. Percentage of incoming exergy destroyed in each component.
Proceedings 02 00159 g004
Figure 5. Percentage of exergy destroyed in each component relative to exergy input with fuel.
Proceedings 02 00159 g005
Table 1. Additional equipment installed on individual boilers.
ComponentBiomassNG 1NG 2NG 3
Multi-cone cyclonic separatorX
EconomizerXX
Air Pre-heaterX X
New (<3 years) Burner Package X
Table 2. Reference water and steam flow conditions to determine exergy efficiency of each boiler.
Point m ˙ (kg/s) T (K)P (kPa)h (kJ/kg)s (kJ/kg-K) ψ (kJ/kg)
Dead state-294.291.788.180.3107-
Inlet (water)3.878294.2103488.10.31070
Outlet (steam)3.878454.5103427786.573848
Table 3. Data for flows and conditions of steam cycle when T0 = 300.4 K, P0 = 101.7 kPa.
Point m ˙ (kg/s) T (K)P (kPa)h (kJ/kg)s (kJ/kg-K) ψ (kJ/kg)
0-300.4101.7114.20.3982-
12.949452977.327766.593801.3
21.876426.1515.427496.811709.2
31.819373.2101.7419.51.30831.99
40.9412390.8184.427037.154559.1
50.9412373.2101.7419.51.30831.99
60.132387.8167.226987.187544.8
70.05627295.9667.196.150.33580.7061
80.1882385.4223470.81.44342.71
90.1882385.4632.6471.41.44343.23
102.761362.0116.6372.41.1823.39
112.761362.1377.5372.91.1823.69
122.949385.4155.4471.71.44542.9
132.949385.91625474.21.44844.67
142.949396.516255191.56255.06
152.949396.5977.3518.51.56354.43
163.246314.8101.7315.26.9140.3389
173.246315.3102.1315.76.9140.7382
183.246387102.1388.27.12110.97
190.5127300.4101.7300.76.867-
200.5127300.8102.1303.86.8672.996
214.2951829101.720408.8531143
224.295486.5101.7489.57.35641.98
234.295456.5101.7458.87.29130.84
244.292456.5101.4458.87.29130.63
254.292402.7101.44047.16414.19
264.292403.2101.7404.57.16414.54
Table 4. Efficiencies of boilers when steam temperature leaving boiler is 455 K.
BoilerThermalExergy
Biomass76%24%
NG 185%27%
NG 278%25%
NG 385%27%
Publisher’s Note: MDPI stays neutral with regard to jurisdictional claims in published maps and institutional affiliations.

