Proceeding Paper

Standalone Point-of-Use Device for Gluten Detection in Food: POCT Application Experiment in SMARTER-SI European Project †

1
IK4-Ikerlan Technology Research Centre, Pº J.Mª Arizmendiarrieta 2, 20500 Arrasate-Mondragón, Gipuzkoa, Spain
2
Ingenasa, c/Hermanos García Noblejas 39, 28037 Madrid, Spain
3
Hahn-Schickard, Wilhelm-Schickard Str.10, 78052 Villingen-Schwenningen, Baden-Wurtemberg, Germany
4
CiS Research Institute for Microsensors GmbH, Konrad-Zuse-Straße 14, 99099 Erfurt, Germany
*
Author to whom correspondence should be addressed.
Presented at the 4th International Electronic Conference on Sensors and Applications, 15–30 November 2017; Available online: http://sciforum.net/conference/ecsa-4.
Proceedings 2018, 2(3), 128; https://doi.org/10.3390/ecsa-4-04915
Published: 14 November 2017

Abstract

:
In this work, we present an automatic and standalone microfluidic-based immunosensor to detect food allergens for food safety. The system has been developed as an application experiment in the SMARTER-SI European project. It comprises a microfluidic cartridge fabricated in cyclic olefin polymer by injection molding, the fluidic components to drive the reagents, two alternative optical detection systems based on fluorescent or colorimetric detection, respectively, and the electronics to manage all the components. As a proof-of-concept, gluten was immunodetected in a sandwich format by using R5 monoclonal antibody as capturing and detector probe. Gluten -antibody binding was revealed by using R5 mAb labelled to Alexa Fluor 647 or conjugated to horseradish peroxidase (HRP) for the fluorescence or the colorimetric version, respectively。

1. Introduction

Microarray technology offers multiplexed detection and miniaturization capability to point-of-care devices [1]. Those capabilities provide (i) reduction of analysis time and sample and reagent consumption; (ii) increase of sensibility and (iii) portability. Integration of microarray, microfluidics and microfabrication technology [2] allow to develop rapid and cost-effective assays at point-of-use and point-of-care. Here we present a standalone point-of-use immunosensor device for food safety. Gluten was used as reference allergen to develop and test the device. Gluten is a general name for the proteins found in wheat involving both soluble gliadin and insoluble glutenin proteins. Celiac disease is a gluten-sensitive enteropathy and one of the most common autoimmune disease affecting 1% of individuals in Europe [3]. The treatment of choice is a gluten-free diet [4]. According to the international food standards [5], to label a food as gluten-free, it must contain less than 20 mg/kg of gluten (20 ppm). And according to the same standard, the method to detect the amount of gluten must have a detection limit of 10 ppm. But there are some countries that have lowered this limit to 3 ppm [6] including a limit of detection as low as 1 ppm. Here, we use monoclonal R5 antibody, accepted by the Codex Alimentarius Committee for gluten determination, specific to a repetitive gluten epitope [7]. In this work, we present a compact standalone device for food safety testing in both colorimetric and fluorescence readers.

2. Antigens and Antibodies

Gliadin (IRMM-480) was purchased from Hanne Leys; Technical and Sales Information European Commission—DG Joint Research Centre Institute for Reference Materials and Measurements (Belgium) and ovalbumin, used as negative control (Albumin from Chicken egg; Merck, Kenilworth, NJ, USA). R5 monoclonal antibody was used as both capturing and detector antibody [7]. R5 was conjugated to horse radish peroxidase [8] and conjugated to Alexa 647 following the manufacturer’s instructions (Alexa Fluor® 647 Protein Labeling Kit; Thermo Fisher Scientific, Waltham, MA, USA).

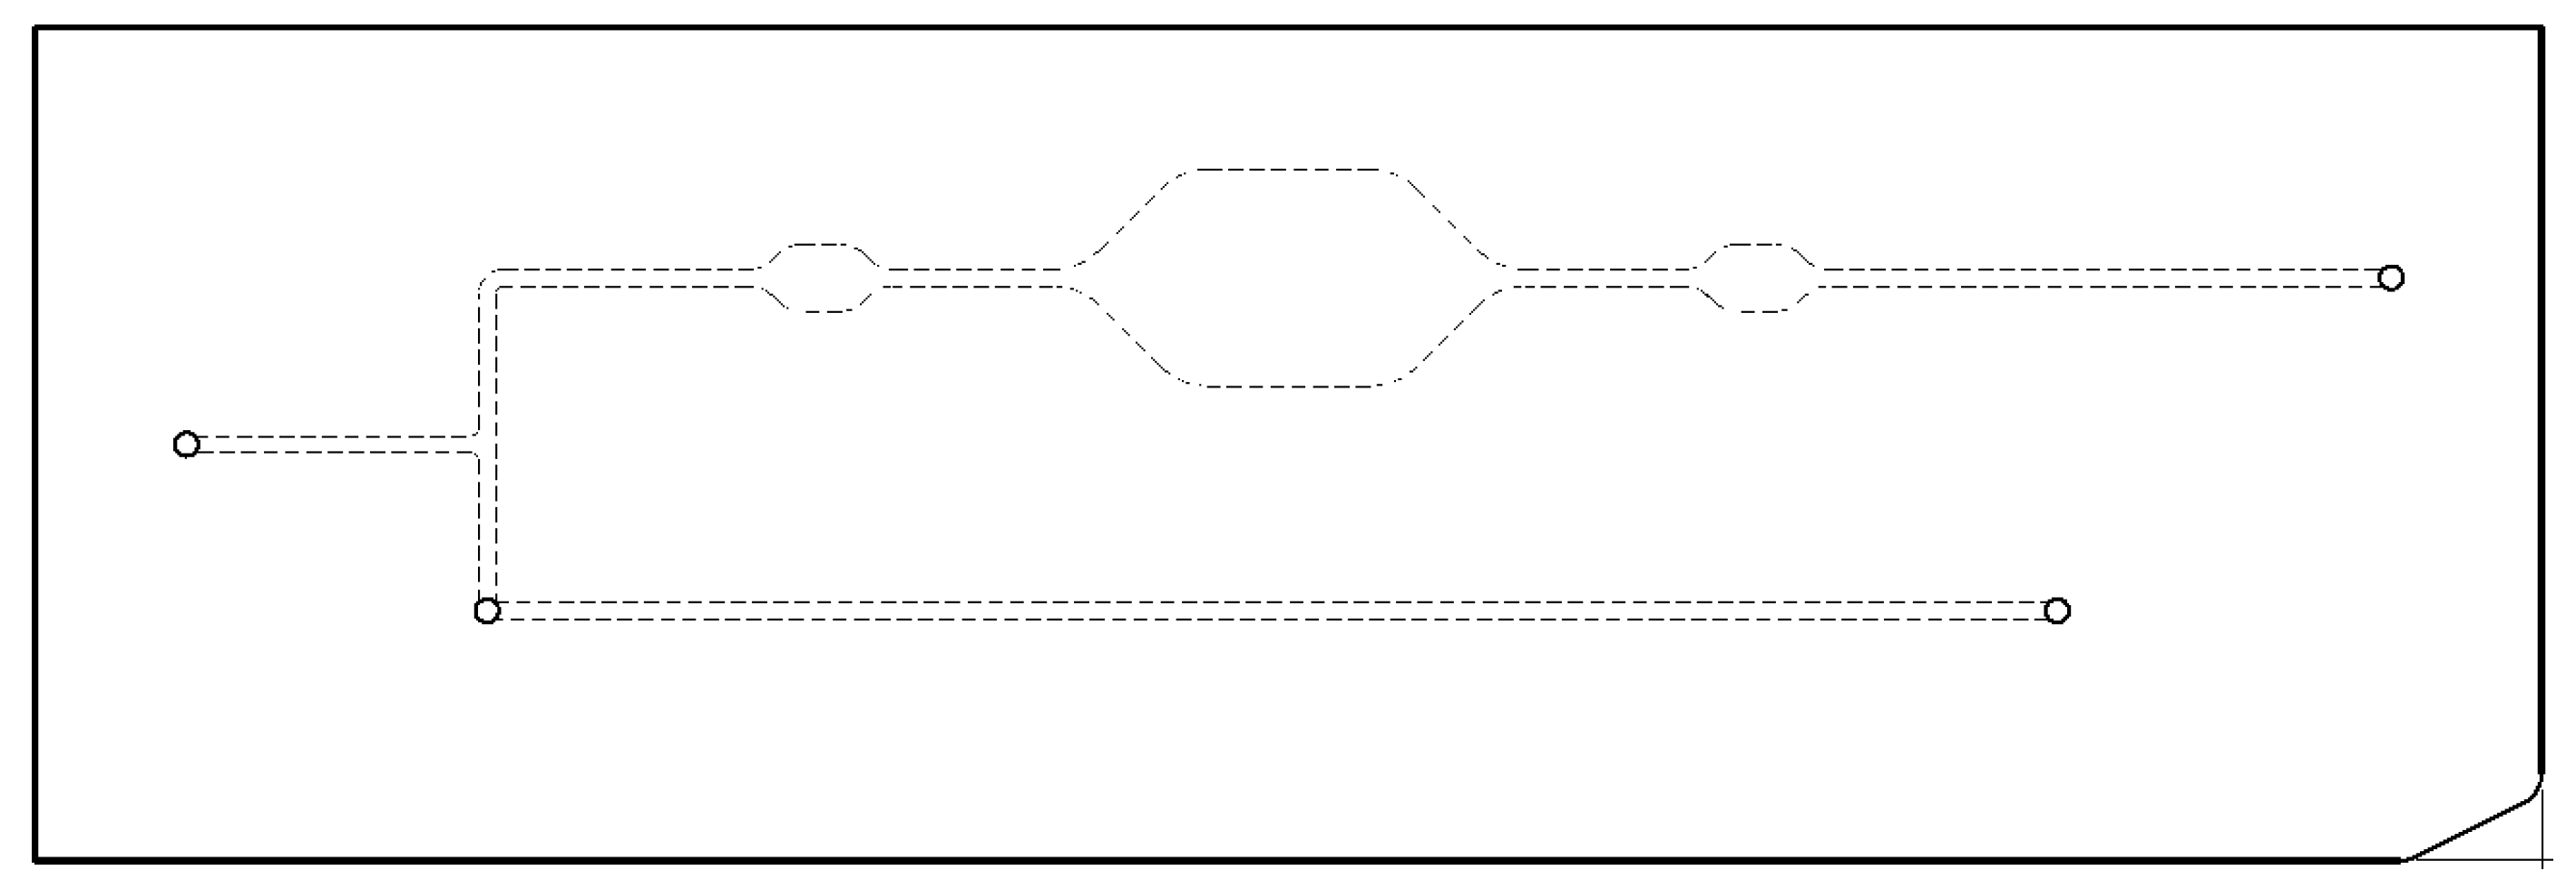
3. Microfluidic Cartridges

The biological assay is performed in a plastic injected, slide format cartridge (Figure 1). The material used was cyclic olefin polymer (COP).
To seal the cartridge in order to obtain a microfluidic device, pressure sensitive adhesive film was used.

4. Antigen Immobilization

Microarrays were printed on the cartridge incubation chamber from a mixed solution of sciPOLY3D (Scienion, Johannisthal, Germany) and 1 mg/mL of R5 antibody following the manufacturer’s recommendations. A 500 pL droplet of the solution was dispensed using a NanoPlotter 2.0 non-contact microarrayer (GeSim, Radeberg, Germany) rendering approximately 120 nm diameter spots. After dispensing, spotted antibody mixture was irradiated with ultraviolet light at 365 nm with 16 W/cm2 power density during 45 s to crosslink the antibody to the surface-attached sciPOLY3D hydrogel.

5. Microfluidic Microarray Immunoassay
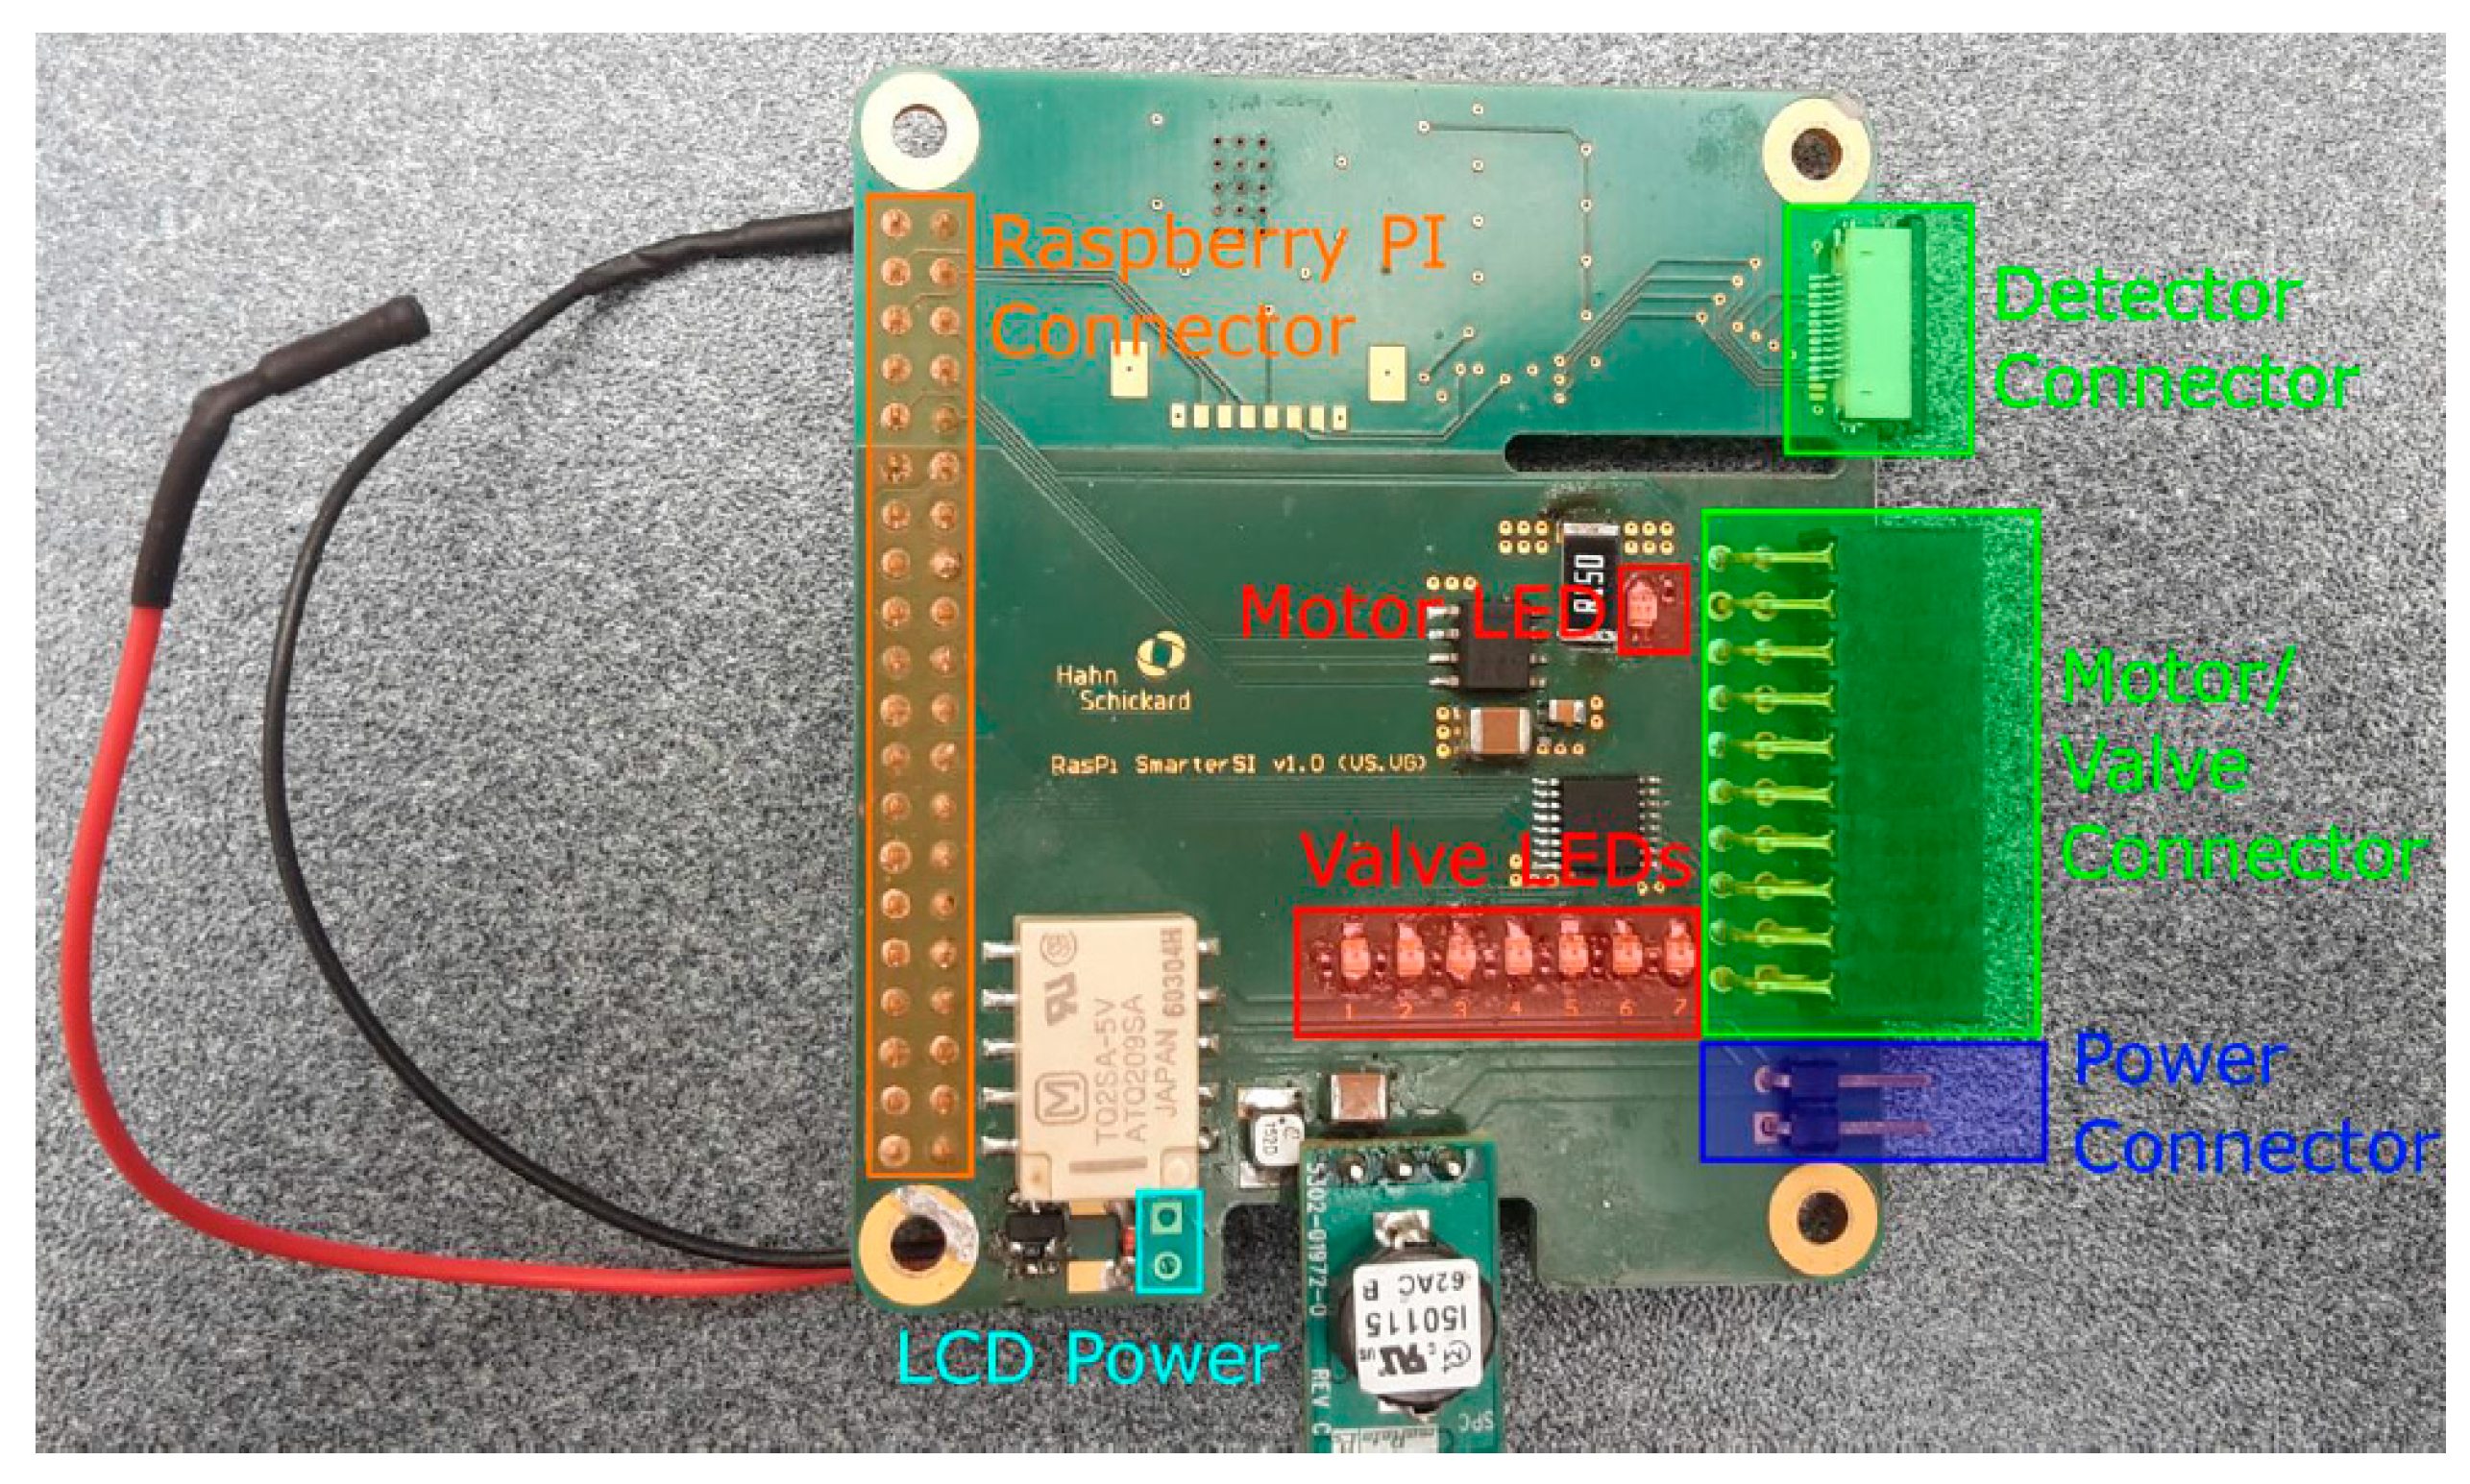
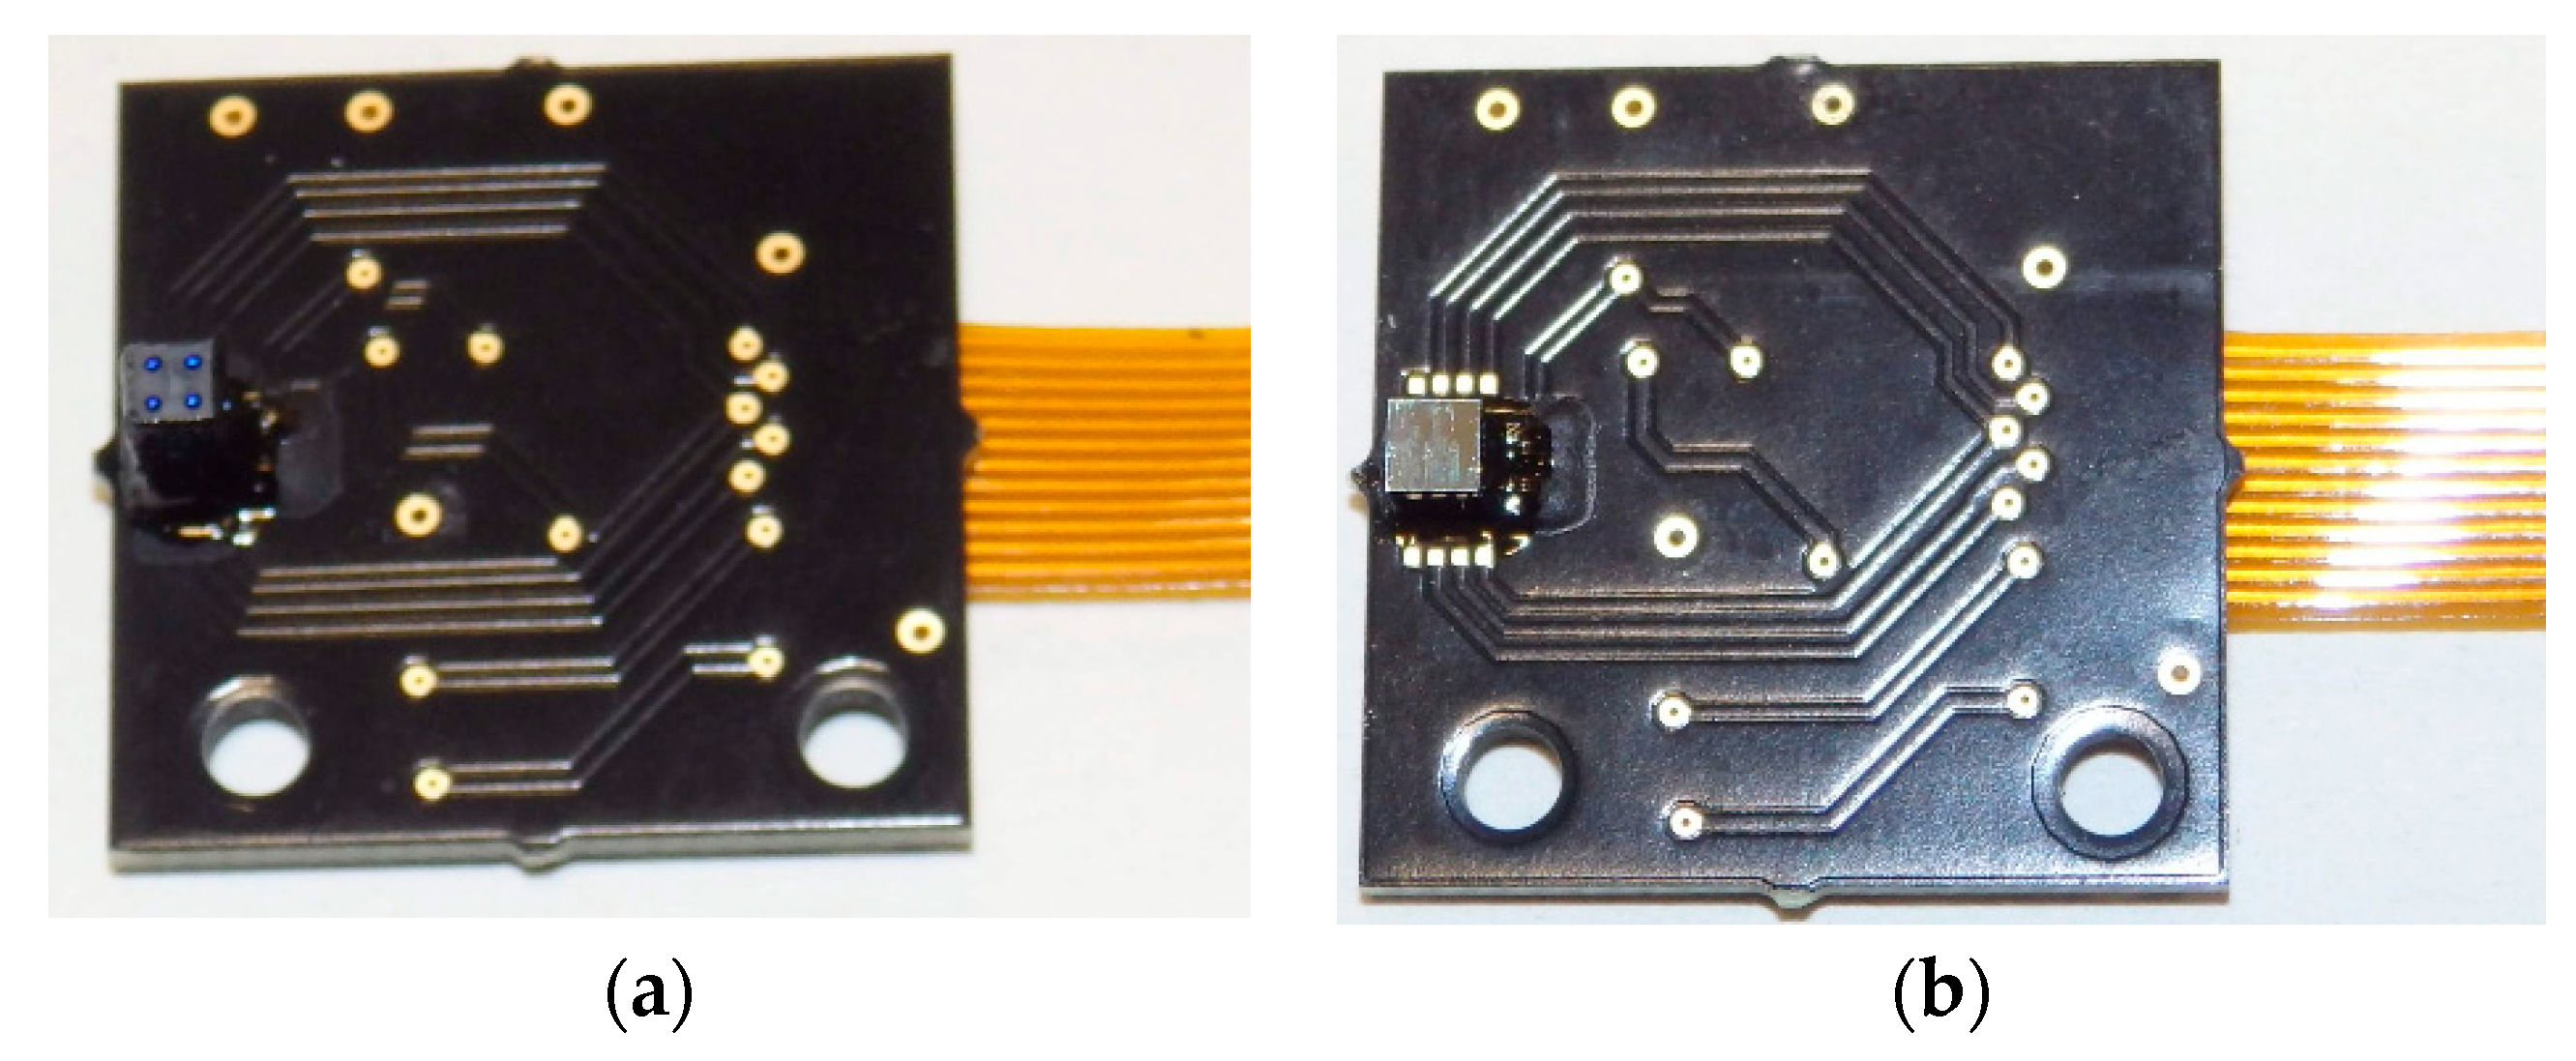
Blocking buffer, washing buffer, detector antibody, sample and TMB developing solution were previously dispensed into the corresponding device reservoirs (max. 1 mL for washing buffer and 200 µL for the rest of them). Firstly, spots on the cartridge incubation chamber were rising at 190 µL/min for 3 min of washing buffer (INGENASA, Madrid, Spain) and then were blocked with 20 µL blocking buffer (INGENASA, Madrid, Spain) for 20 min. Blocking, sample and antibody detector were all incubated in a cyclic reversed flux manner (2 s for each direction every 30 s). Gluten samples were diluted in DE01 Dilution Buffer (INGENASA, Madrid, Spain) and incubated for 20 min. After rising washing buffer (INGENASA, Madrid, Spain) at 50 µL/min for 3 min, R5 conjugated to HRP diluted 1/4000 in antibody dilution buffer (INGENASA, Madrid, Spain) was incubated for 20 min. Then, washing buffer was flushed at 50 µL/min for 3 min and gluten-R5 binding was developed by incubating without agitation with ep(HS)TMB-mA (SDT GmbH, Baesweiler, Germany).

6. Platform

The system is based on microfluidic components and the electronics to control and manage the microfluidic system.
The fluidic part of the device is based on off-the-shelf components: Asco Numatics 067 series valves and Watson Marlow 400 F/A peristaltic pump. For this application, a specialized microfluidic cartridge was used, and to connect all these components, specifically designed input and output manifolds were used [9]. To move all the reagents, the approach used in this work is based on a suction peristaltic pump (downstream).
To manage and control the whole system, a Raspberry Pi 3 is used [10]. To ease the use of this embedded PC, a touch screen is attached to the display serial interface. To drive the fluidic components through the GPIO’s of the embedded PC, an expressly designed electronic board is integrated on top of the embedded PC (Figure 2).
This system allows a precise control of the flow, controlling the driving power to the electric motor of the peristaltic pump. So the flow can be easily changed, ranging between 45 µL/min and 190 µL/min with the selected combination of motor and tube bore.
The system works on a piece of software based on Python 2.7 [11], and the graphical user interface is based on Kivy [12]. The final platform is showed in the Figure 3.
This platform has been designed to work both with a colorimetry or a fluorescence detection system.

6.1. Colorimetric Version

In the case of colorimetry detection, a backlight is placed on top of the cartridge, meanwhile an IDS UI-1241LE-M-GL camera is placed in the bottom part of the cartridge. The camera takes pictures of the spots, and to take measurements, the grey level of the spot is evaluated using Fiji [13].

6.2. Fluorescence Version
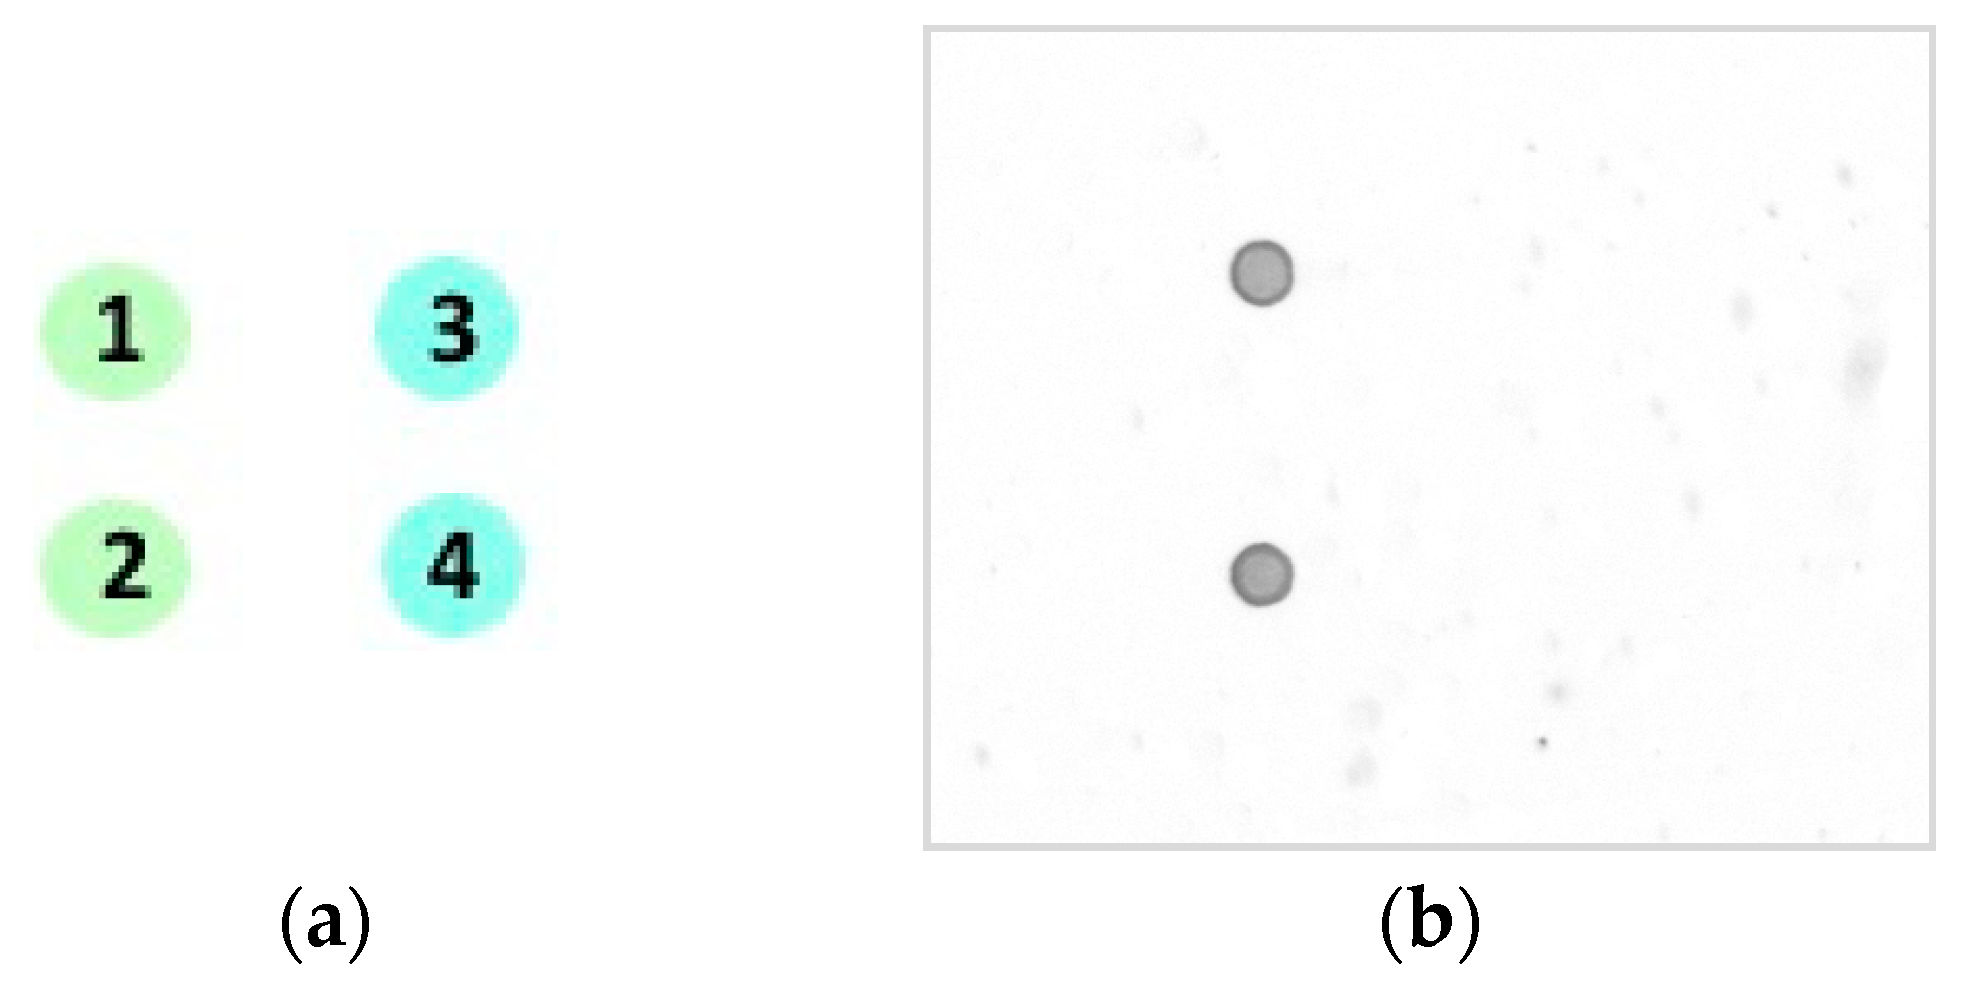
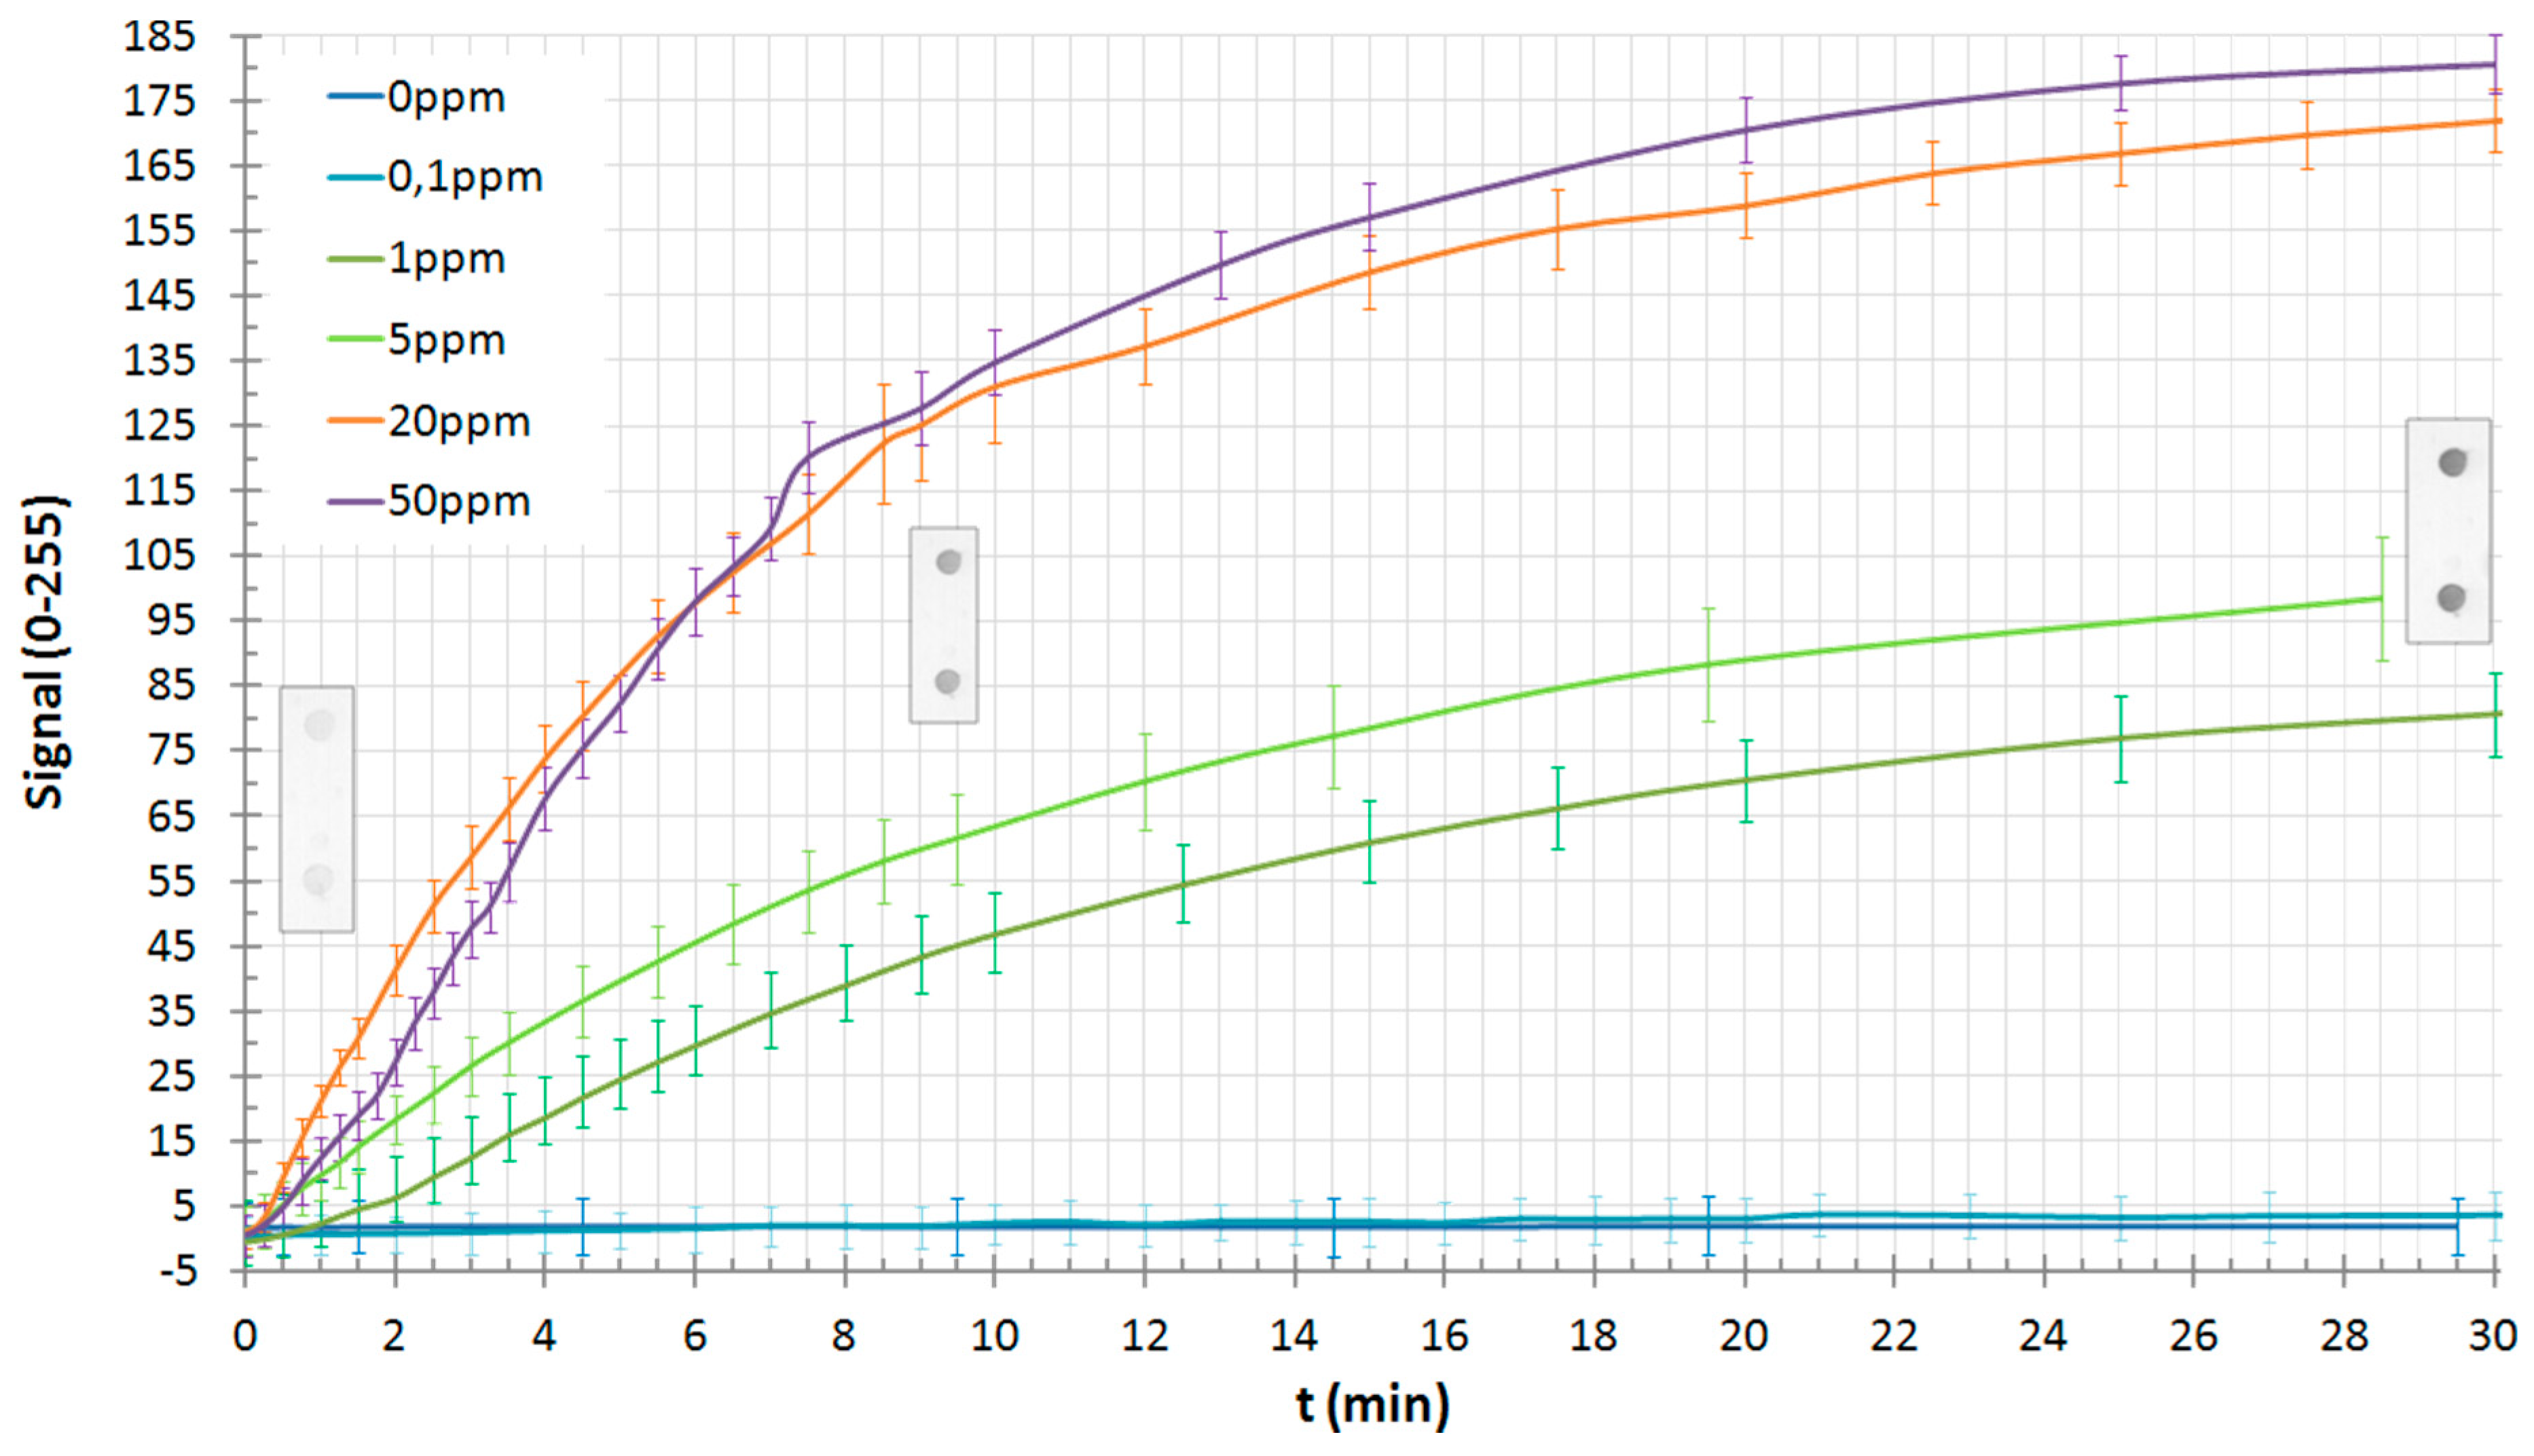
Regarding the fluorescence system, 2 PCB boards have been designed for the excitation and for the detection sides. The emitter is composed of 4 independent LED’s, with the appropriate filters for the Alexa Fluor® 647 dye. The power of these LED’s can be easily changed through the interface. The detector is a photodiode that collects the light emitted by the spots. So to make the measurement, the excitation LED’s must be actuated independently to measure the light emitted by that specific spot under the LED. The boards are showed in the Figure 4.

7. Results

As a proof-of-concept, gluten colorimetric detection was assayed on microfluidic COP cartridges printed by duplicated with gluten spots. Gluten were assayed at different concentrations from 50 to 0.1 ppm in antigen dilution buffer and detected by HRP-R5 detector antibody diluted 1/4000 (previously defined as optimal antibody titer) in antibody dilution buffer. To test unspecific signals and cross-reactivity events, another food allergen, ovalbumin, was printed also by duplicated (Figure 5a). The result of the 1 ppm of gluten test is showed in Figure 5b, where the positions of the other antigens were marked with a discontinuous circle, as the result is negative.
To test the dynamic range of the system, gluten concentrations ranging from 0 ppm to 50 ppm were assayed. Images were taken during 30 min developing with TMB, and then analyzed. Signal intensity is the mean gray value from the 2 printed spots with 1 mg/mL gluten or with 1 mg/mL of ovalbumin (Figure 6). No signal was obtained from ovalbumin spots after 30 min, showing that the immunoassay lacks of background and cross-reactivity events.
After 10 min TMB incubation, signal intensities from gluten concentrations higher than 1 ppm were near saturation levels. TMB developing incubation for 3 min appears to be capable to discriminate the intensity signals from a gluten concentration range between 1 and 50 ppm.
To show how the colorimetric signal changes over the developing time, in the graph of the Figure 6, it can be seen the pictures of 2 spots in the 5 ppm assay at 1 min, 9 min and 30 min of developing time.

Acknowledgments

The research leading to these results has received funding from the European Community’s Programme HORIZON 2020 under GA No. 644596 from the project SMARTER-SI http://www.smarter-si.eu/. The SMARTER-SI project is part of the SmartAnythingEverywhere Initiative of the European Commission https://smartanythingeverywhere.eu/.

Author Contributions

Jorge Elizalde and Kepa Mayora conceived and designed the platform and the optical components of the colorimetric version; Jorge Elizalde and Xabier Eguiluz designed and implemented the Graphical User Interface and control software; Luis Alfonso Rivas and Antonio Sanz conceived and designed the biological protocol and the spotting protocol; Jan Dehnert and Vadim Goridko conceived and designed the specific PCB board to control the fluidic components and the fluorescence components; Stefan Görlandt and Martin Schädel conceived and designed the excitation and detection fluorescence components. Jorge Elizalde and Luis Alfonso Rivas conceived, designed and performed the experiments and analyzed the data; Jorge Elizalde and Luis Alfonso Rivas wrote the paper.

Conflicts of Interest

The authors declare no conflict of interest. The founding sponsors had no role in the design of the study; in the collection, analyses, or interpretation of data; in the writing of the manuscript, and in the decision to publish the results.

References

  1. Ursula, S. Analytical protein microarrays: Advancements towards clinical applications. Sensors 2017, 17, 256. [Google Scholar] [CrossRef]
  2. Whitesides, G.M. The origins and the future of microfluidics. Nature 2006, 442, 368–373. [Google Scholar] [CrossRef] [PubMed]
  3. Mustalahti, K.; Catassi, C.; Reunanen, A.; Fabiani, E.; Heier, M.; McMillan, S.; Murray, L.; Metzger, M.H.; Gasparin, M.; Bravi, E.; et al. The prevalence of celiac disease in Europe: Results of a centralized, international mass screening project. Ann. Med. 2010, 42, 587–595. [Google Scholar] [CrossRef] [PubMed]
  4. Peter, H.R.; Green, M.D.; Christophe Cellier, M.D. Celiac disease. N. Engl. J. Med. 2007, 357, 1731–1743. [Google Scholar]
  5. Codex Alimentarius, CODEX STAN 118-1979. Available online: http://www.codexalimentarius.org/ (accessed on 2 October 2017).
  6. Coeliac Disease New Zealand. Available online: http://www.coeliac.org.nz/food-industry/gluten-free-food-standards (accessed on 2 October 2017).
  7. Valdés, I.; García, E.; Llorente, M.; Méndez, E. Innovative approach to low-level gluten determination in foods using a novel sandwich enzyme-linked immunosorbent assay protocol. Eur. J. Gastroenterol. Hepatol. 2003, 15, 465–474. [Google Scholar] [CrossRef] [PubMed]
  8. Nakane, P.K.; Kawaoi, A. Peroxidase-labeled antibody. A new method of conjugation. J. Histochem. Cytochem. 1974, 22, 1084–1091. [Google Scholar] [CrossRef] [PubMed]
  9. Elizalde, J.; Mayora, K.; Rivas, L.A.; Sanz, A.; Tolentino-Cortez, T.; Barreda-Gómez, G.; Tijero, M. Multi-parametric point of care device for allergen-specific IgE detection in veterinary applications. Procedia Eng. 2016, 168, 1410–1413. [Google Scholar] [CrossRef]
  10. Raspberry Pi Foundation. Available online: https://www.raspberrypi.org/ (accessed on 2 October 2017).
  11. Python Software Foundation. Python Language Reference, Version 2.7. Available online: https://docs.python.org/2/ (accessed on 2 October 2017).
  12. Kivy Organization. Available online: https://kivy.org/ (accessed on 2 October 2017).
  13. Schindelin, J.; Arganda-Carreras, I.; Frise, E.; Kaynig, V.; Longair, M.; Pietzsch, T.; Preibisch, S.; Rueden, C.; Saalfeld, S.; Schmid, B.; et al. Fiji: An open-source platform for biological-image analysis. Nat. Methods 2012, 9, 676–682. [Google Scholar] [CrossRef] [PubMed]
Figure 1. Injected cartridge.
Proceedings 02 00128 g001
Figure 2. Designed driving PCB.
Proceedings 02 00128 g002
Figure 3. Platform.
Figure 3. Platform.
Proceedings 02 00128 g003
Figure 4. Fluorescence boards: (a) excitation and (b) detection.
Proceedings 02 00128 g004
Figure 5. (a) Array layout: spots 1 and 2 correspond to gluten printed at 1 mg/mL and spots 3 and 4 correspond to ovalbumin spots printed at 1 mg/mL; (b) Colorimetric image of a processed microarrray spots after incubating with 1 ppm of gluten and developing for 3 min with TMB. Left spots corresponding to gluten spots whereas position of ovalbumin spots (negative control) rendering no signal are marked with a discontinuous circle on the right.
Proceedings 02 00128 g005
Figure 6. Gluten concentration signal versus developing time.
Proceedings 02 00128 g006
Publisher’s Note: MDPI stays neutral with regard to jurisdictional claims in published maps and institutional affiliations.

