1. Introduction
The grinding operation is of utmost importance in the machining process, which has the main goal of improving the surface finishing and of ensuring the integrity of the parts. Such manufacturing operation is considered as a complex process due to several factors, such as the workpiece, the machine, the grinding wheel and the parameters of the process itself [
1,
2].
Vibrations from external or internal sources can damage the quality of the workpiece surface during the machining process. Such disorders are commonly caused by self-excited vibration, also labelled as chatter. In the machining process, the contact between the cutting tool and the workpiece surface generates little waves, which can provoke self-excited vibration. Some factors, such as high rates of material removal, imbalance and eccentricity of the grinding wheel, can contributes for the chatter occurrence. Usually, in the grinding process, the chatter phenomenon occurs by means of vibrations with higher magnitude, close to the harmonic vibrations of the workpiece and of the grinding wheel, which compromise the quality of the workpiece surface [
3,
4,
5,
6].
The chatter phenomenon can be detected by direct monitoring methods, such as surface roughness measurements, visual inspection, among others. Such methods spend much time and present high costs, which make their utilization unfeasible for some applications. The chatter detection in the grinding process can be conducted mainly from force, acoustic emission (AE) and vibration signals measurements [
5,
6]. In this context, according to research by Martins et al. [
2], the indirect monitoring methods stand out, estimating the value of the desired variable by means of interest characteristics and extracted signal processing from the monitored process.
The objective of this research work is monitoring the occurrence onset of the chatter phenomenon in the grinding process by using aluminum oxide grinding wheel and SAE 1045 steel by means of vibration signals and digital signal processing techniques. The present paper differs from previous ones, such as the research conducted by Ahrens et al. [
3,
7], Yan et al. [
4,
8] and Gradišek et al. [
6], because here it was applied the Ratio of Power (ROP) statistical parameter to detect such phenomenon, characterizing a novel approach for the chatter monitoring.
2. Chatter Monitoring in the Grinding Process
The recognition of the chatter phenomenon, albeit appears to be an easy assignment for a trained operator, consists in a tough task to be performed automatically by a monitoring system [
6]. Certain works in literature studied this issue, which are mentioned next.
n research conducted by Ahrens et al. [
7], the automatic detection of chatter in the cylindrical grinding process is investigated by using a set of sensors. In research carried out by Ahrens et al. [
3], a method to compensate the chatter was proposed, in which stabilization and prevention of such phenomenon in the grinding process was ensured. The use of the entropy, which is calculated by the power spectrum, and the use of coarse-grained information rate (CIR), which is calculated by fluctuations of the AE signals, were studied in research conducted by Gradišek et al. [
6]. In these mentioned works, the frequency spectrum of the signals was considered. However, the use of the ROP parameter is unpublished for this purpose and was given in research carried out by Martins et al. [
2] and Ribeiro et al. [
9] by Equation (1):
where
N is the size of a block of the sampled signal during the machining,
n1 and
n2 correspond to the frequency range to analyze, and
Xk represents the
kth Discrete Fourier Transform (DFT) output.
3. Material and Methods
Previously to the final test, preliminary tests were conducted to define the best grinding parameters that characterized the chatter occurrence. Therefore, an experimental test bench was mounted and configured, assuring the quality of the process variables acquisition. Processing of such variables were performed in Matlab software. In the following sections, information about the materials and methodology used in this work are presented.
3.1. Material and Equipments
The tests were performed by using a surface grinding machine, RAPH 1055 model from Sulmecânica, which was equipped with an aluminum oxide grinding wheel, model 38A150LVH, manufactured by NORTON, with dimensions of 355 × 25.4 × 127 mm. A workpiece of AISI 1045 steel with dimensions of 150 × 7 × 48 mm was used in the test to verify the chatter occurrence in the grinding process. The peripheral speed of the grinding wheel (Vs) was 29.0 m/s, the workpiece speed (Vw) 0.124 m/s and the depth of cut (a) 35 µm. To detect vibration signals, an accelerometer 353B03 model from PCB Piezotronics was used. Such sensor was attached to the workpiece holder, perpendicular to the machined surface, and connected to an amplifier module with gain of 20 dB. The amplifier module was connected to an oscilloscope model DL850, from Yokogawa, and signals were collected at a sampling rate of 2 MS/s.
3.2. Visual Inspection of the Workpiece Surface
After the grinding test, a Scanjet G4050 from HP was used to obtain digital image of the workpiece surface for visual inspection, in a similar procedure performed by research conducted by Ribeiro [
10]. From such image, the workpiece surface was inspected and a digital processing was conducted on the image to improve visualization of the chatter. The processed image was analyzed and two regions of the workpiece were selected for study: region with no chatter and region with chatter. In this way, based on the area where chatter was identified, the period occurrence was estimated and, finally, a frequency for the chatter occurrence was obtained.
3.3. Digital Signal Processing
Before calculating frequencies spectra of the vibration signal, which were initially collected at 2 MS/s, it was resampled at 100 kS/s, since the sensor manufacturer ensures its calibration to frequencies up to 7 kHz. To this end, before resampling the signal, a Butterworth low-pass filter, 30th order and cutoff frequency of 7 kHz, was applied to the raw vibration signal, avoiding aliasing effect in the resampling process.
3.4. Obtaining Frequency Spectra and ROP Values
From visual inspection and resampled vibration signal, two data vectors were selected: one corresponding to the workpiece region without chatter and another corresponding to the region with chatter. For each condition, the frequency spectrum was obtained through the Fast Fourier Transform (FFT), using the Hanning window. Moreover, the frequency spectrum was obtained for the entire vibration signal, relating it to the machining pass. The entire signal, when analyzed in the frequency domain, presents the whole information about the process. From the frequency spectra, the frequency band that presented the best correlation with the chatter occurrence was selected, which was of 1200–1500 Hz. Next, the ROP value for each condition (chatter and no chatter) was computed from the data selected for these conditions within the selected band with respect to the data corresponding to the whole grinding pass.
4. Results and Discussion
In this section, results will be presented considering two main steps: (1) visual inspection of the workpiece surface to determine the chatter frequency from the image digital processing; and (2) digital processing of vibration signals to identify the characteristic frequencies of the chatter phenomenon.
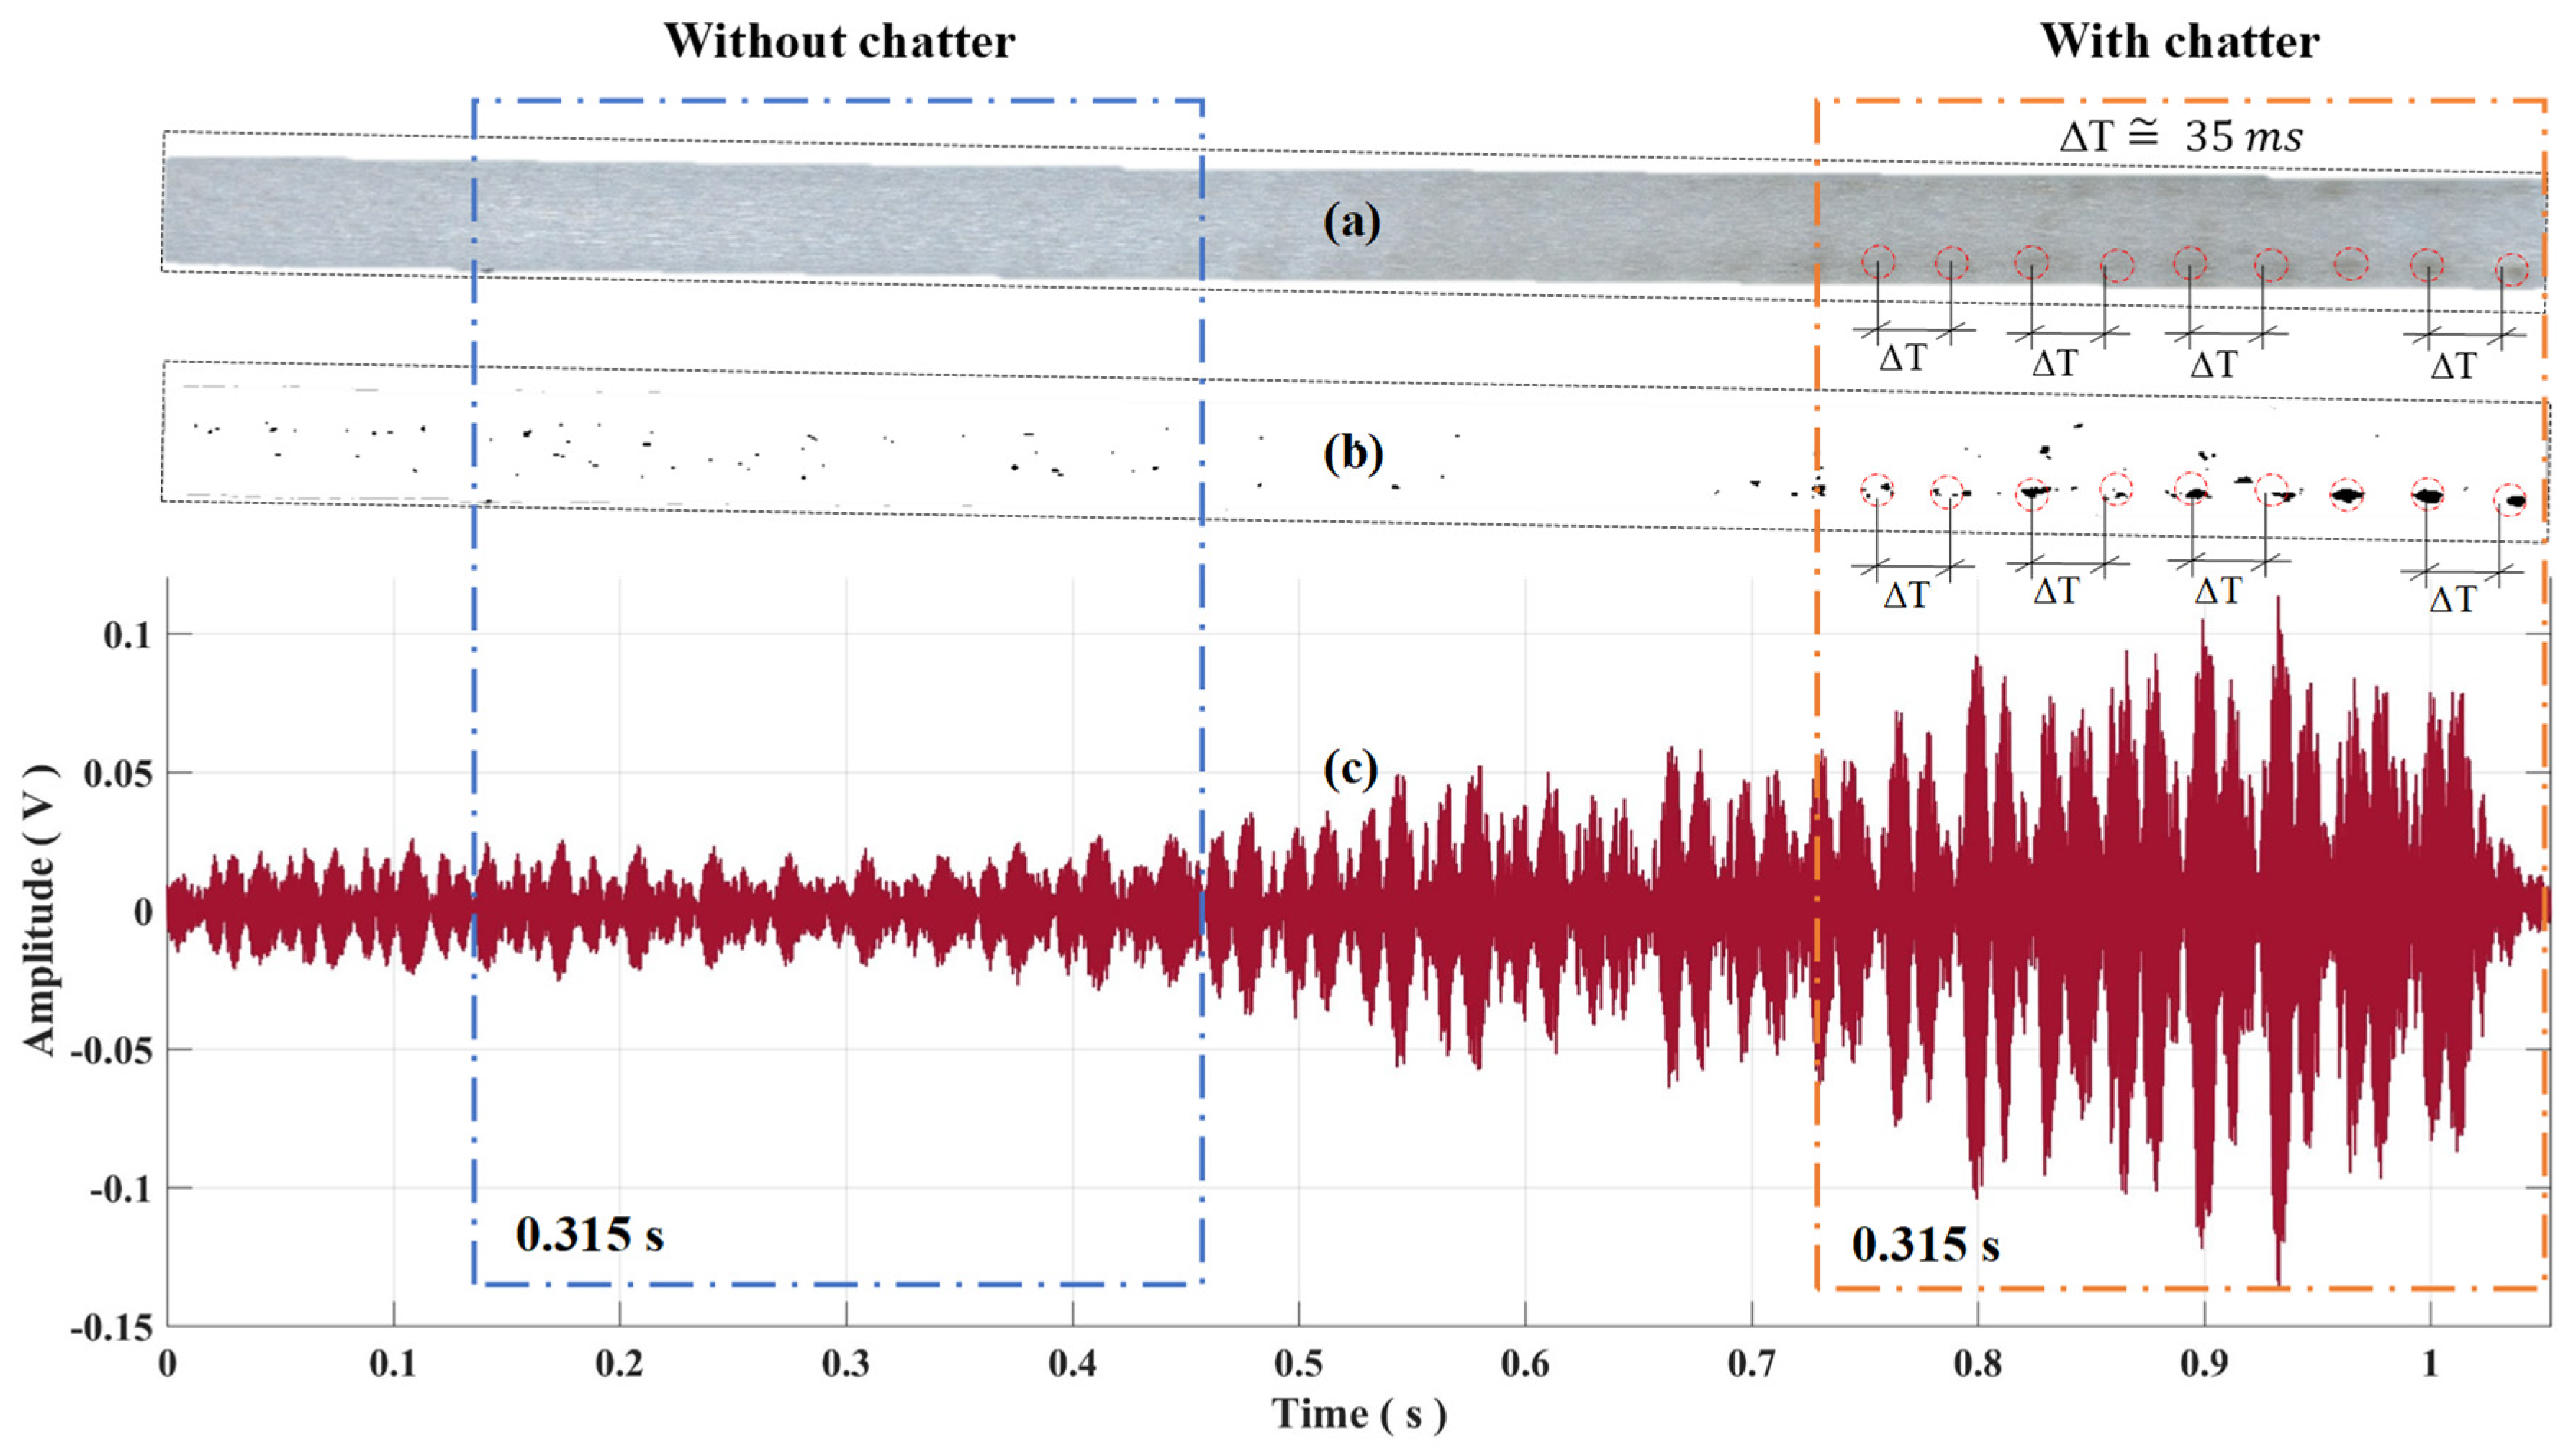
In
Figure 1, results from visual inspection of the workpiece surface are presented. The dashed rectangles emphasize the areas without chatter and with chatter. In
Figure 1a, an image of the captured surface is shown; in
Figure 1b, the result of the image processing is presented, in which chatter can be better observed. In
Figure 1c, the sampled vibration signal in the grinding test is presented.
It can be observed in
Figure 1a,b that the image of the workpiece for the area without chatter owns uniform color and the vibration signal has low magnitudes and little variation for this region. On the other hand, for the area with chatter occurrence, the image has variable color and signal has higher and more variable magnitudes in this region. Such color behavior of the workpiece surface and of the vibration signal magnitude characterize the chatter occurrence, evidencing an expressive relation between the chatter phenomenon and the vibration signal. Note that, in
Figure 1a,b, the chatter period is about 35 ms, which corresponds to a frequency of about 28.6 Hz, very close to the frequency of the grinding wheel rotation, as described in research conducted by Gradišek [
6].
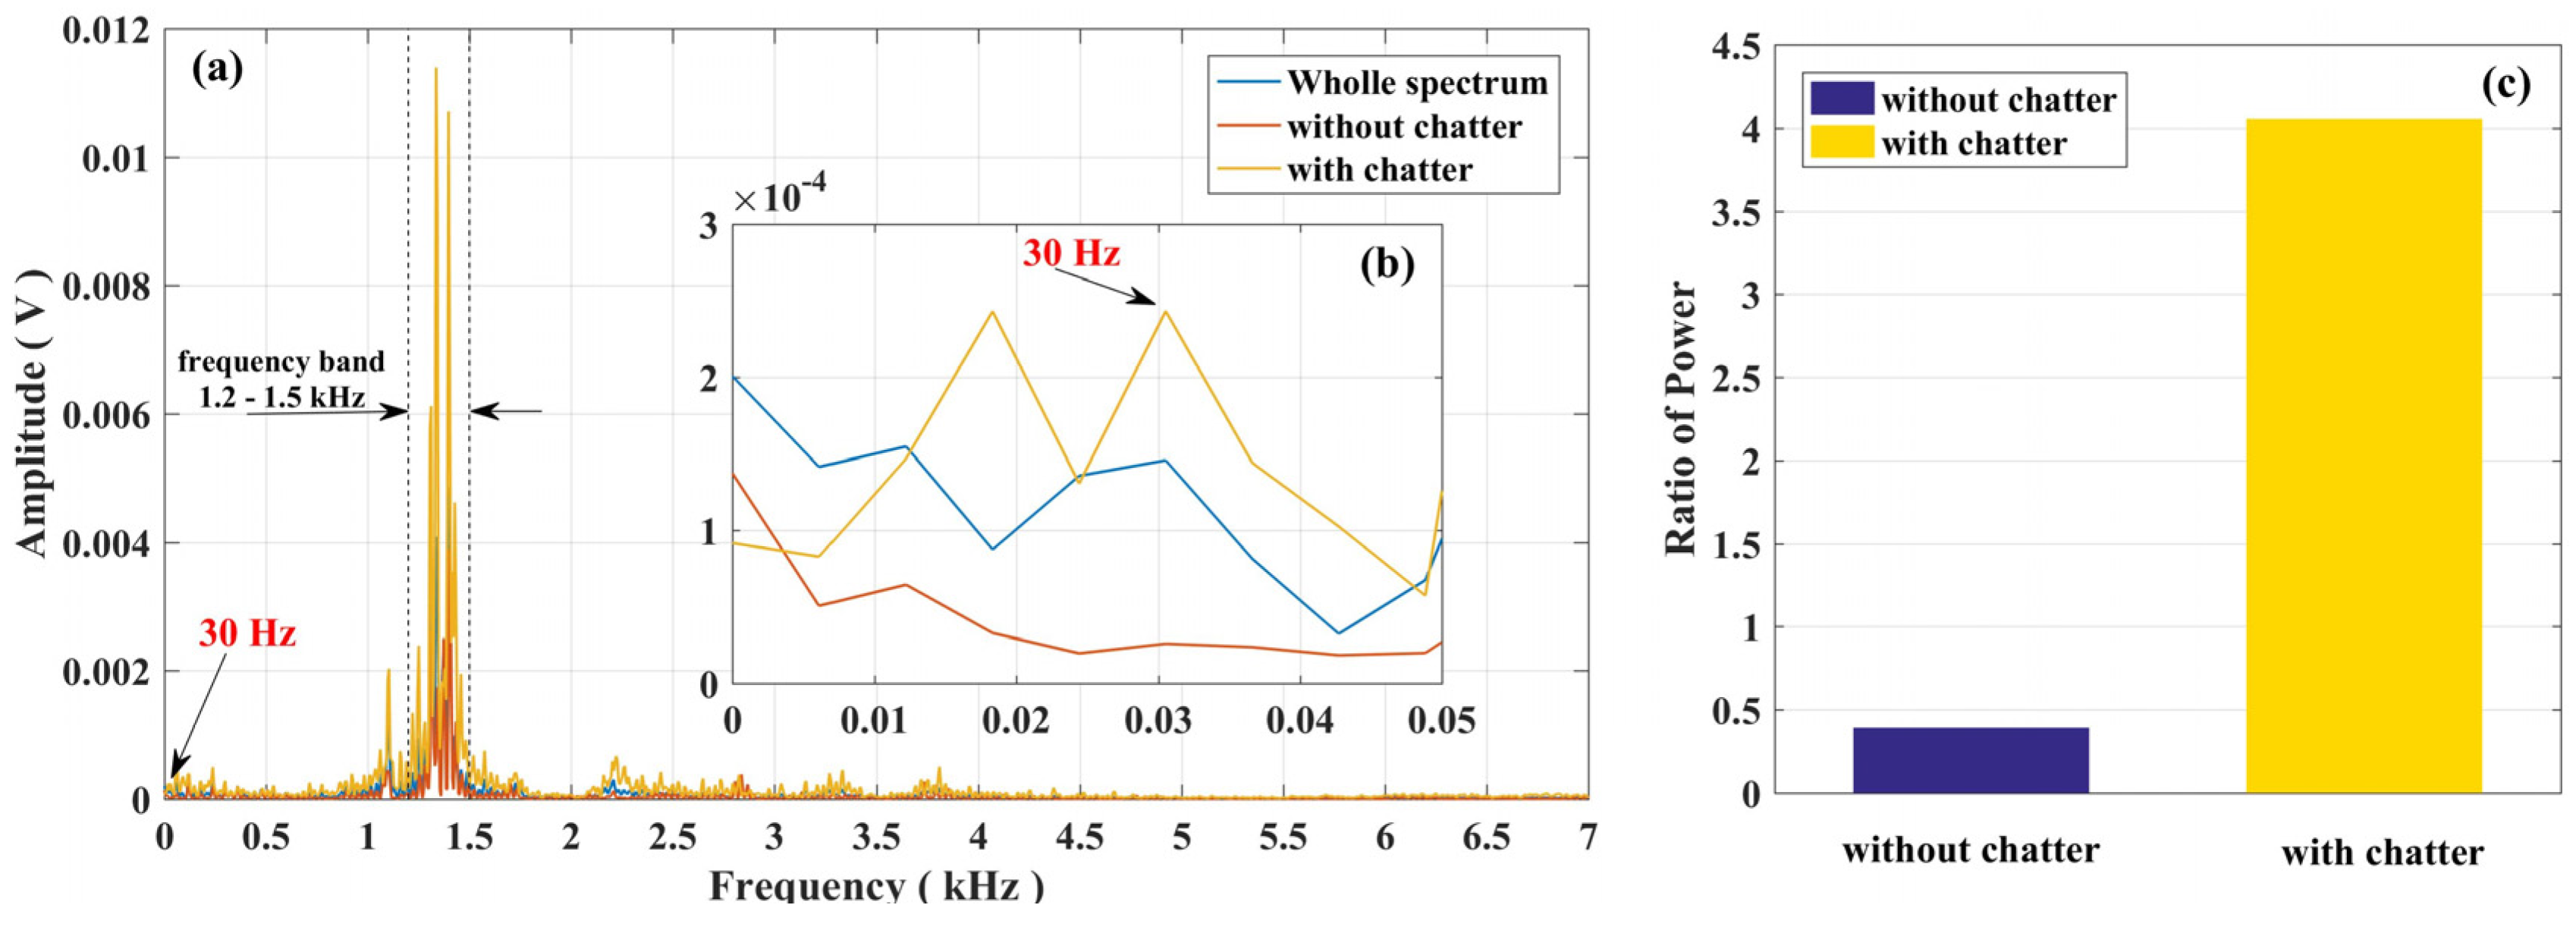
In
Figure 2a, three frequency spectra are shown: for the entire vibration signal, for the section without chatter and for the section with chatter. In
Figure 2b, a magnification is exhibited for the frequency range of 0–50 Hz. In
Figure 2c, the results of the ROP calculation are presented for vibration signals without chatter and with chatter.
Note that, in
Figure 2b, the energy difference between the spectra without and with chatter in the frequency range of 25–35 Hz presented significant levels. Such result is in accordance with the statement in research conducted by Gradišek [
6] and also with the result obtained from the visual inspection. In
Figure 2b, the vibration signal without chatter presented low magnitudes for the frequency range around the frequency of the grinding wheel (30 Hz). Conversely, when chatter occurs, magnitudes in this frequency range increase significantly, including the frequency of the grinding wheel rotation.
It can be observed in
Figure 2a that the frequency range 1.2–1.5 kHz, indicated by the two dashed vertical lines, presents the higher amplitude variations when chatter occurs. Besides, in this frequency range, frequencies that are multiple of the grinding wheel rotation are observed. For this reason, such frequency range was used to calculate the ROP values that were shown in
Figure 2c.
Figure 2c shows distinct values for the ROP statistic of about 0.5 and 4, which correspond to the non-chatter and chatter conditions, respectively. Thus, the ROP value for the vibration signal with chatter occurrence is about 800% higher than that without chatter. This fact is due to the magnitudes increase of the frequencies that are related to the chatter occurrence. The increase in magnitude of these frequencies are related to the increase of force in the contact area between the workpiece surface and the grinding wheel. When there is not chatter occurrence, the contact force between such structures is uniform and the amplitudes in the frequencies that are related to chatter are lower and uniform. In contrast, when chatter occurs, the contact force is higher and variable. Therefore, the magnitude of the frequencies that are related to the chatter phenomenon increases significantly and also presents varying behavior.
5. Conclusions
This research work presents an indirect monitoring technique for the chatter phenomenon during the grinding process. A spectral study of the vibration signal and the application of the ROP statistical parameter in a specific band previously selected were performed. Results showed that the frequencies corresponding to the chatter phenomenon have strong relation to the frequency of the grinding wheel rotation. Furthermore, the results indicate that the frequencies that are multiple of the frequency of the grinding wheel rotation are also sensitive to the chatter occurrence. The ROP applied to a frequency band that owns frequencies multiple of the grinding wheel frequency allowed classifying areas on the workpiece surface without and with chatter occurrence and, possibly, can be employed to monitor such phenomenon. It is important to highlight that the approach related in this paper is primary and, to validate the method for other conditions, additional studies are necessary.


