Proceeding Paper

An Integrated Framework for Users’ Well-Being †

ITC-CNR, Construction Technologies Institute- National Research Council of Italy, Lombardia Str., 49-20098 San Giuliano M.se, Italy
*
Author to whom correspondence should be addressed.
Presented at the 4th International Electronic Conference on Sensors and Applications, 15–30 November 2017; Available online: http://sciforum.net/conference/ecsa-4.
Proceedings 2018, 2(3), 114; https://doi.org/10.3390/ecsa-4-04908
Published: 14 November 2017

Abstract

:
The hygro-thermal comfort (ICQ) is defined as the psychophysical state in which the subject expresses a condition of well-being with respect to environmental variables, a condition known as thermal neutrality. Furthermore, the ICQ represents one pillar of the holistic concept of the Indoor Environmental Quality (IEQ). The methods for the assessment of ICQ and recognized at international level are mainly two. The former, based on a steady-state approach, described by the EN ISO 7730:2005 and applied to Fully Mechanically Controlled buildings (FMC) equipped with an active conditioning system. The latter, based on an adaptive approach, as defined trough in field activities and described by the technical standard ASHRAE 55 and EN 15,251, instead, considers the users as active subjects that interact with surrounding environment and are influenced in their comfort perception by external conditions. In this case, the thermal comfort concept is not just defined depending on physical, but also psychological, social, economic and cultural aspects. The technical standards provides that this method could be applied in middle seasons when the control of comfort is handled by passive technological methods, i.e., in the so called Natural Ventilated or Free Running buildings (FR). In this approach, methodologies providing the direct involvement of the end user are consolidating, through the collection of physiological, psychological and behavioral personal data as to obtain the better assessment of the comfort conditions. Placing in this field, the article describes the results of a field investigation in an office aimed at defining a framework for the assessment of the thermal comfort based on the two approaches through the use of low cost technology solutions, parametric and freeware models.

1. Introduction

The Indoor thermal Comfort Quality (ICQ) is defined as the psychophysical satisfaction of a person immersed in a thermal environment [1]. The thermal comfort is influenced by six factors [2], summarized in two categories: four objective variables (air temperature, relative humidity, air velocity, and mean radiant temperature) and two subjective variables (metabolic activity and clothing). Over the years, several studies [3] have highlighted how the thermal sensation depends on further factors linked to human characteristics, e.g., age, gender, presence of pathologies, etc.. In order to consider these factors in the field of thermal comfort, further adaptive methods have been proposed based on the subjective response of the person to the thermal stimuli. At present, there are two different approaches to assess the thermal comfort: the thermal balance or rational method and the adaptive method [4]. The former is manly based on the experimentations carried out by Fanger on a sample of 1296 Danish students in quasi-steady state condition in specific climate controlled chambers. The participants were dressed in standard clothing and performed standard activities. The only variable was the exposure to different environmental conditions. Thanks to these experiments Fanger defined an equation able to describe the thermal comfort such as the imbalance between the current thermal flow of human body, in a given environment, and that corresponding to an optimal comfort in relation to a specific activity. This equation is called Predicted Mean Vote (PMV). Then PMV was incorporated in the Predicted Percentage of Dissatisfied (PPD) that expresses the percentage of dissatisfied as a function of thermal sensation perceived by the users. PMV and PPD indices are used to define the thermal comfort level of an environment.
In the adaptive approaches the main object of the analysis is the final users’ satisfaction in order to optimize the thermal acceptability of the indoor environment. An adaptive model is generally defined as a tool able to couple the internal temperature with the weather conditions (Standard ASHRAE 55 2013). The adaptation can be divided into three categories: behavioural, physiological and psychological [5]. The former includes all conscious and unconscious modifications that a person carries out by changing the heat and mass flows which regulate the thermal balance of comfort (change of clothing, use of air-conditioning systems, etc.). The physiological adaptation includes the changes in the physiological response with respect to the environmental exposure (acclimatization). The latter represents a wrong perception or a response to stimuli linked to past experiences.
This article describes a field of investigation carried out in an office to validate a framework used to define the differences between the traditional thermal comfort indicators and the adaptive approach based on the specific psychophysical conditions of the users.

2. Description of the Framework

The entire framework is composed by the following parts:
  • a monitoring system composed by:
    a nearable system (term composed by the words “near” and “wearable”) for the monitoring of the environmental parameters close to the user;
    a wearable system for the monitoring of subjective variables.
  • a web-based survey in which the individuals have the opportunity to indicate their thermal sensation (TSV, Thermal Sensation Vote);
  • a parametric model able to assess the ICQ.

2.1. Monitoring Systems

As indicated before the monitoring system is defined combing a nearable and a wearable devices. The nearable system is described in two papers [6,7]. It’s named “nano Environmental Monitoring System” (nEMoS) but, actually, nEMoS could stands for nearable Environmental Monitoring System. It is based on low-cost sensors and open-source hardware. The wearable system, consists of the following parts:
  • a microcontroller;
  • an e-Health sensor platform;
  • pulse and oxygen in blood (SPO2) sensor.
We have considered this wearable toolkit because it is cheap, extensible and flexible so, it can be upgraded rapidly by connecting some other health sensors. The typical installation of the considered monitoring system in an office desktop is reported in Figure 1.

2.2. Web Based Survey

The web based survey prepared according to the ASHRAE 55:2013 standard, has been submitted to the users and is realized considering a google forms model in order to records directly the feedback of the users in a google spreadsheet. The information requested for each users are: position occupied, performed activity, clothing, thermal sensation.
The analysis of the questionnaires allowed to determine the insulation levels related to the clothing and the thermal sensation of the individuals. The thermal resistance of the clothing was determined in compliance with annex C of standard EN ISO 7730:2005. Each clothing garment is characterized by a specific thermal resistance value, expressed in clo; the overall thermal resistance is the algebraic sum of the single value of thermal resistance. The standard provides an additional thermal resistance for sedentary activities due to the type of chair; it was considered an incremental value equal to 0.17 clo [8]. The thermal sensation is expressed on a scale between −3 and +3 corresponding to very cool and very hot, respectively, where the thermal neutrality is expressed by 0. The common activity of the users is “typing”.

2.3. Parametric Model

The parametric model is realized considering grasshopper, a graphical algorithm editor tightly integrated with Rhino’s 3-D modeling tools [9] and the following plugin:
  • Ladybug tools useful to assess the ICQ [10];
  • TT Toolbox able to import and export data from a generic database in .csv or .xls format [11].

3. Method of Evaluation of Comfort and First Application

3.1. Method of Evaluation of Comfort

The parametric model is useful to assess the ICQ based on:
PMV and PPD standard indices according to the algorithms described in Standard EN ISO 7730:2005.
Graphic Comfort Zone Method (GCZM) and Adaptive Chart (AC) according to the Standard ASHRAE 55-2013.
The wearable sensor is used to acquire the heart rate data in bpm in order to modify the metabolic rate values based on the revised approach [12] of the level 3 described in the ISO 8996.

3.2. First Application and Results

The system was installed in an office workstation, located on the first and top floor of a building, with an area of about 42 m2 (7.81 m × 5.37 m) normally occupied by four workers. In the application are considered only three of the four workstations occupied by users that were not directly involved in the development of the system in order to avoid any possible influences in the feedback in relation to the TSV (Figure 2).
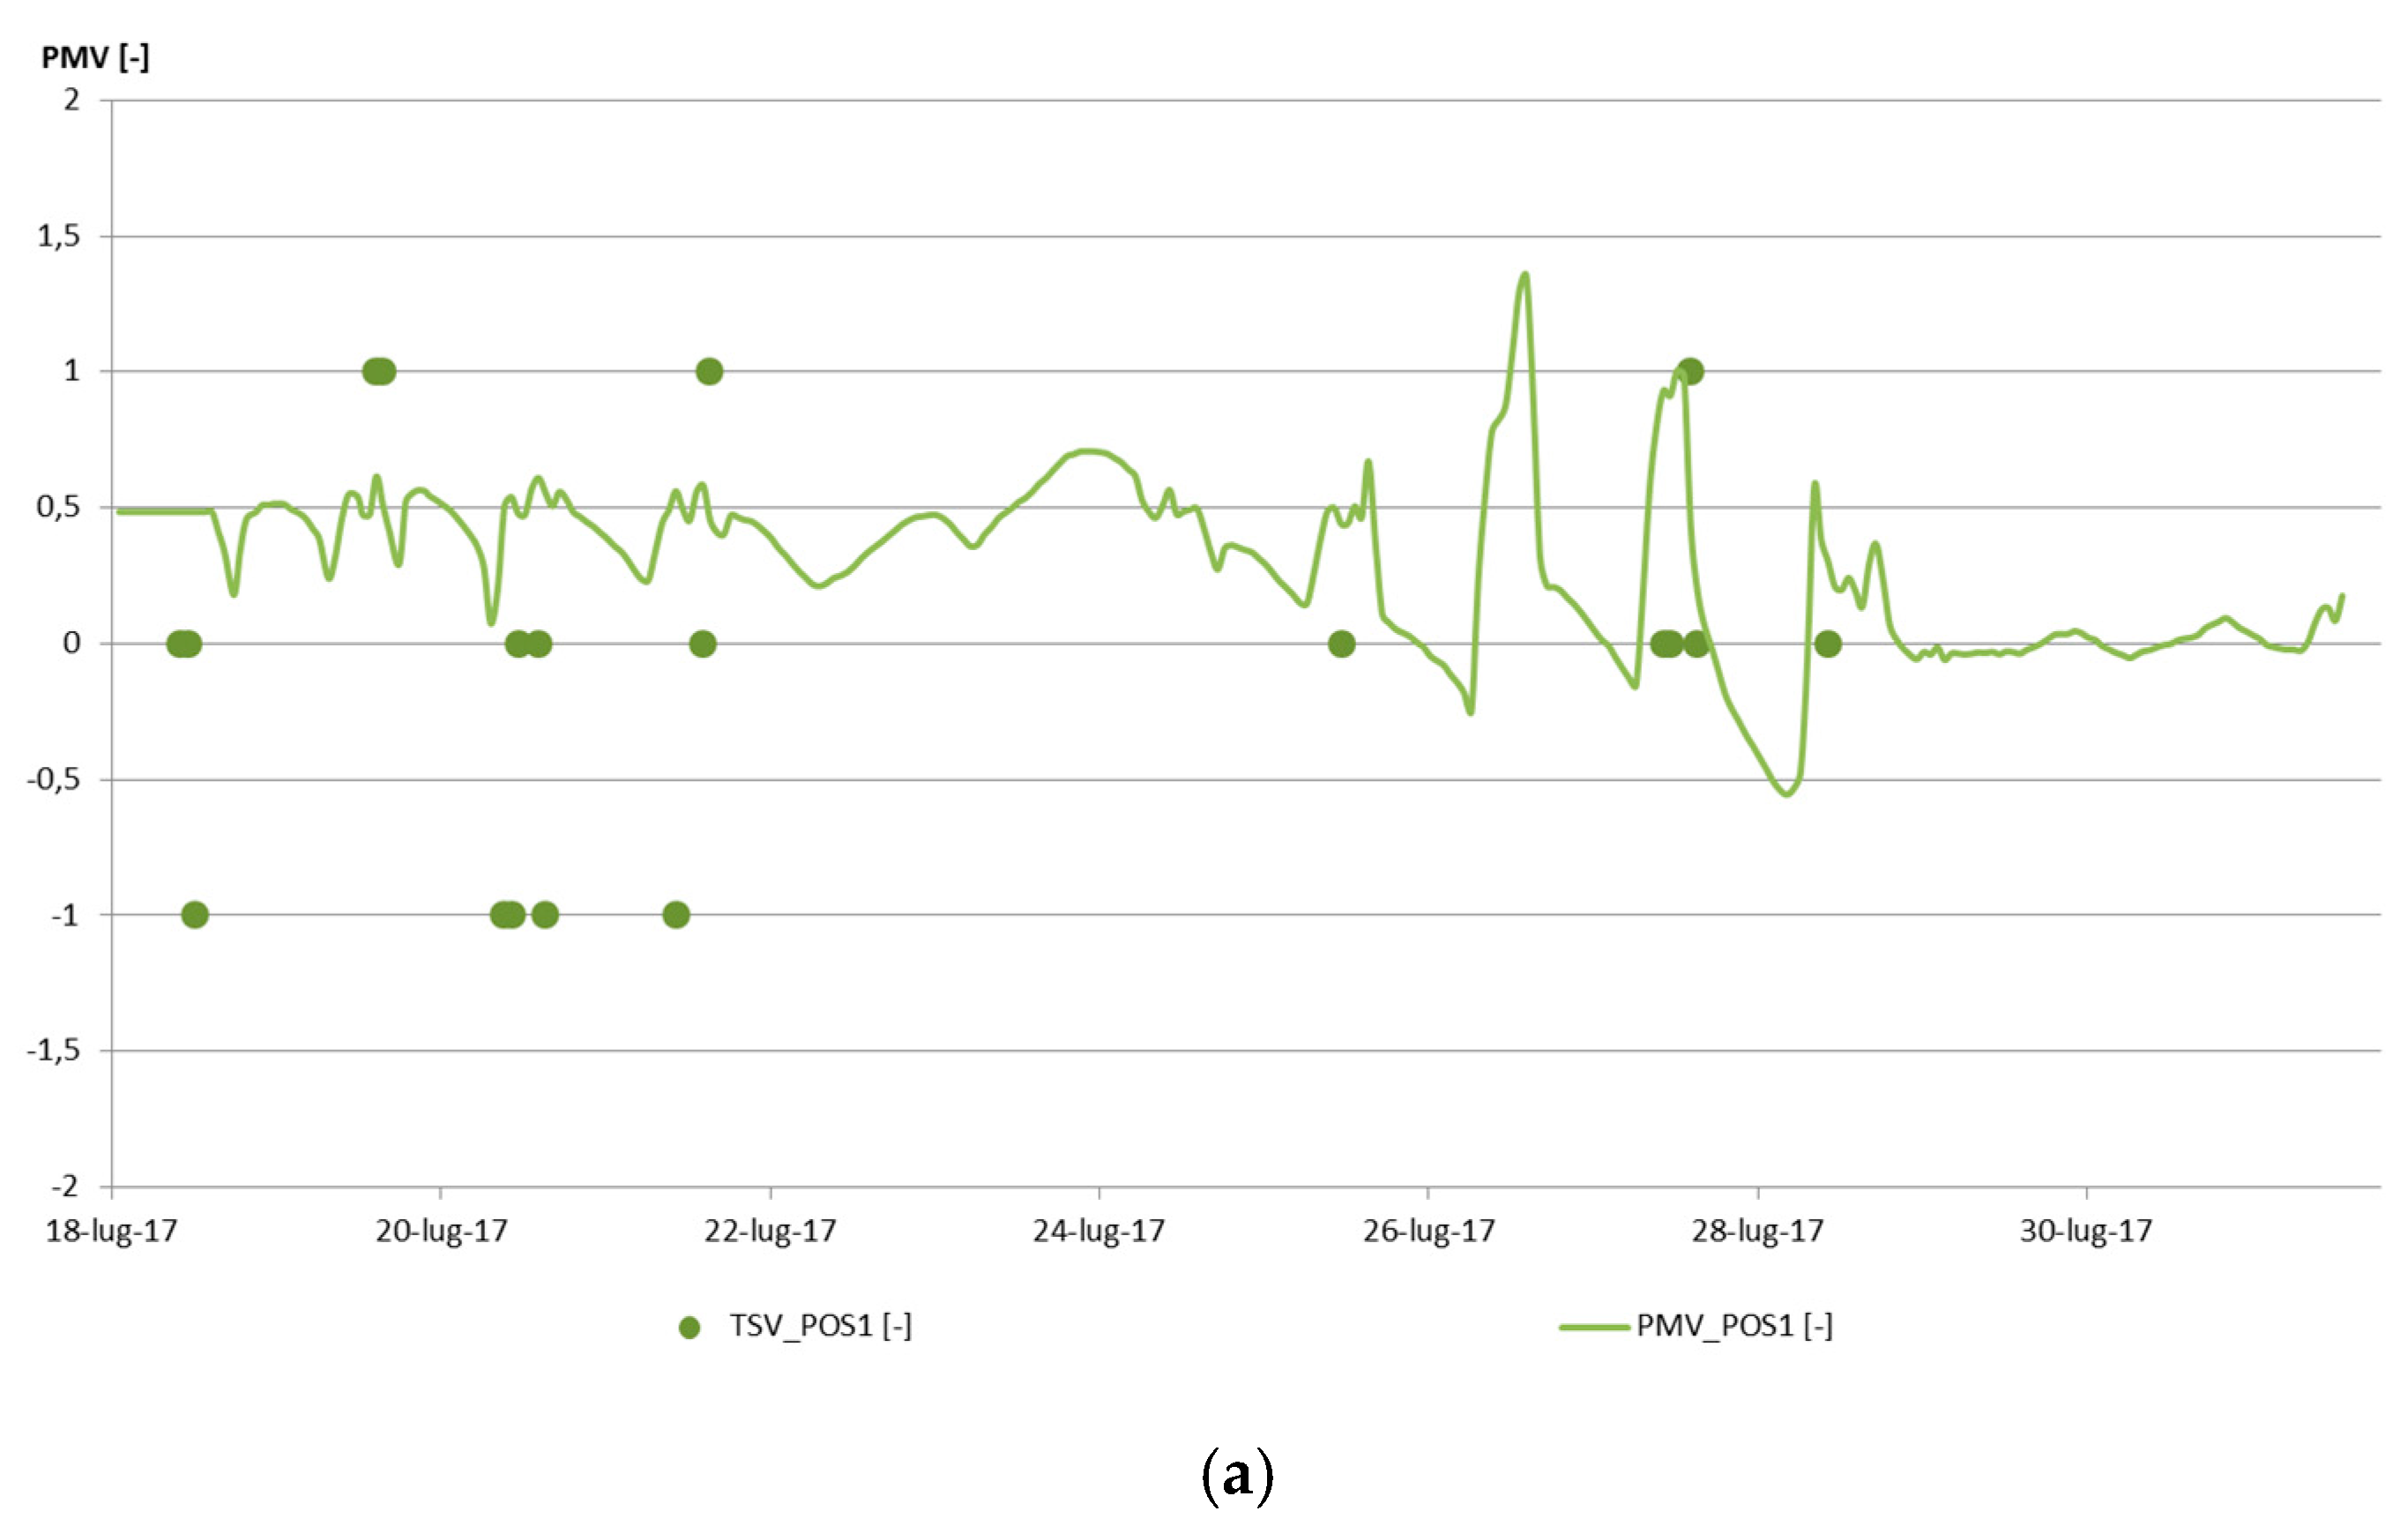
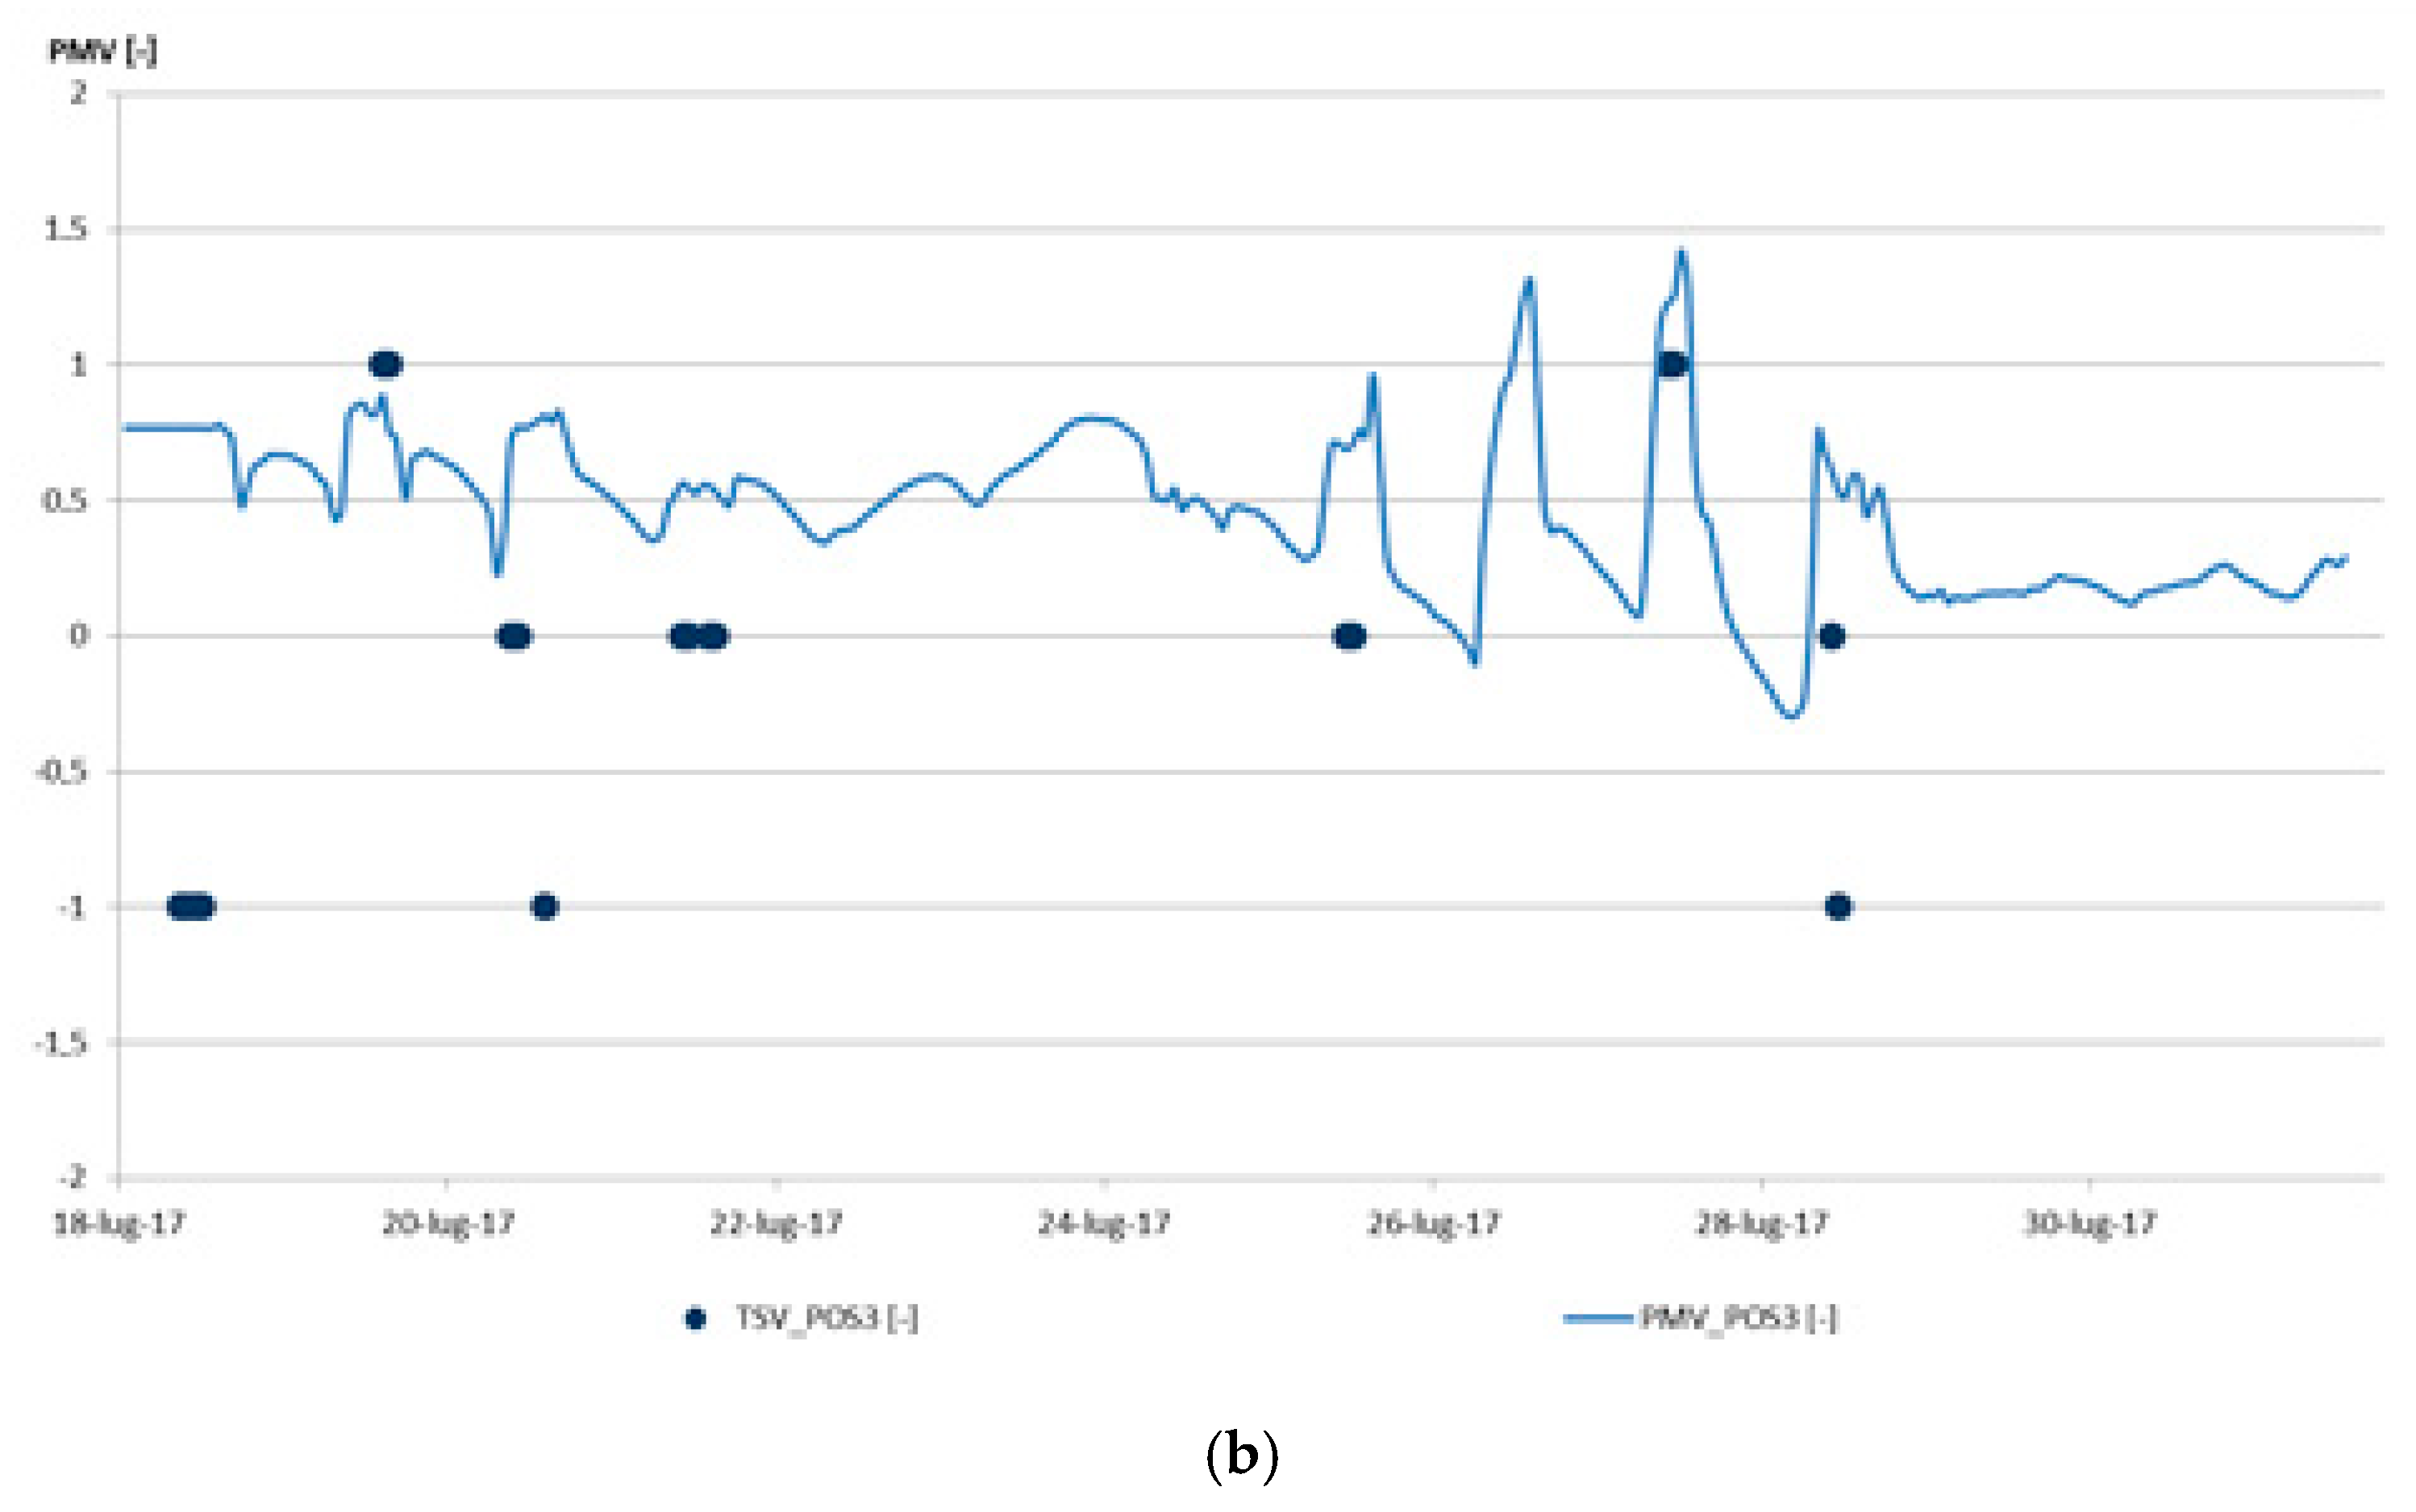
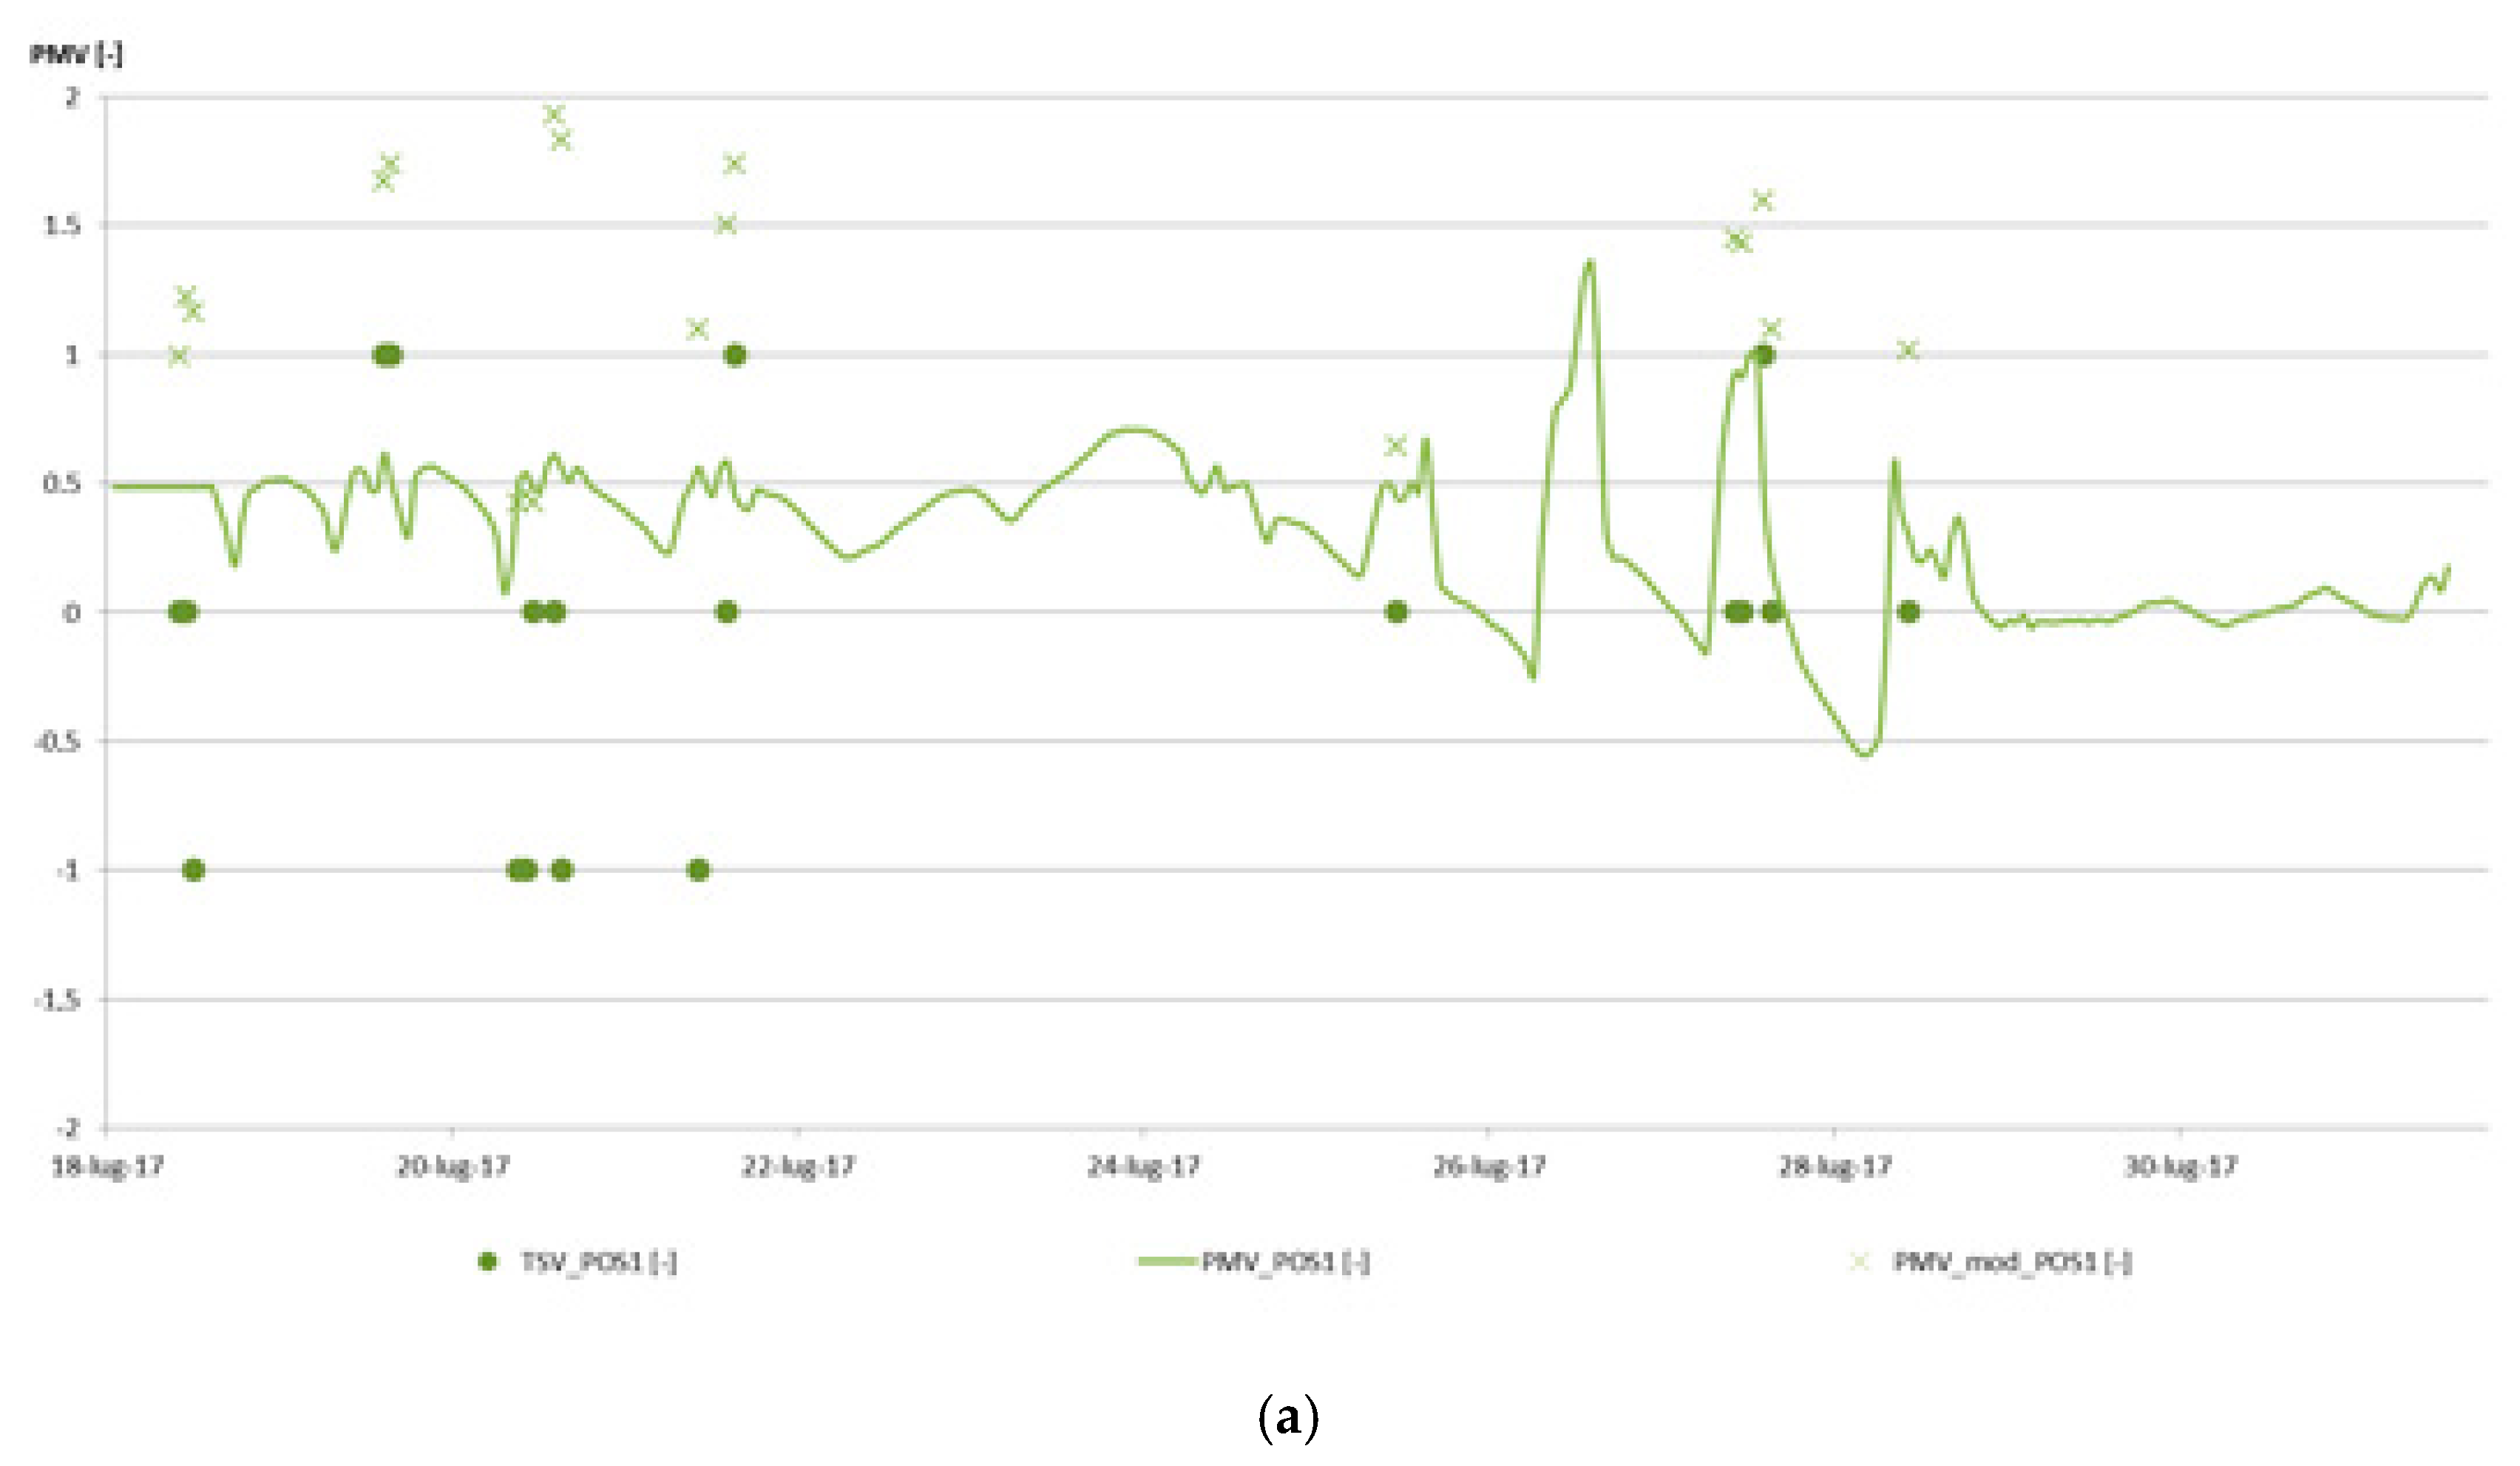
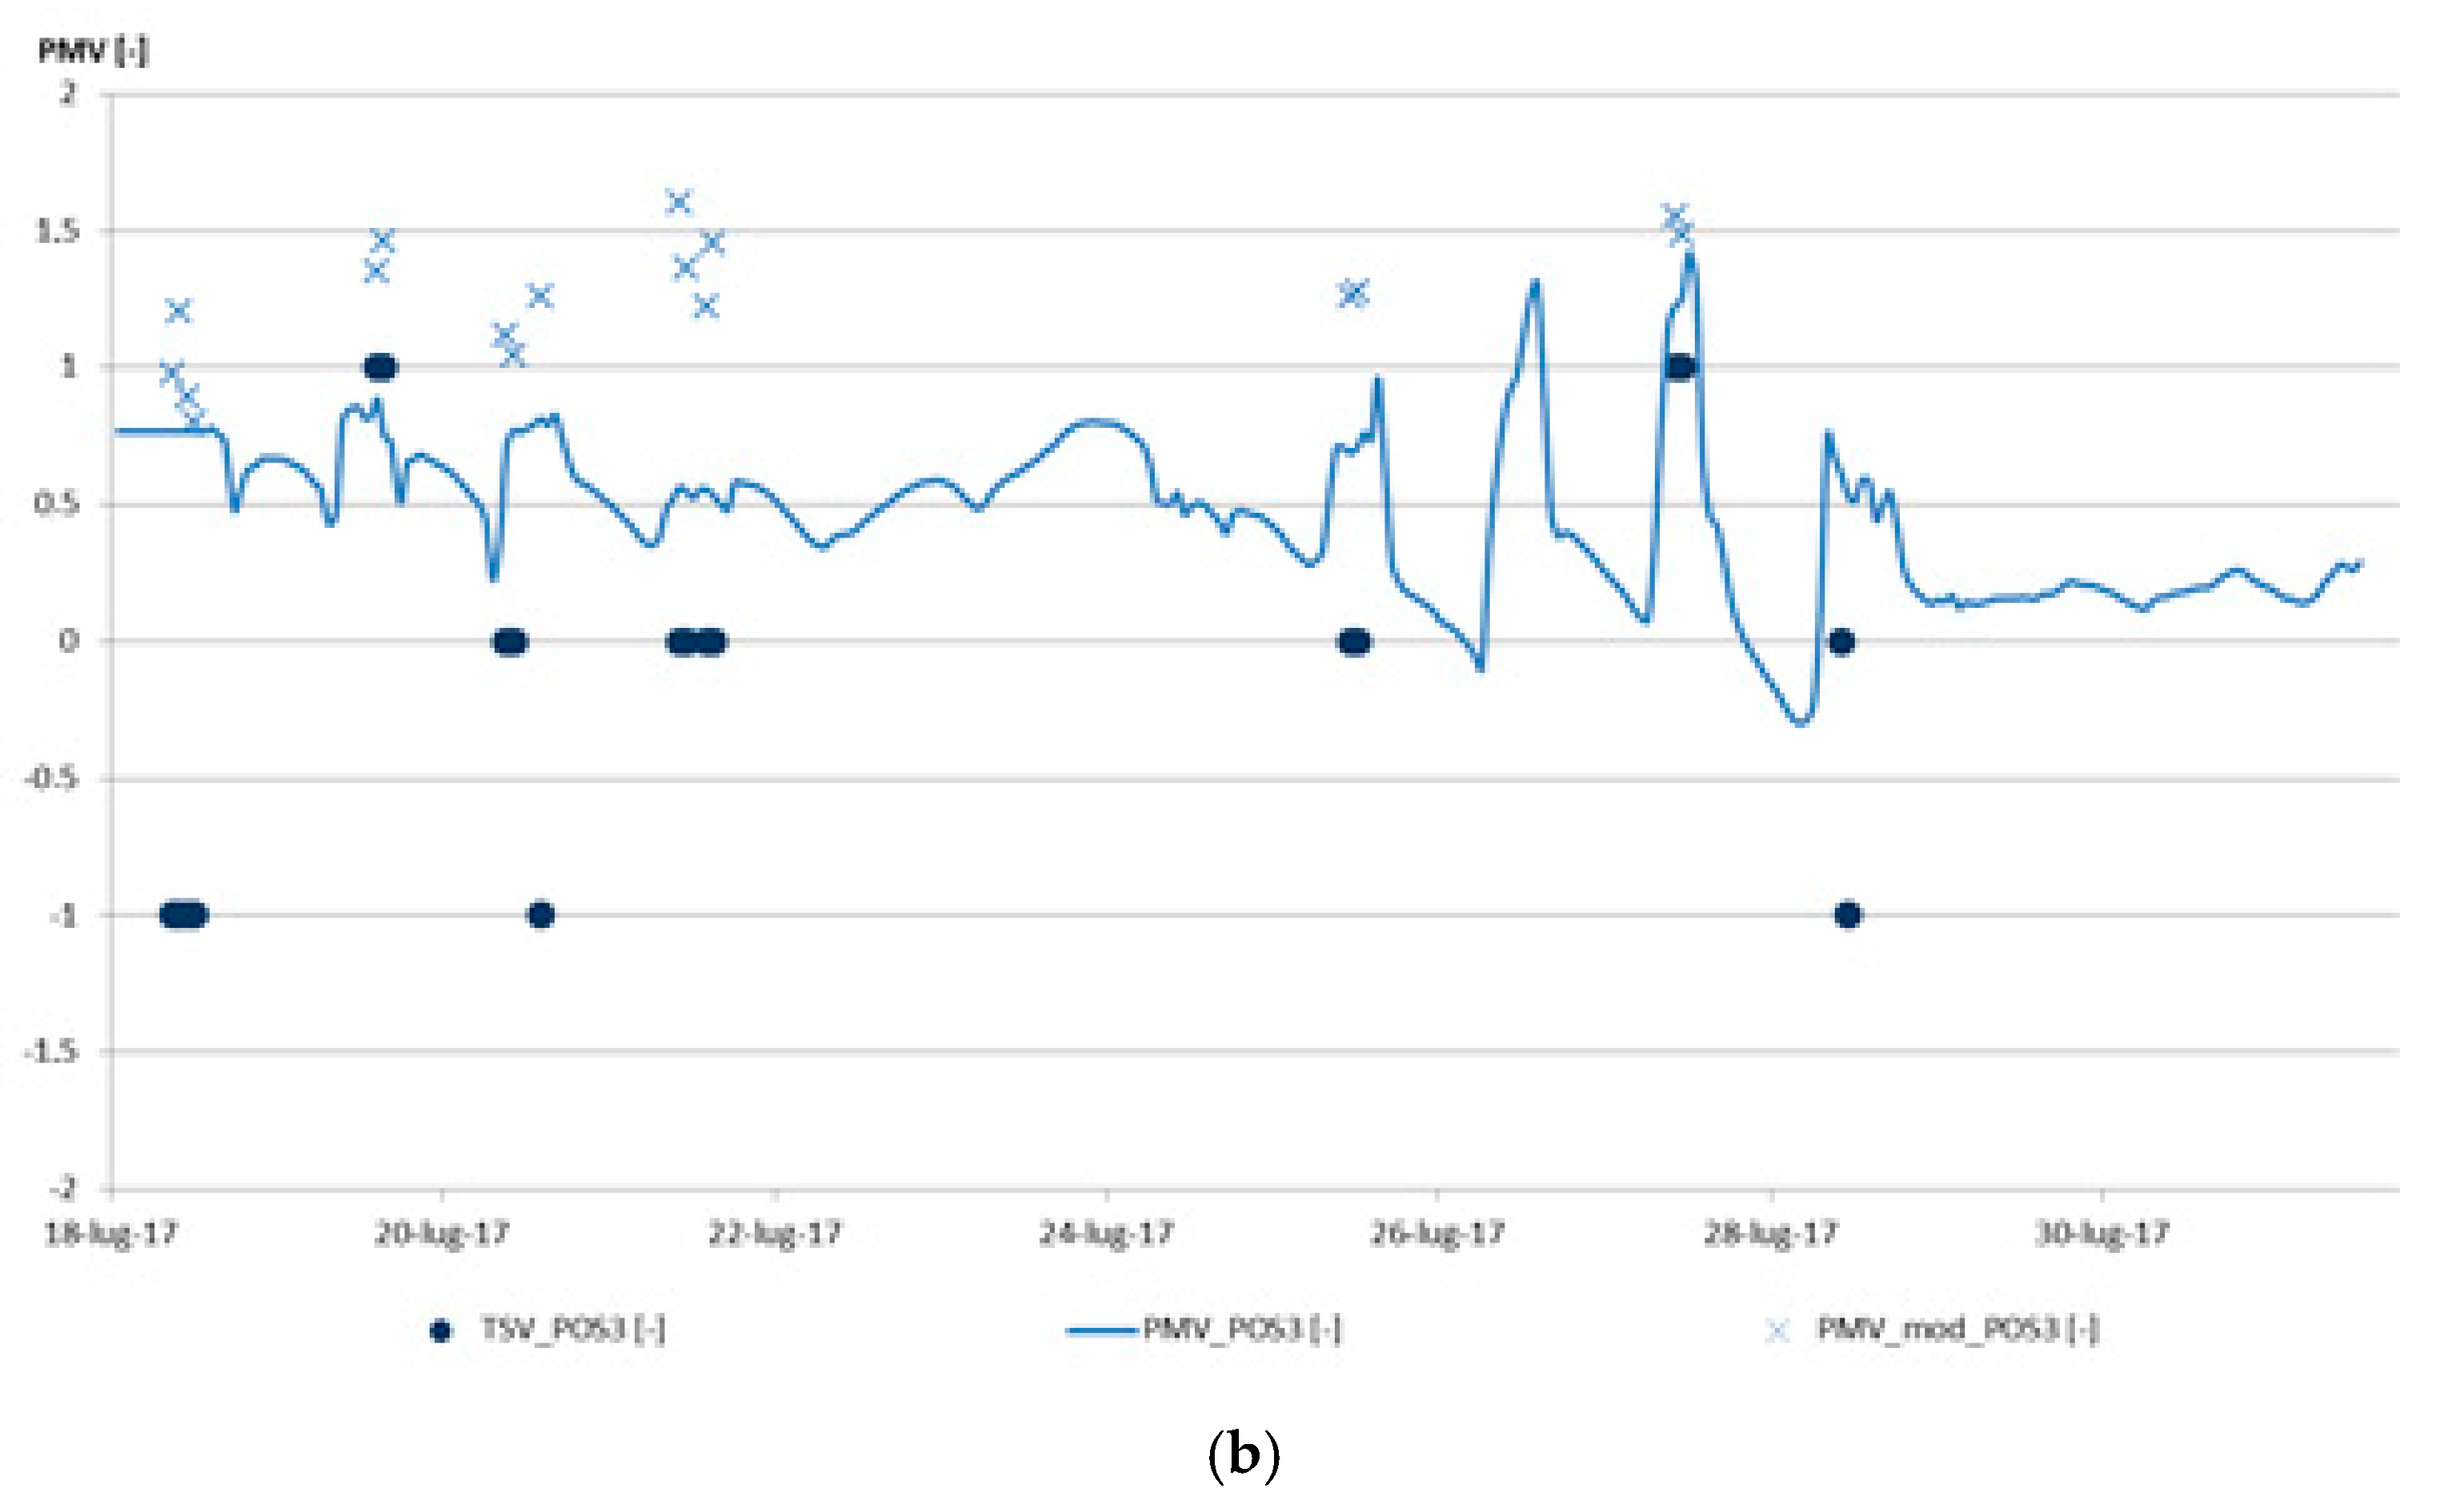
Figure 3 describes the differences in terms of PMV and TSV for the positions for which users have provided a considerable amount of data: Pos. 1 and Pos. 3.
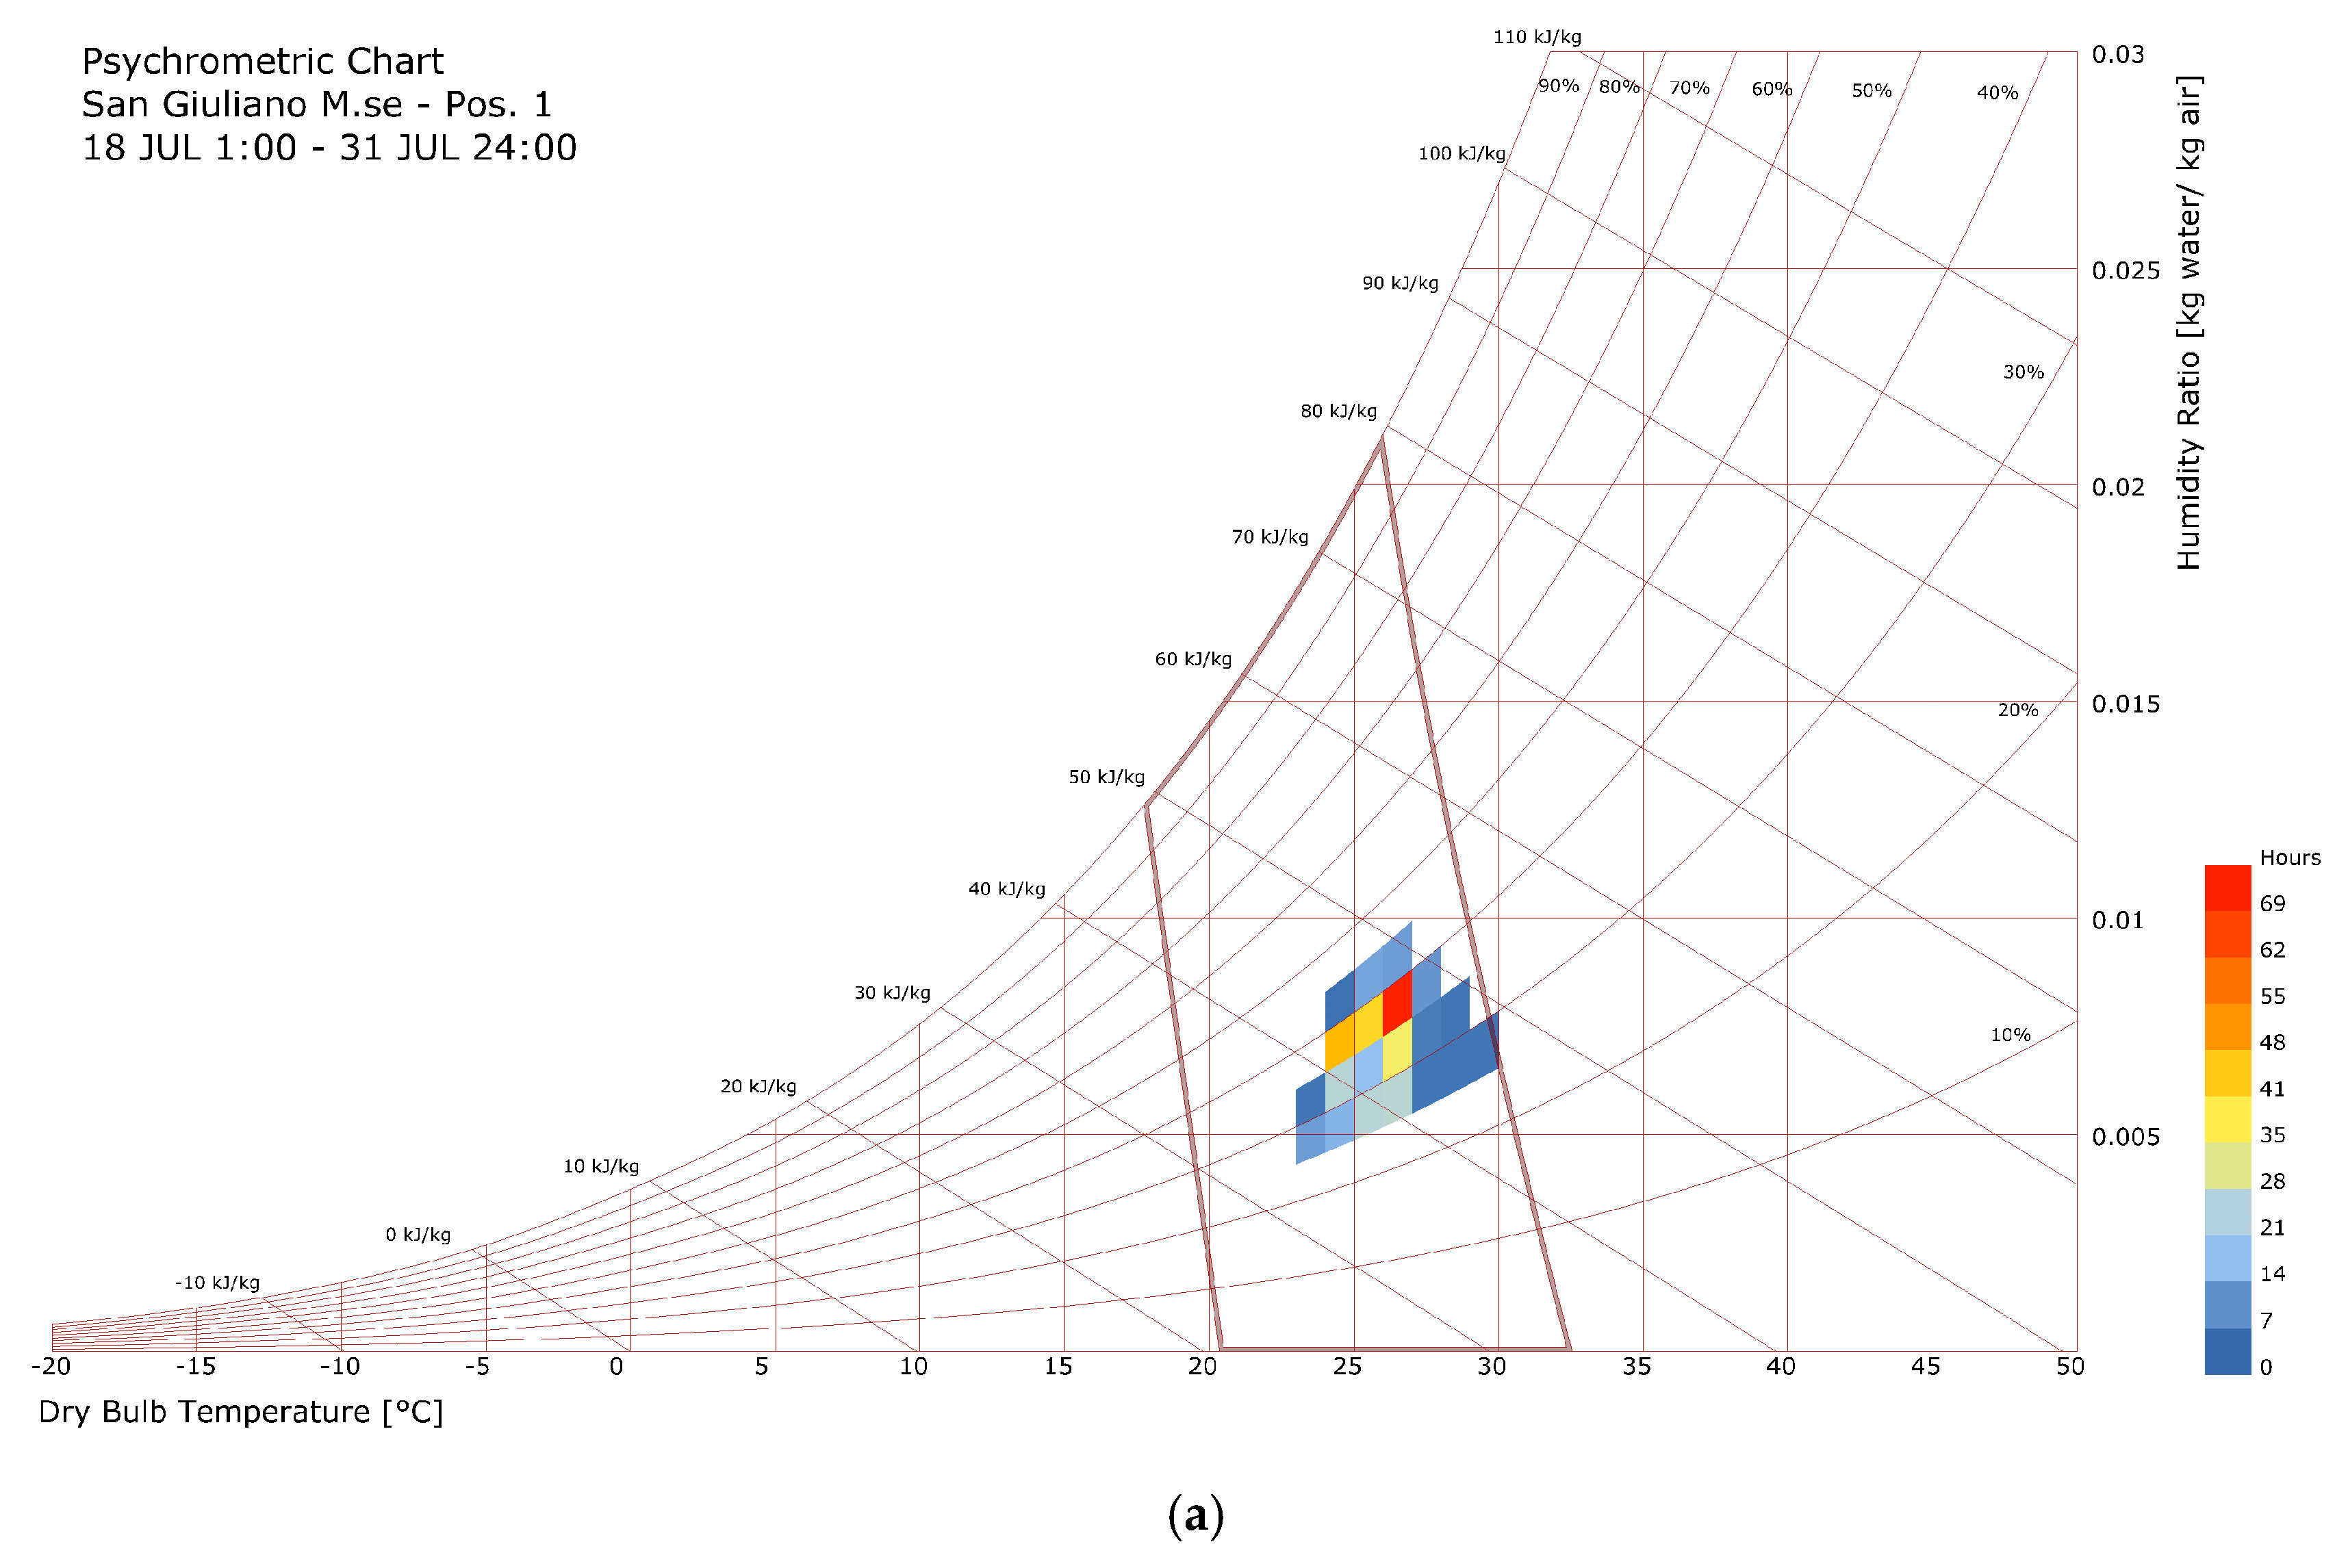
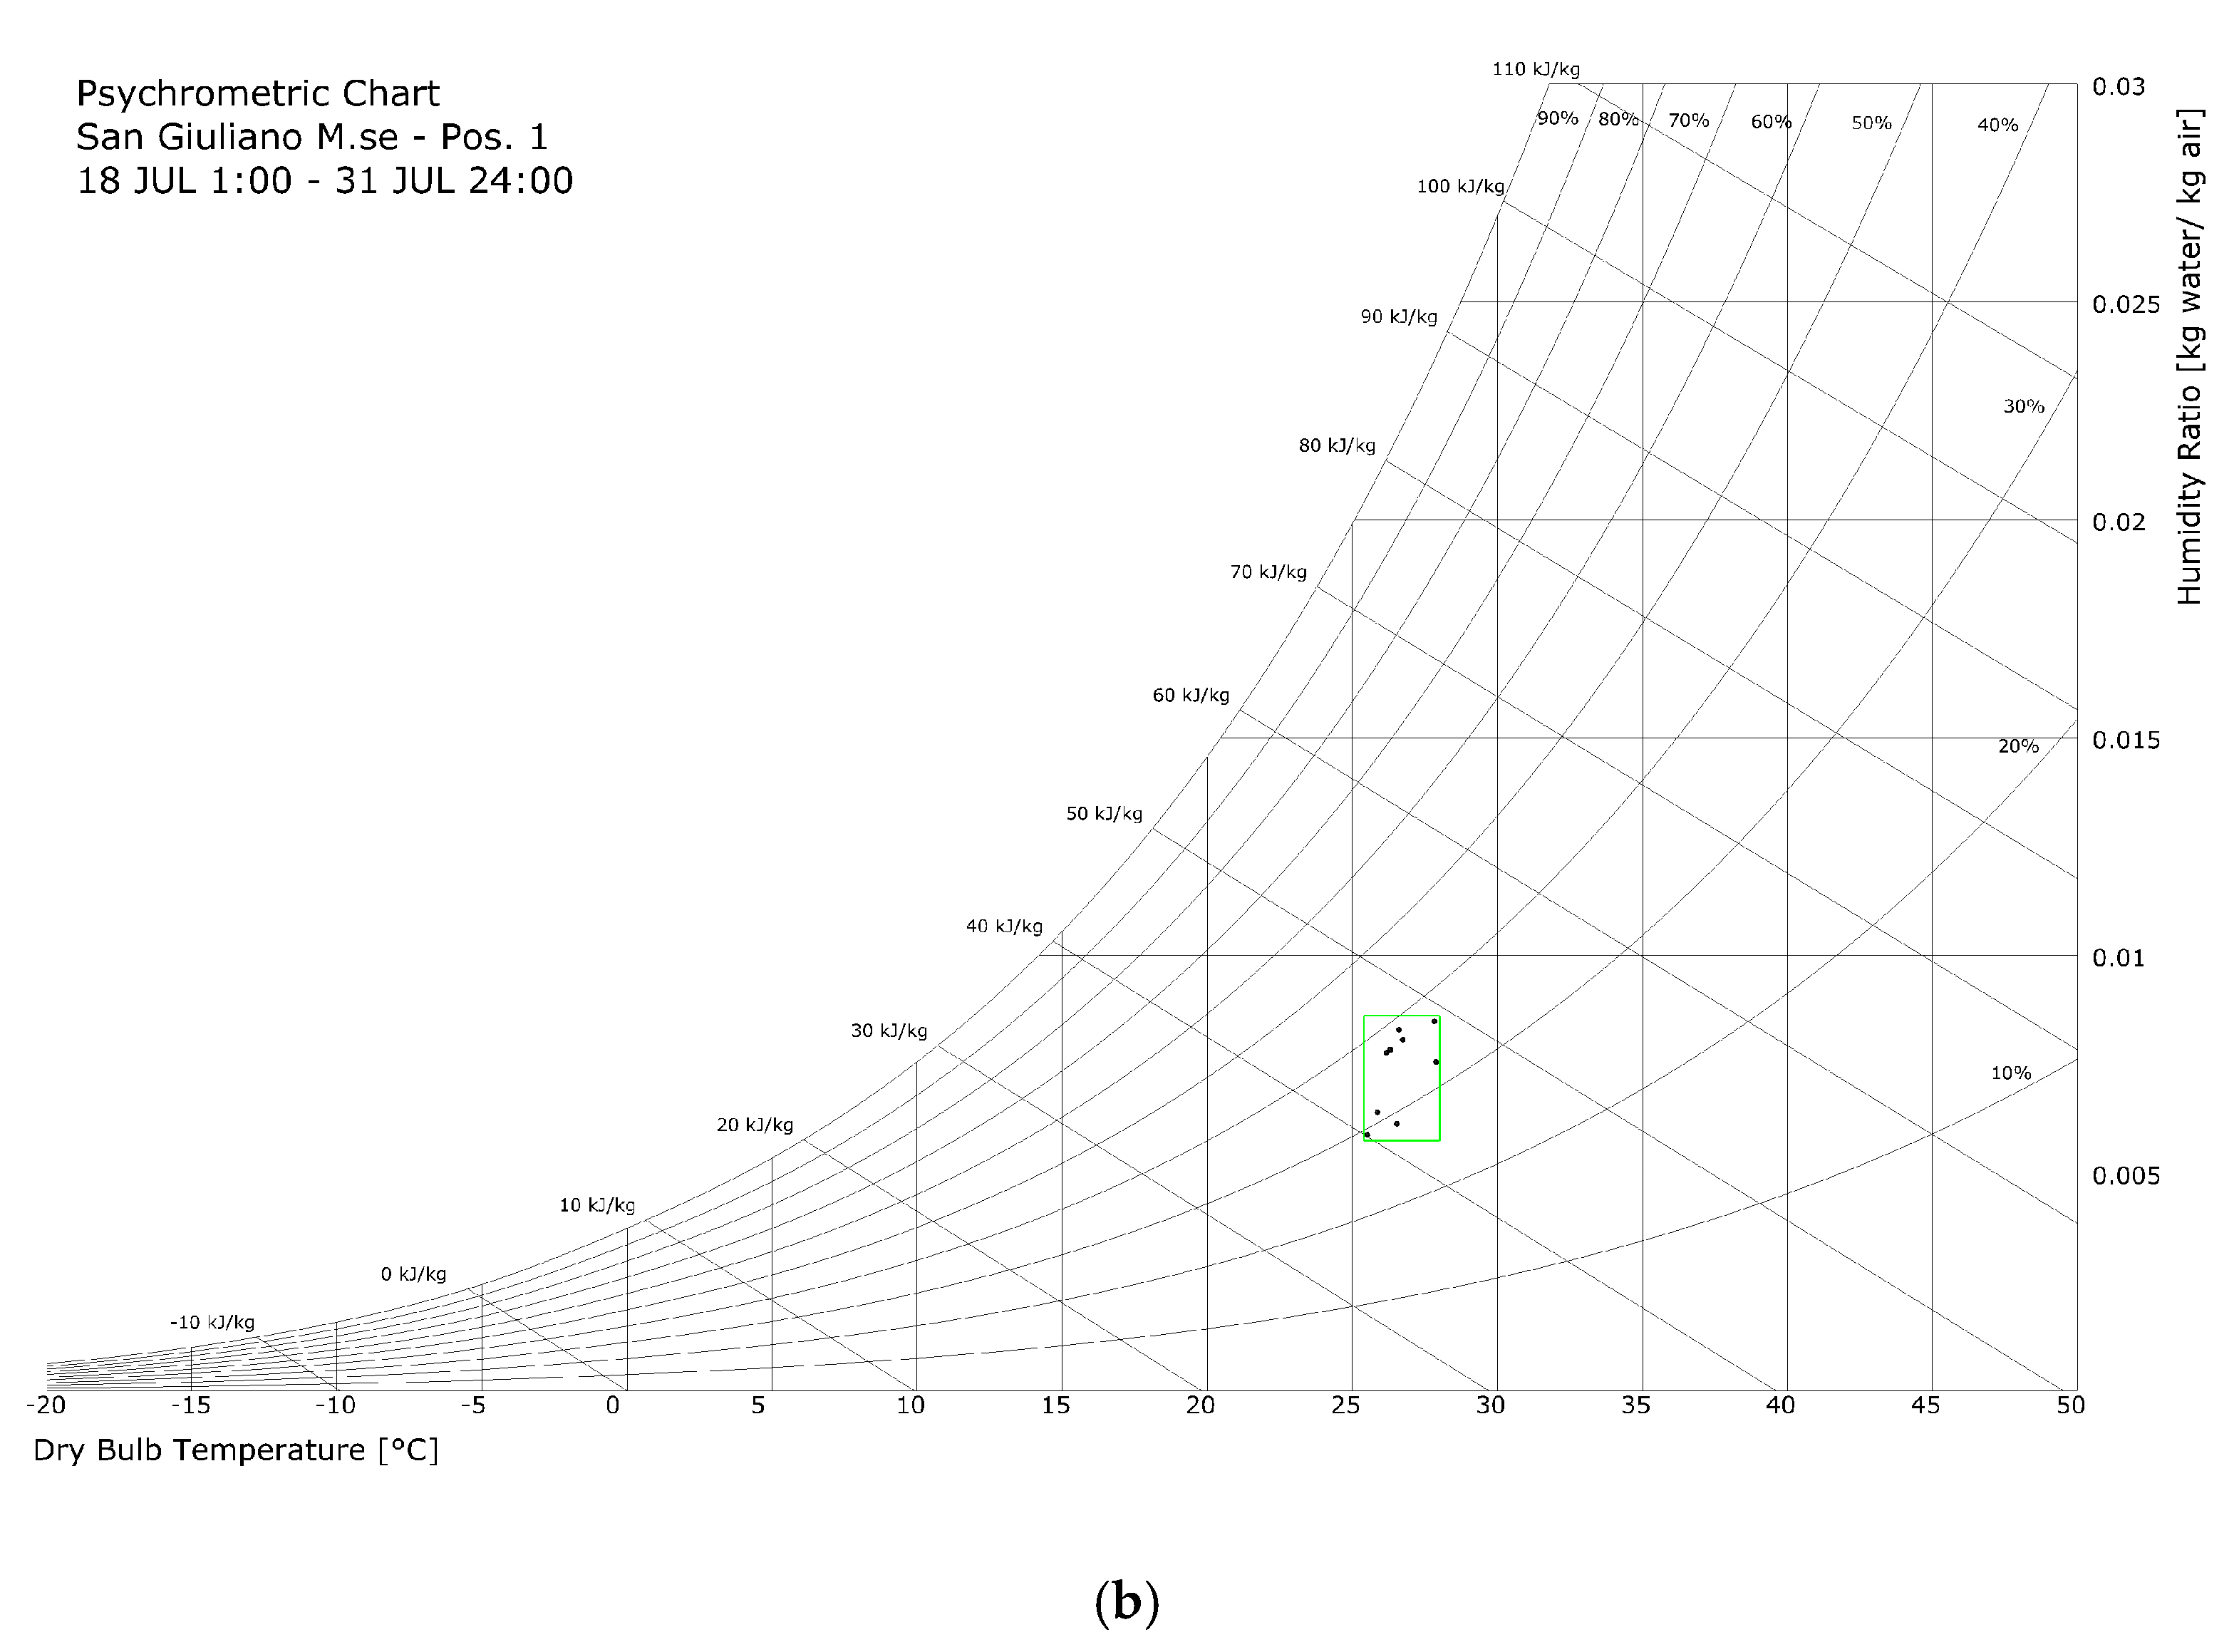
The survey data allow to verify for this specific cases the discrepancy between the standard method and the TSV. Also in term of GCZM we can display the results considering the differences in term of area of comfort defined, for example for Pos. 1, considering the standard method and the data provided by the user with a TSV of 0 (Figure 4).
The differences in term of comfort zone is quite evident with a more extended area in the standard approach (Figure 4a) compared to the comfort polygon based on TSV equal to 0 (Figure 4b). This aspect could be considered in a hypothetical adaptive control and optimization strategy of the office thermal plant system.
Finally, we have focused on the calculation of the modified PMV (PMV_mod_Pos1 and PMV_mod_Pos3) based on the metabolic rate defined starting from the monitored heart rate data [12] (Figure 5).
As it is possible to see in Figure 5, the PMV_mod for the Pos. 1 and Pos. 3 are both overestimated in relation to the standard PMV and to the TSV.

4. Conclusions

The framework described above and the related first application allow to verify the possibility to use it to consider a more critical approach to the ICQ assessment. The use of survey allow to highlight how could be different the TSV as compared to the standard PMV or GCZM. A first attempt to the use of the wearable data and, in particular the monitored heart rate values, allow to exclude the possibility to use only this data in the definition of a PMV_mod which may be closer to the TSV. However the adopted flexible solution allows to investigate and to consider other possible wearable sensors in order to define an adaptive algorithm based on users’ monitored data.

Author Contributions

The work presented in this paper is a collaborative development by all of the authors. In particular, Lorenzo Belussi, Italo Meroni and Francesco Salamone have performed the data analysis. Francesco Salamone and Ludovico Danza have developed the software and hardware. Writing of the paper was shared between the authors.

Acknowledgments

This work has been supported within the Framework Agreement between the National Research Council of Italy (CNR) and the Lombardy Region in the framework of the research project FHfFC (Future Home for Future Communities).

Conflicts of Interest

The authors declare no conflict of interest.

References

  1. Fanger, P.O. Thermal Comfort. Analysis and Applications in Environmental Engineering; McGraw-Hill: New York City, NY, USA, 1970. [Google Scholar]
  2. Macpherson, R.K. The assessment of the thermal environment. A review. Br. J. Ind. Med. 1962, 19, 151–164. [Google Scholar] [CrossRef] [PubMed]
  3. Lai, A.C.K.; Mui, K.W.; Wong, L.T.; Law, L.Y. An evaluation model for indoor environmental quality (IEQ) acceptance in residential buildings. Energy Build. 2009, 41, 930–936. [Google Scholar] [CrossRef]
  4. Djongyang, N.; Tchinda, R.; Njomo, D. Thermal comfort: A review paper. Renew. Sustain. Energy Rev. 2010, 14, 2626–2640. [Google Scholar] [CrossRef]
  5. De Dear, R.; Brager, G.S. Developing an Adaptive Model of Thermal Comfort and Preference; Center for the Built Environment: Berkeley, CA, USA, 1998. [Google Scholar]
  6. Salamone, F.; Belussi, L.; Danza, L.; Ghellere, M.; Meroni, I. Design and Development of nEMoS, an All-in-One, Low-Cost, Web-Connected and 3D-Printed Device for Environmental Analysis. Sensors 2015, 15, 13012–13027. [Google Scholar] [CrossRef] [PubMed]
  7. Salamone, F.; Danza, L.; Meroni, I.; Pollastro, M.C. A Low-Cost Environmental Monitoring System: How to Prevent Systematic Errors in the Design Phase through the Combined Use of Additive Manufacturing and Thermographic Techniques. Sensors 2017, 17, 828. [Google Scholar] [CrossRef] [PubMed]
  8. Wu, T.; Cui, W.; Cao, B.; Zhu, Y.; Ouyang, Q. Measurements of the additional thermal insulation of aircraft seat with clothing ensembles of different seasons. Build. Environ. 2016, 108, 23–29. [Google Scholar] [CrossRef]
  9. Grasshopper. Available online: http://www.grasshopper3d.com (accessed on 18 October 2017).
  10. Ladybug Tools. Available online: http://www.ladybug.tools (accessed on 18 October 2017).
  11. TT Toolbox. Available online: http://core.thorntontomasetti.com/tt-toolbox-for-grasshopper (accessed on 18 October 2017).
  12. Malchaire, J.; Alfano, F.R.D.A.; Palella, B.I. Evaluation of the metabolic rate based on the recording of the heart rate. Ind. Health 2017, 55, 219–232. [Google Scholar] [CrossRef] [PubMed]
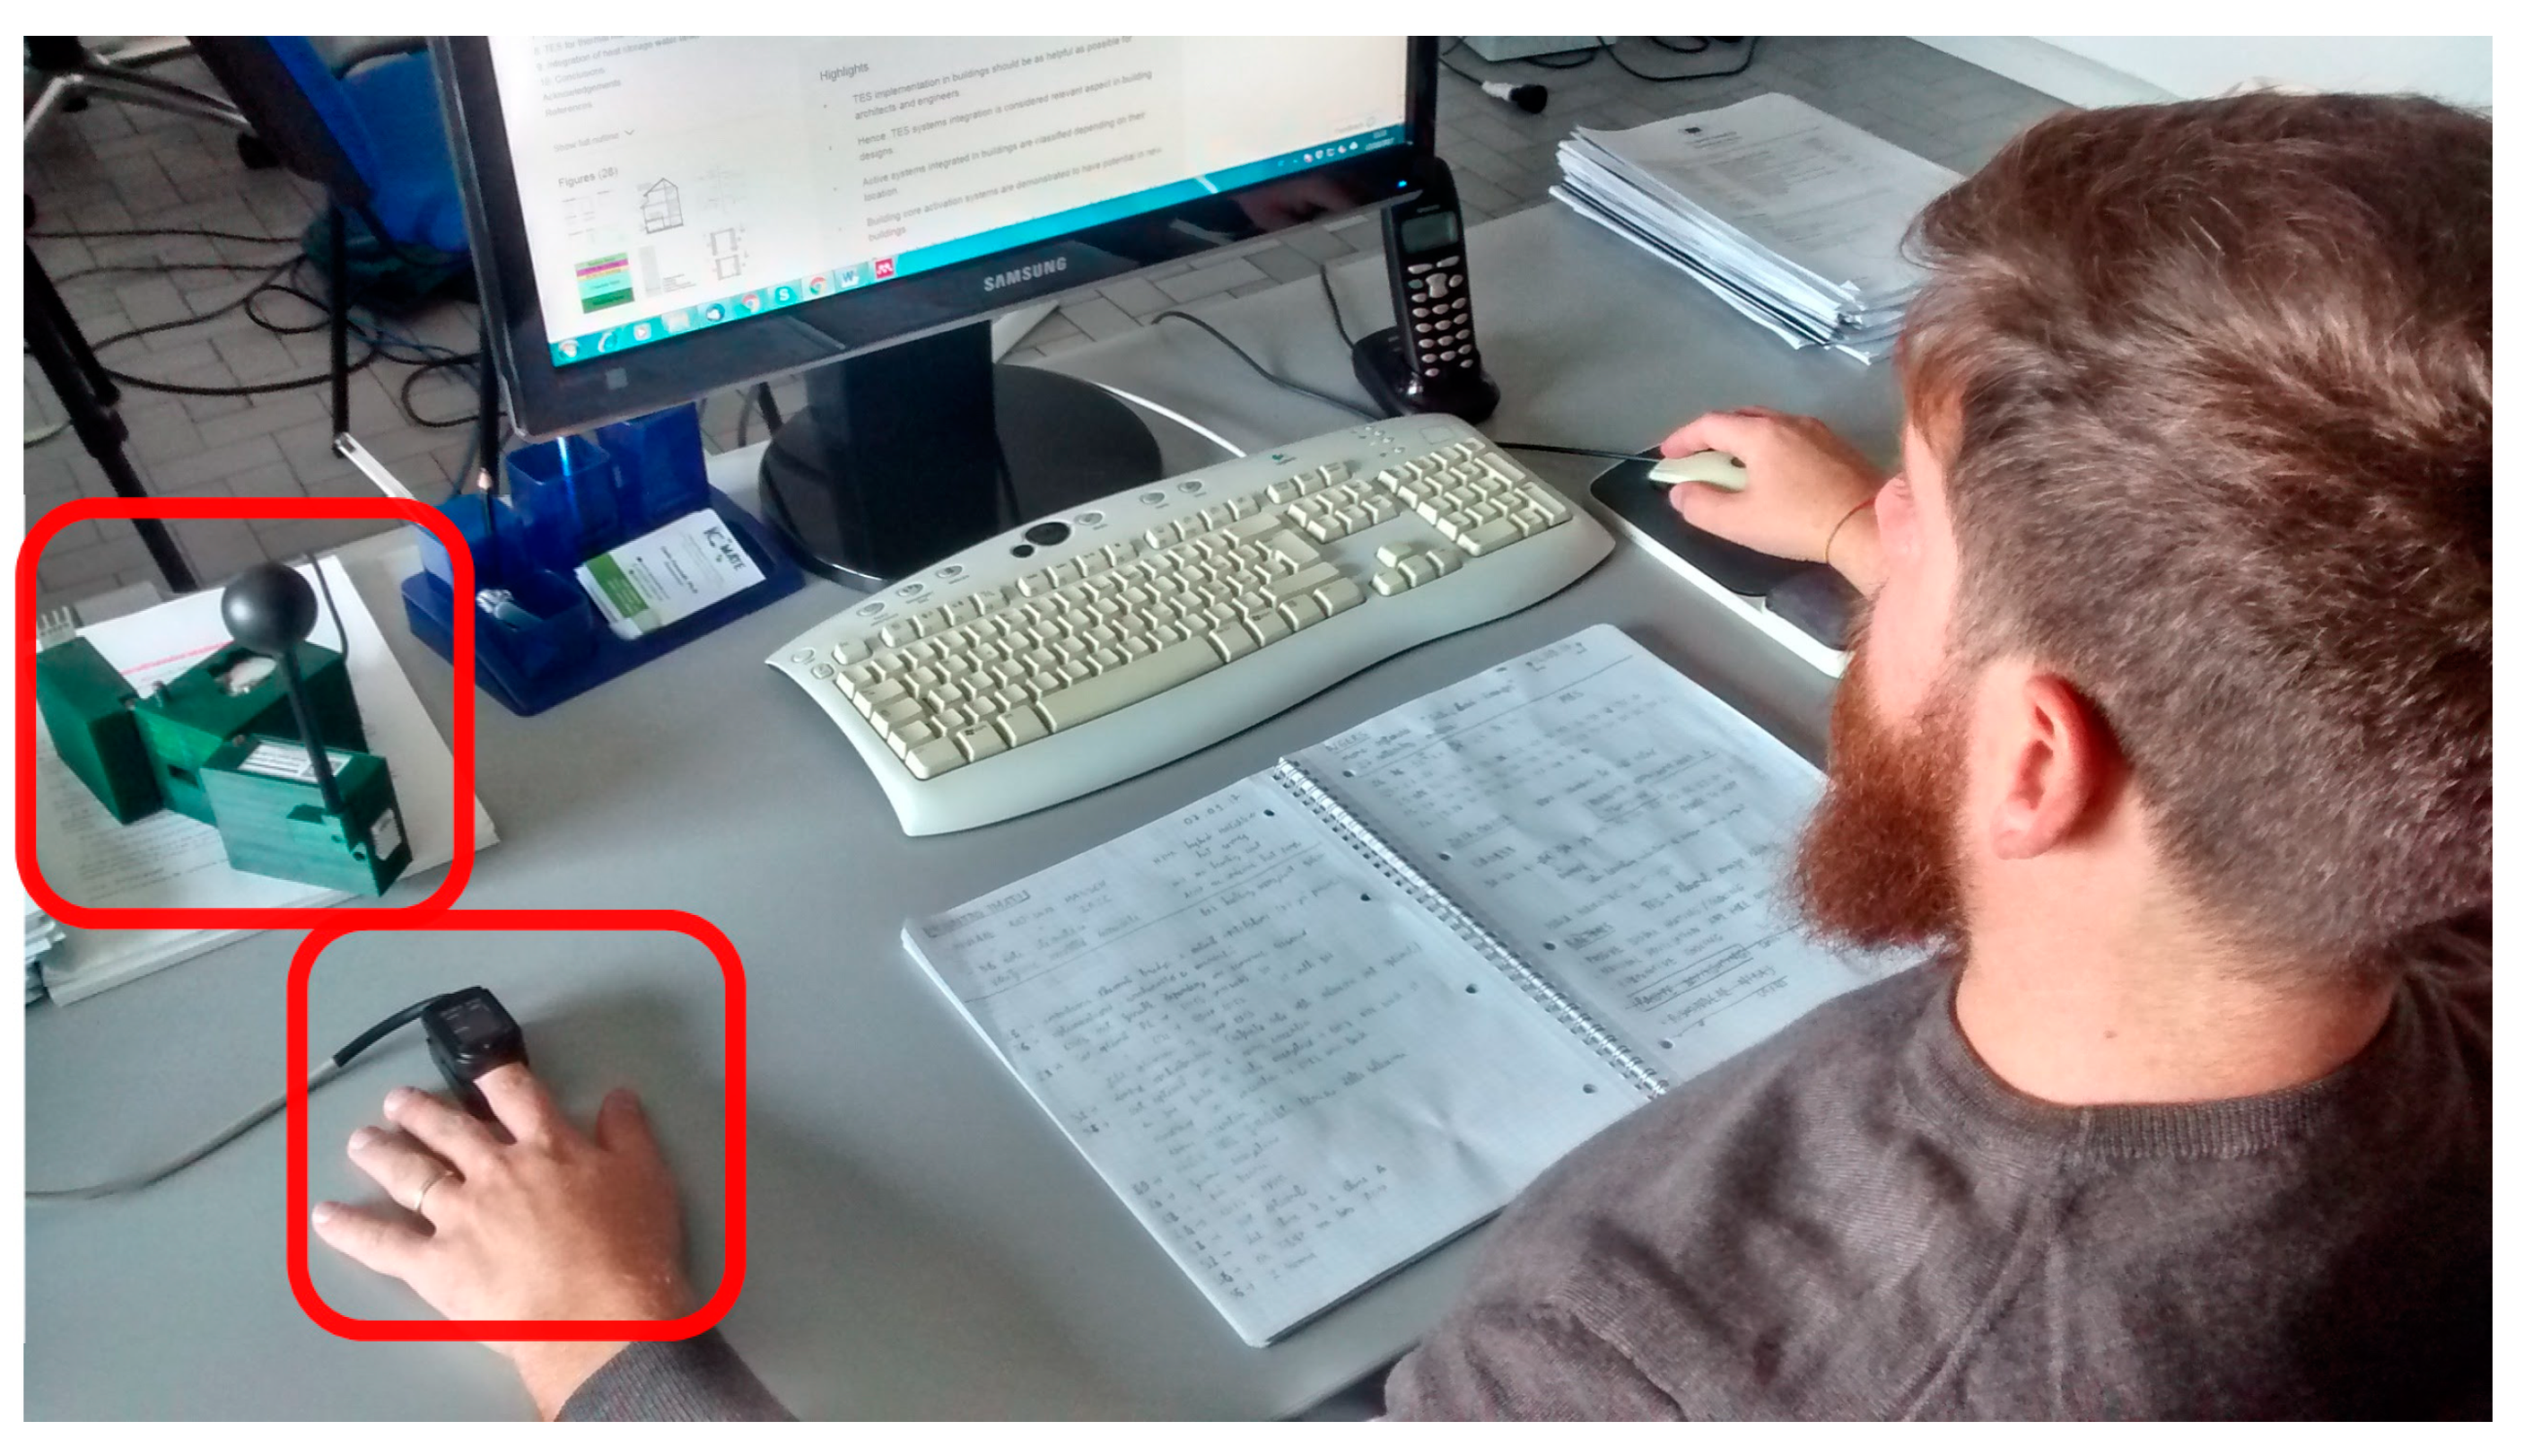
Figure 1. Monitoring system as installed in an office desktop.
Proceedings 02 00114 g001
Figure 2. Monitoring system as installed in an office desktop.
Proceedings 02 00114 g002
Figure 3. PMV and TSV: (a) Pos.1; (b) Pos. 3.
Proceedings 02 00114 g003aProceedings 02 00114 g003b
Figure 4. GCZM for Pos. 1: (a) based on standard approach; (b) based on TSV data.
Proceedings 02 00114 g004aProceedings 02 00114 g004b
Figure 5. Modified PMV calculated as a function of metabolic rate: (a) Pos.1; (b) Pos. 3.
Proceedings 02 00114 g005aProceedings 02 00114 g005b
Publisher’s Note: MDPI stays neutral with regard to jurisdictional claims in published maps and institutional affiliations.