Abstract
Graphene provides a unique way for sensing local pH level of substances on micrometric scale, with important implications for the monitoring of cellular metabolic activities where protonic excretion could occur. Doping modifications of graphene, induced by the contact of the graphene with different pH solutions were investigated by micro-Raman spectroscopy in order to develop a pH biosensor. To test the developed biosensor with real biological systems, the pH values of cell culture media in different conditions were evaluated.
1. Introduction
The potentiality of graphene to sense acidity of substances on micrometric scale has been recently proved by G. L. C. Paulus and coworkers [1] opening amazing perspectives in the field of bio-cellular investigation. As preliminary stages for developing a physiometer able to monitor the metabolism of a single cell by measuring the cell medium acidity determined by the proton excretion of cell or the response of cell cultures to external factors, we investigated solutions with different pH levels and cell culture media in different conditions. The electronic doping state of graphene in contact with a small amount of sample was evaluated by means of Raman spectroscopy [2], in order to monitor local changes of the acidity of sample. Depending on the optical objective used, spatial resolution of order of few micrometers can be obtained, with interesting issue for single cell investigation.
2. Materials and Methods
Single-layer graphene on 10 × 10 mm2 Si substrates were used in this work. They were produced by Graphenea (San Sebastiàn, Spain). In order to calibrate the sensor, aqueous solutions have been prepared with nominal pH equal to 1.85, 2, 4.5, 7.4, 10, 10.7, 12, 13.7, 14 and tested on graphene. Starting with ultrapure deionized water (pH = 7.4) solutions of HCl (3 molars) or of NaOH (2 molars) were diluted in order to obtain unbuffered solutions with known concentration and pH.
Cell culture liquid DMEM (GibcoTM Dulbecco Modified Eagle Medium, by Thermo Fisher Sci. Inc., Waltham, MA, USA) was also investigated. Samples of DMEM were tested after different exposure times to X-ray ionizing irradiations processes performed at a dose rate of 2.1 Gy/min. Four irradiation processes have been considered, namely at total doses of 2, 4, 6 and 8 Gy, respectively. The X-Ray irradiation treatment were performed using a STABILIPLAN machine (Siemens, Munich, Germany). X-rays (250 kVp) were produced by a Thomson tube (TR 300F) and filtered by 1-mm-thick foil.
For all the samples, a drop of about 1 μL was considered for the Raman analysis. The micro-Raman spectroscopy was performed by using a Jobin-Yvon system (by Horiba Inst. Ltd., Kyoto, Japan) equipped by TriAx 180 monochromator, a liquid N2 cooled CCD and an optical grating of 1800 grooves/mm, allowing a spectral resolution of 4 cm−1. A He-Ne laser operating at a wavelength λ = 633 nm was used, (maximum nominal power of 17 mW). The laser light was focused on the sample surface by means of a 100× (n.a. = 0.90) optical objective on an excitation area of about 1 μm of size. The spectra were obtained using an accumulation time of 180 s.
3. Results and Discussion
The Raman response of graphene in contact to substances with different pH was investigated by considering aqueous solutions of HCl or NaOH in the range of pH from 1.85 to 14. The Raman signal of bare graphene is characterized by sharp features at about 1595 cm−1 (G) and a broad mode at 2650 cm−1 (2D). The measured G mode value is higher than the value expected in insulated graphene. This is caused by an initial p-doping of graphene due to the contact with Si substrate and air [1]. As visible in the Figure 1a the wavenumber position of the G mode allows the determination of the electronic carrier concentration n (cm−2) of the graphene.
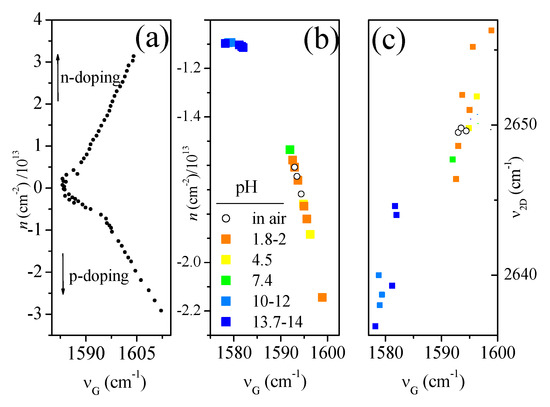
Figure 1.
(a) Relation between electron concentration and G mode wavenumber of graphene (data from Ref. [2]). (b) Experimental doping carrier concentration evaluated for aqueous solutions at different pH levels. Circles refers to bare graphene in air. (c) Correlation between wavenumber of the graphene 2D mode and G mode, at different values of pH.
The data reported in Figure 1a were experimentally obtained by A. Das et al. [2]. We used this dependence for evaluating n from the wavenumber position of the mode G. In Figure 1b n is reported as a function of the νG position, for solutions at different pH levels. In this figure a correlation between pH and doped state of graphene is exhibited. The νG value decreases (spectral red-shift) when p-doping decrease, i.e., when pH increases. Also the 2D mode is also affected by “acidity” of solution, and ν2D changes in a strong correlation with νG, as clearly visible in Figure 1c. A linear correlation between the positions of G and 2D modes is evinced from the experimental data. An empirical relation between n and the pH value is obtained from the analysis of spectroscopic data:
pH = 24.6 ± 1.8 + (11.9 ± 1.1 ) × 10−13n
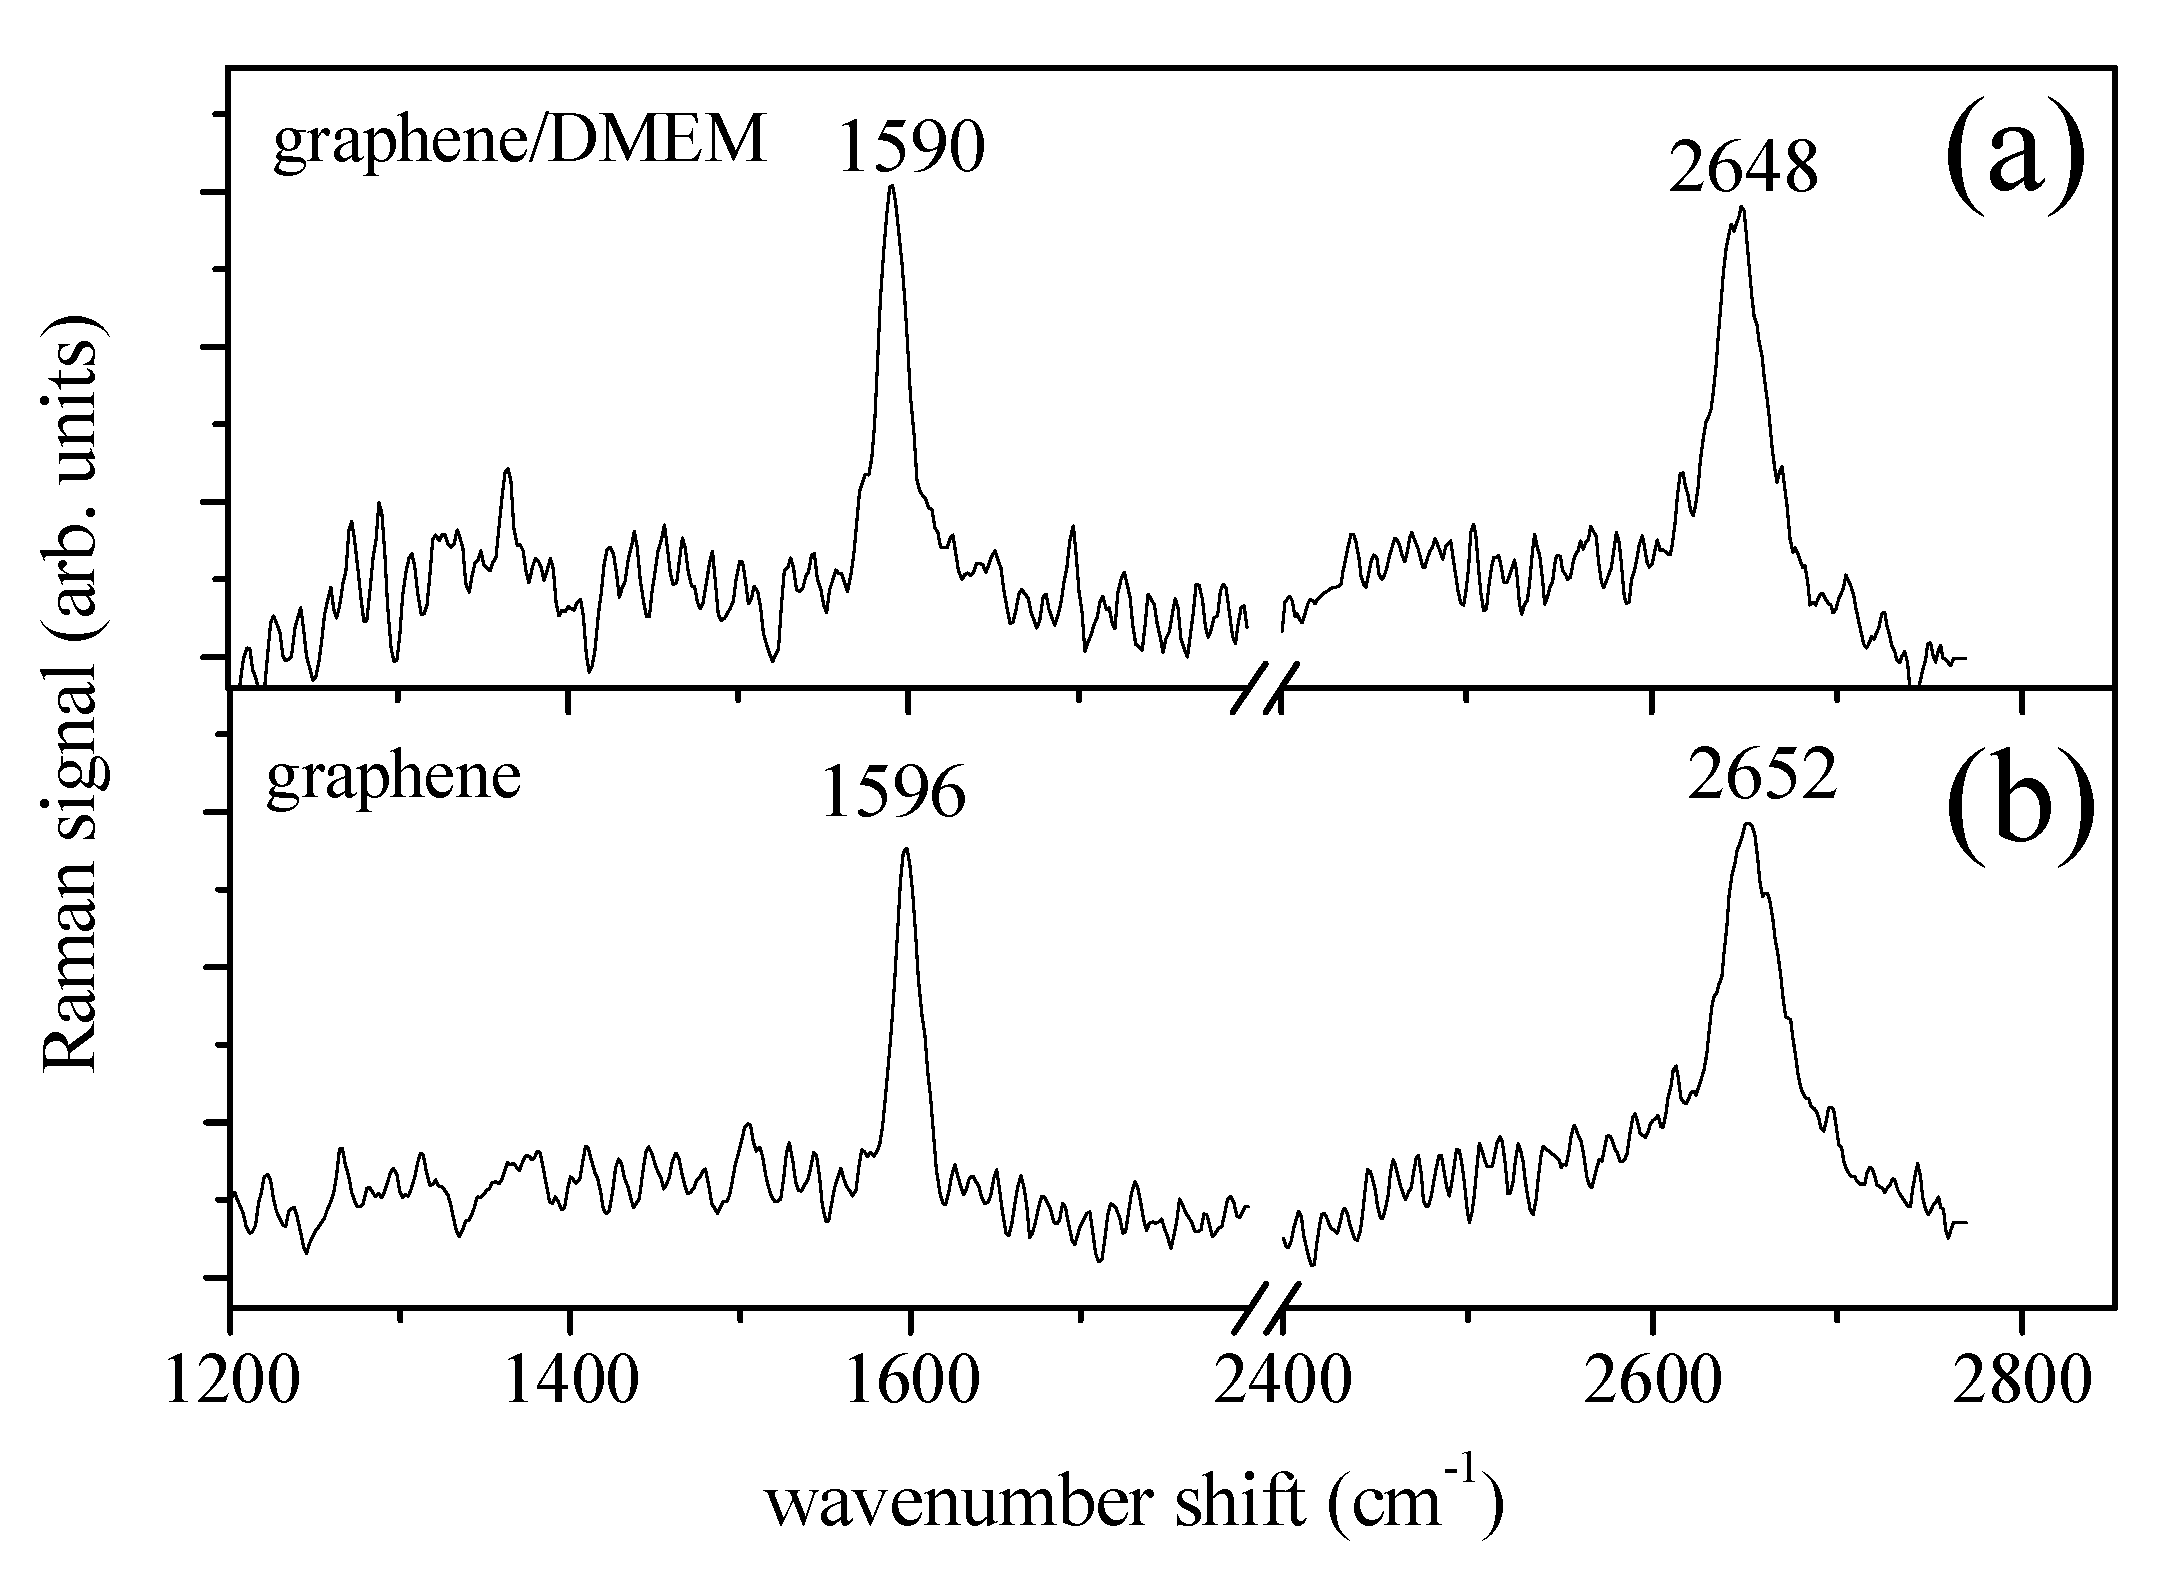
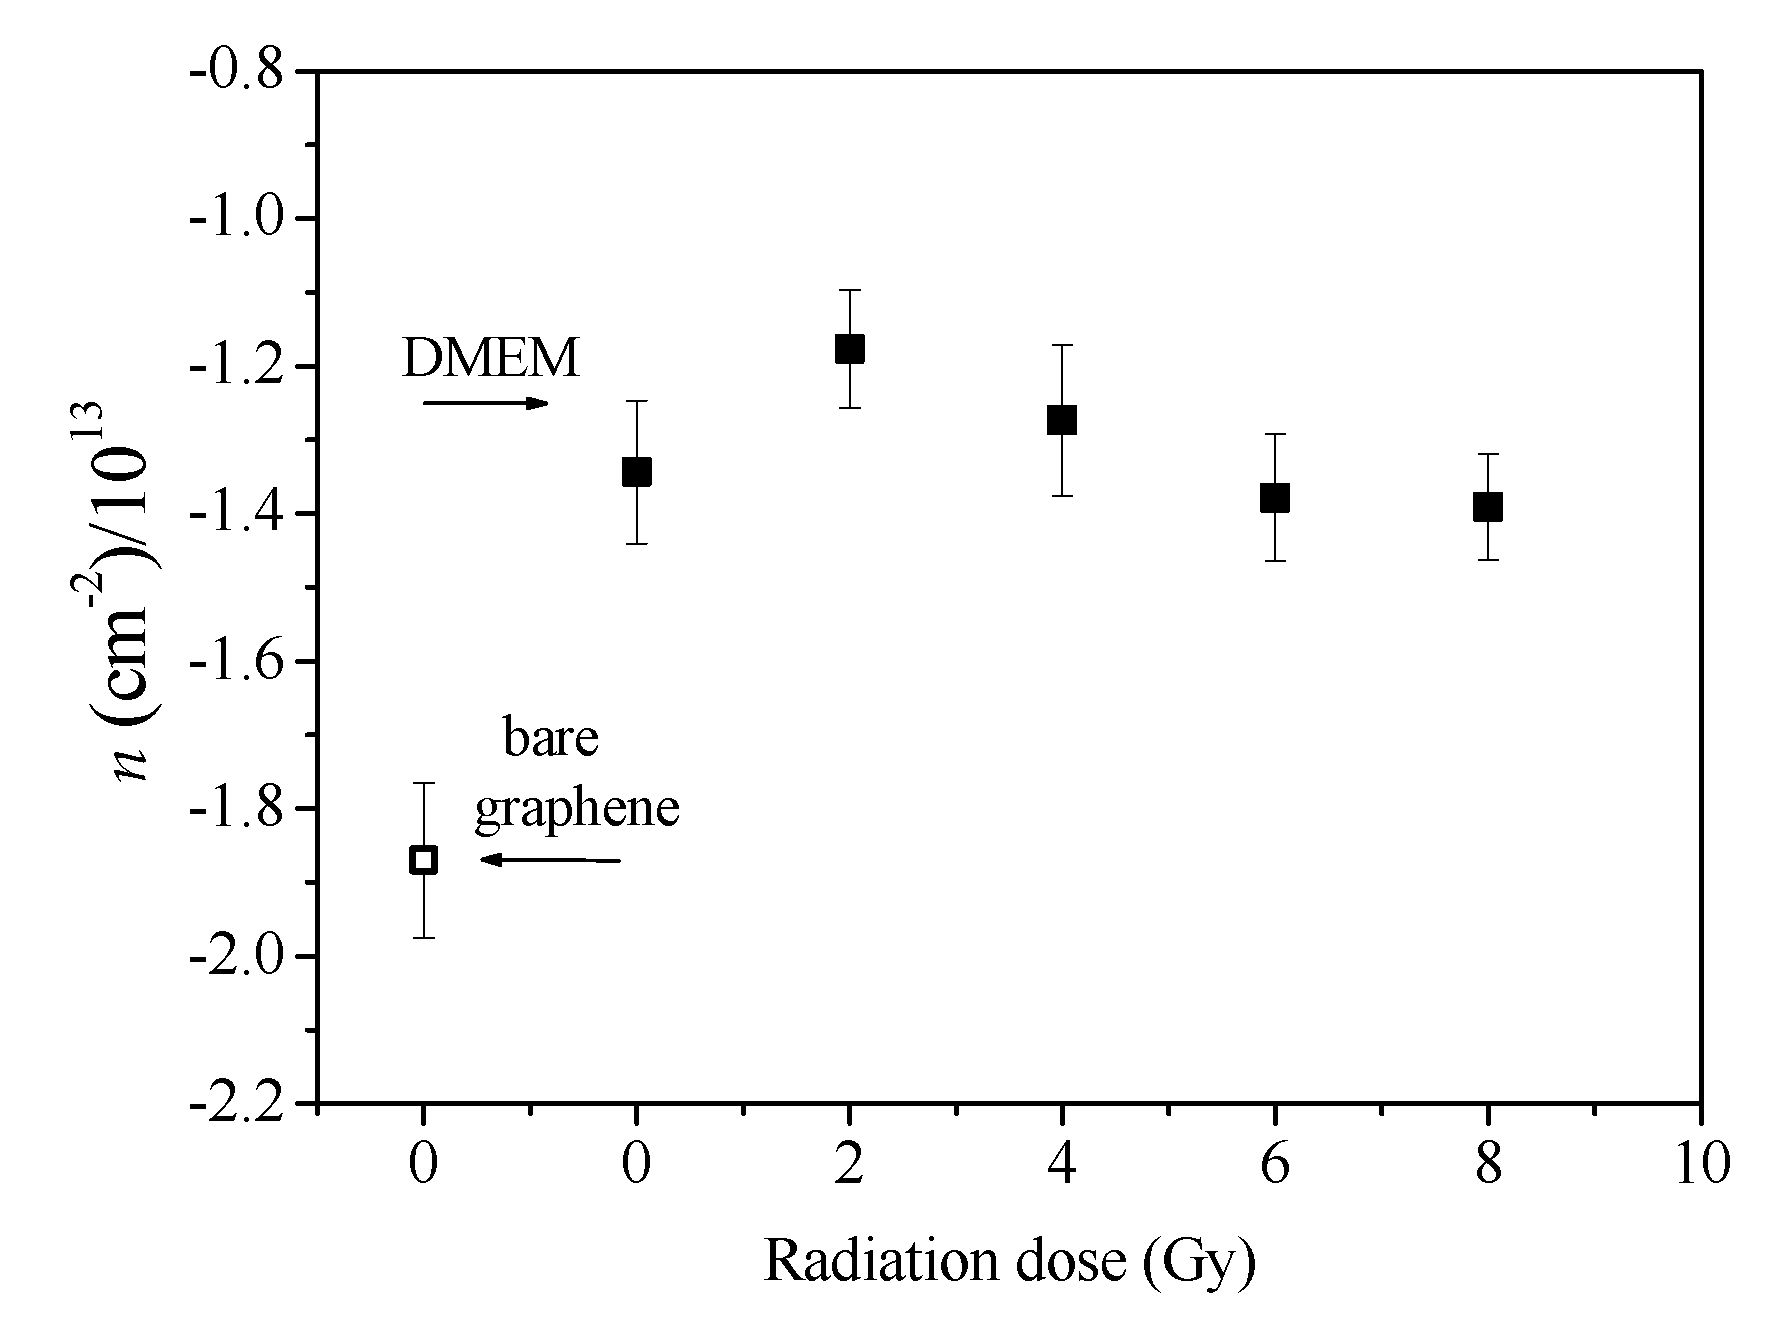
Using this approximation, the initial doping of graphene results equivalent to pH = 5.5± 1.8. In order to configure experiments for monitoring cell activities, the cell culture liquid (DMEM) was characterized. Samples of DMEM exposed to ionizing radiation, for doses of 2, 4, 6 and 8 Gy were considered and compared with unexposed sample (dose 0 Gy). The Raman response of graphene covered by a drop of DMEM unexposed to radiation is reported in Figure 2a. When the spectrum is compared with the Raman spectrum of bare graphene, reported in Figure 2b, a spectral red-shift of the mode at 1590 cm−1 (G mode) and at 2648 cm−1 (2D) is clearly observed. The value evaluated for pH is of 8.6 ± 1.6, slightly higher than the value of 7.4 measured by a conventional pH-meter on the bare DMEM. This result is probably related to a chemical interaction between graphene and DMEM and a further investigation on this aspect is in progress. The value of n is estimated also in the case of irradiated DMEM samples. The data reported in Figure 3 indicates the occurrence of changes in the pH value of DMEM. At the dose of 2Gy a significant increase of pH (more alkaline state) occurs, but, increasing the irradiation doses, the level of pH decreases and reaches a pH value equal to 8.0 ± 1.8 at the dose of 8 Gy. This value is lower than the initial one. This behavior can be ascribed to an increase of hydroxyl ions (OH−) which at low dose overcome the H+ resulting in a lower level of the total acidity. Increasing the radiation dose, the content of H+ and OH− becomes closer and the pH value decreases.

Figure 2.
(a) Raman spectrum of graphene covered by a DMEM solution; (b) Raman spectrum of bare graphene.

Figure 3.
Carrier doping of graphene in contact with DMEM irradiated by X-rays at doses of 0, 2, 4, 6, 8 Gy, evaluated by micro-Raman spectroscopy. The data are compared with the intrinsic doping level of bare graphene.
4. Conclusions
Based on the unique properties of graphene, the dependence of the electronic doping of this material induced by the proximity of alkaline or acid liquids was probed by micro-Raman spectroscopy. The method allows the determination of the pH level of solutions even when very small quantities are considered (smaller than 1 μL), or with high spatial resolution (of order of 1μm) when a scan of the sample is performed. A pH characterization of cell culture medium (DMEM) depending on the X-Ray irradiation doses has been done. A non monotonic dependence of pH on radiation dose was observed, mainly ascribed to the complex behavior of water hydrolysis induced by radiation [3], that mainly determines the pH level of the sample by regulating the amount of hydroxyl and hydrogen ions. Based on this preliminary study, more detailed investigation on cell culture medium is in progress, in order to monitor cell activities after ionizing irradiation stages.
Acknowledgments
The authors are pleased to acknowledge the financial support received from the Project “Progettazione, sviluppo e produzione di cibi funzionali e/o arricchiti” (PON03PE_00060_2).
Conflicts of Interest
The authors declare no conflict of interest.
References
- Paulus, G.L.C.; Nelson, J.T.; Lee, K.Y.; Wang, Q.H.; Reuel, N.F.; Grassbaugh, B.R.; Kruss, S.; Landry, M.P.; Kang, J.W.; Ende, E.V.; et al. A graphene-based physiometer array for the analysis of single biological cells. Sci. Rep. 2014, 4, 6865. [Google Scholar] [CrossRef] [PubMed]
- Das, A.; Pisana, S.; Chakraborty, B.; Pisanec, S.; Saha, S.K.; Waghmare, U.V.; Novoselov, K.S.; Krishnamurthy, H.R.; Geim, A.K.; Ferrari, A.C.; et al. Monitoring dopants by Raman scattering in a electrochemical top-gated graphene transistor. Nat. Nanotechnol. 2008, 3, 210–215. [Google Scholar] [CrossRef] [PubMed]
- Le Caër, S. Water radiolysis: Influence of oxide surfaces on H2 production under ionizing radiation. Water 2011, 3, 235–253. [Google Scholar] [CrossRef]

Publisher’s Note: MDPI stays neutral with regard to jurisdictional claims in published maps and institutional affiliations. |
© 2018 by the authors. Licensee MDPI, Basel, Switzerland. This article is an open access article distributed under the terms and conditions of the Creative Commons Attribution (CC BY) license (https://creativecommons.org/licenses/by/4.0/).