Extended Abstract

Effect of the Discharge Piping Scheme on the Pressure Fluctuations Induced from A Laboratory Pump †

1
Department of Energy, University of Oviedo, Campus de Viesques s/n, 33271 Gijón, Asturias, Spain
2
National Research Center of Pumps, Jiangsu University, Xuefu Road No.301, Zhenjiang 212013, Jiangsu, China
*
Author to whom correspondence should be addressed.
Presented at the 2nd International Research Conference on Sustainable Energy, Engineering, Materials and Environment (IRCSEEME), Mieres, Spain, 25–27 July 2018
Proceedings 2018, 2(23), 1488; https://doi.org/10.3390/proceedings2231488
Published: 1 November 2018

Abstract

:
Fluid-dynamic noise induced by the unsteady fluid phenomena usually causes a negative influence on the hydraulic circuit system during the pump operation, especially at off-design flow rates. The spectrum of the pressure signals measured directly in the pipeline of the pump is usually employed to reflect the acoustic characteristic parameters of the fluid-dynamic noise of the pump itself. However, there exists a large difference between the spectrum characteristics directly measured and the actual characteristics of the acoustic source inside the pump due to the effects of the acoustic properties of the piping. Therefore, in order to verify the effect of the discharge piping on the pressure fluctuations of a laboratory pump, three different discharge piping schemes connected to the pump outlet were studied by opening and closing different valves. The results showed that the amplitude of the pressure pulsations in a constant monitor point changed with the shaft frequency and blade passing frequency. The variation range of the pressure pulsation magnitudes for the points monitored at the pump outlet is evidently larger than that for the points close to the cutwater of the volute.

1. Introduction

Centrifugal pumps are widely used in agriculture, industry and daily life situations as an important transmission device in hydraulic systems. During actual operation, centrifugal pumps usually produce fluid-dynamic noise, due to the unsteady flow and pressure pulsations, particularly at off-design operating conditions [1]. The internal flow pattern of the centrifugal pump is very complicated three-dimensional unsteady turbulence [2]. The two main sources of pressure pulsations are the instable wake flow at the exit of the impeller channel and its impingement on the cut-water region. Guelich [3] thought that the pressure pulsation is detrimental and unavoidable, therefore monitoring and controlling it under operation is vital. The spectrum of the pressure pulsations measured directly in the pipeline of the laboratory pump is usually employed to reflect the acoustic characteristic of the fluid-dynamic noise of the pump itself. However, during the process of testing, there exists a relative large difference between the spectrum characteristics directly measured and the actual characteristics of the acoustic source inside the pump due to the effects of the acoustic properties of the piping.
Accurately measuring the acoustic characteristics of fluid-dynamic noise is the basic guarantee for completing the study of its noise mechanisms, verifying noise reduction measures and designing centrifugal pump with lower noise levels [4]. Acoustic characteristics of the fluid-dynamic noise produced by the pump can be only truly expressed when connected to a pipeline as a hydraulic system. Therefore, this paper designs a test system, which was established in the laboratory of the Department of Energy at the University of Oviedo, to estimate the coupling effect of the pipe system on the pressure pulsations of a laboratory pump.

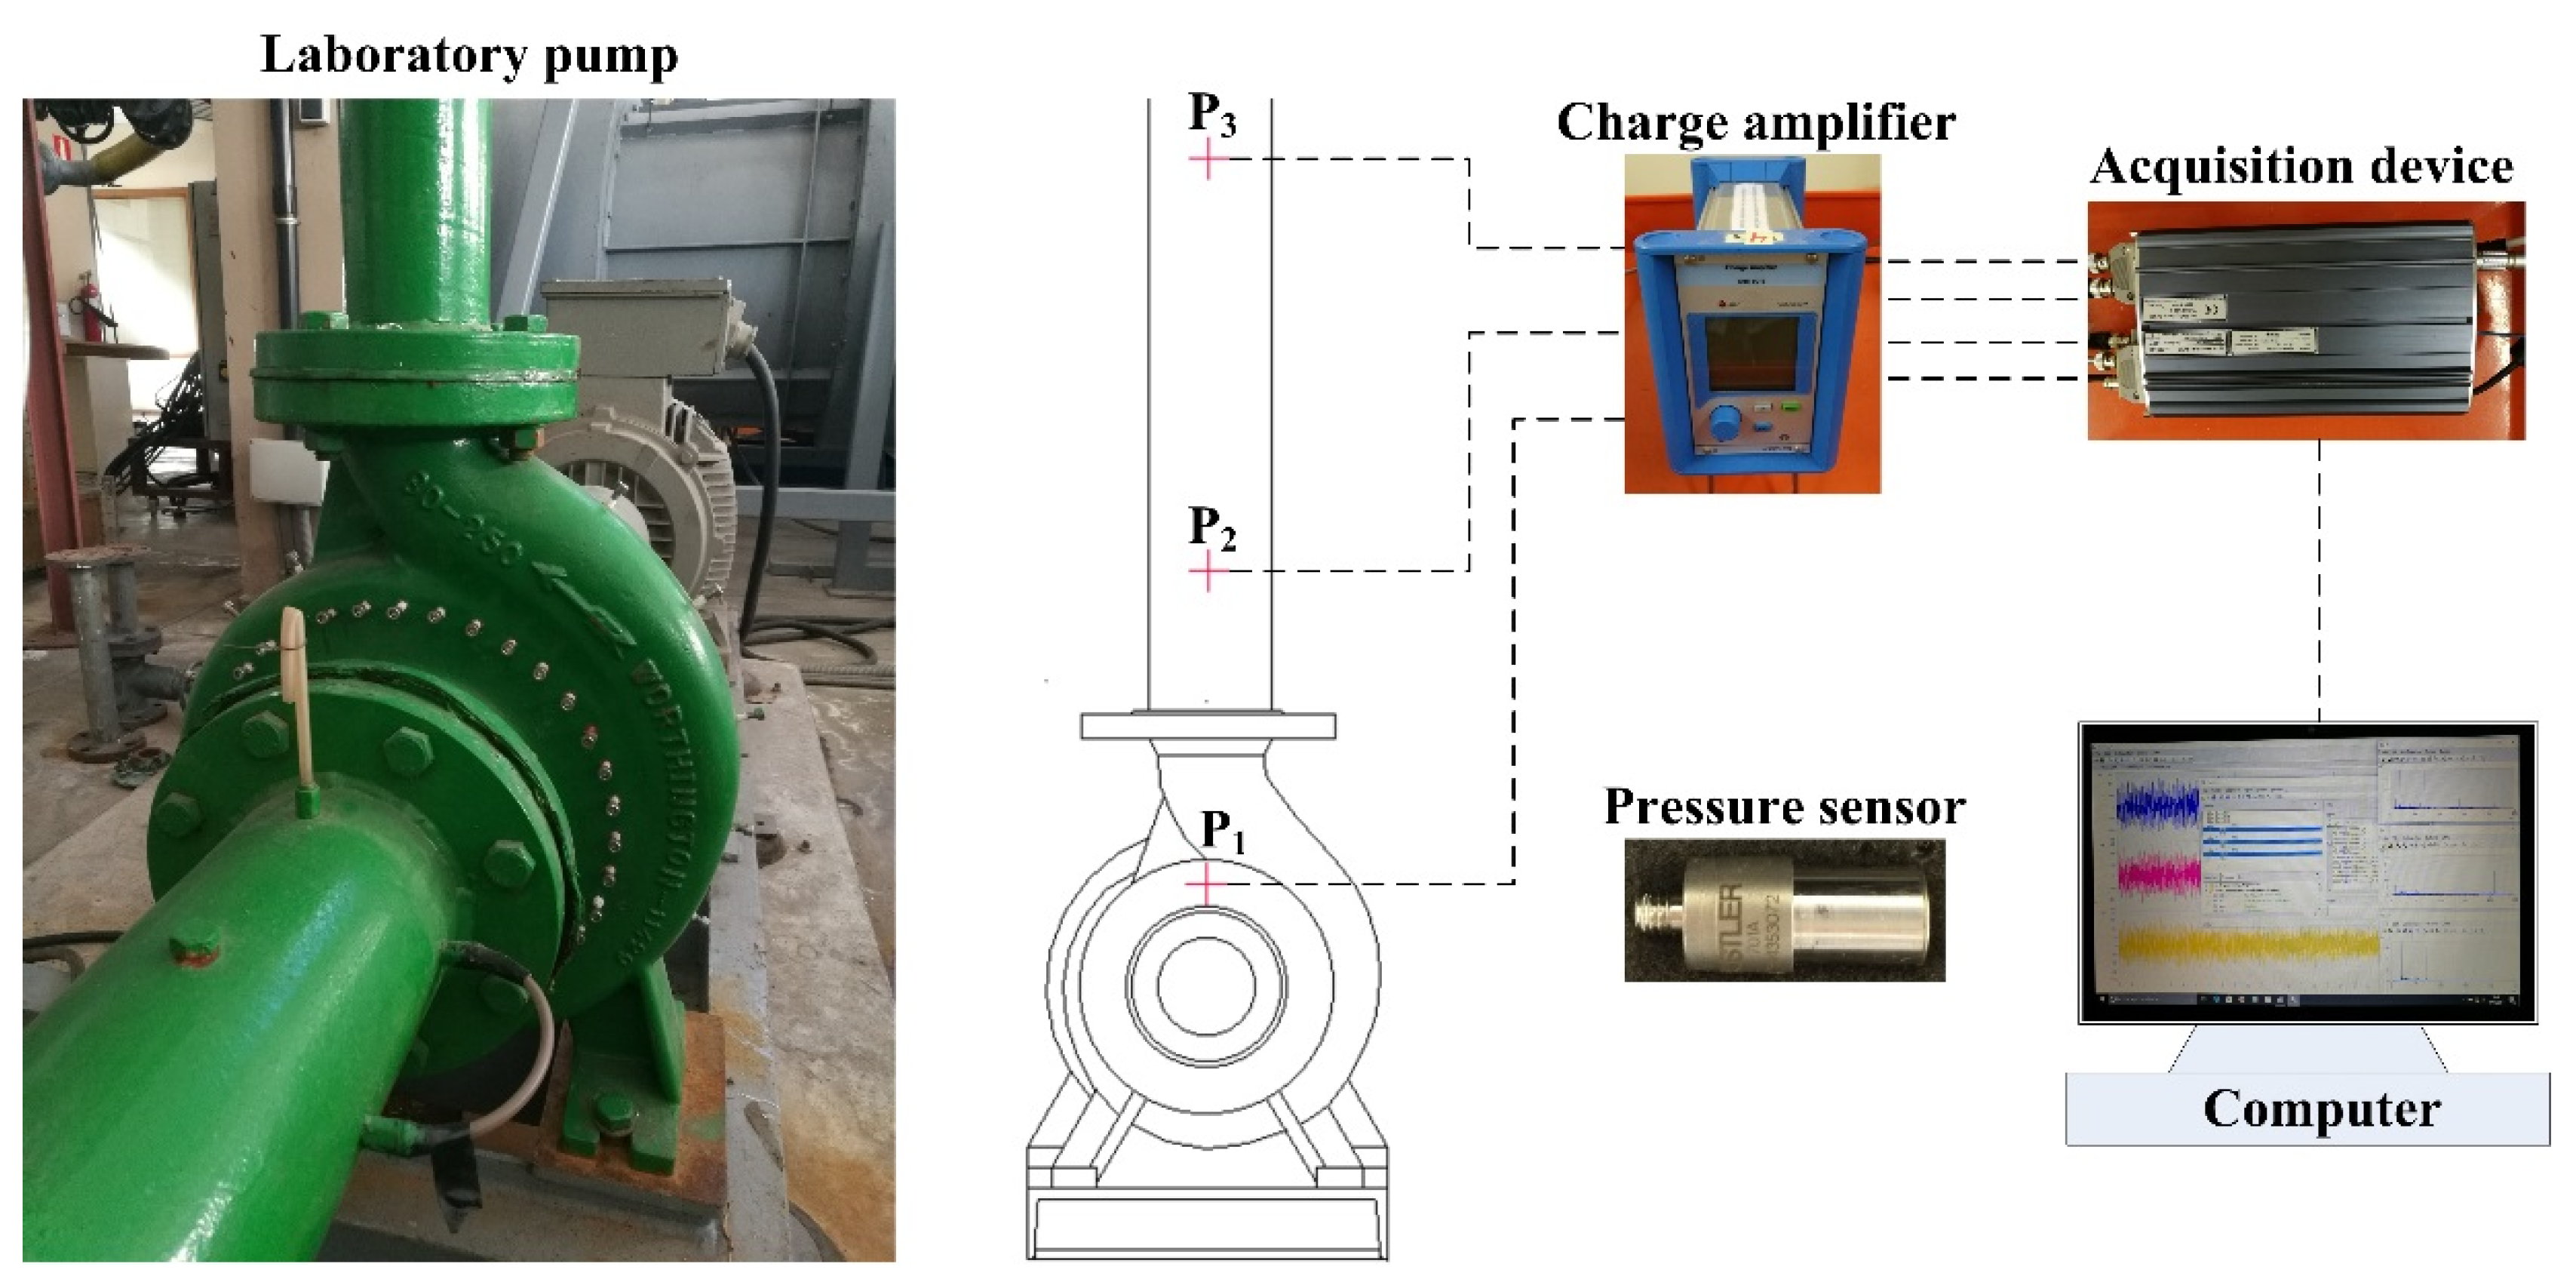
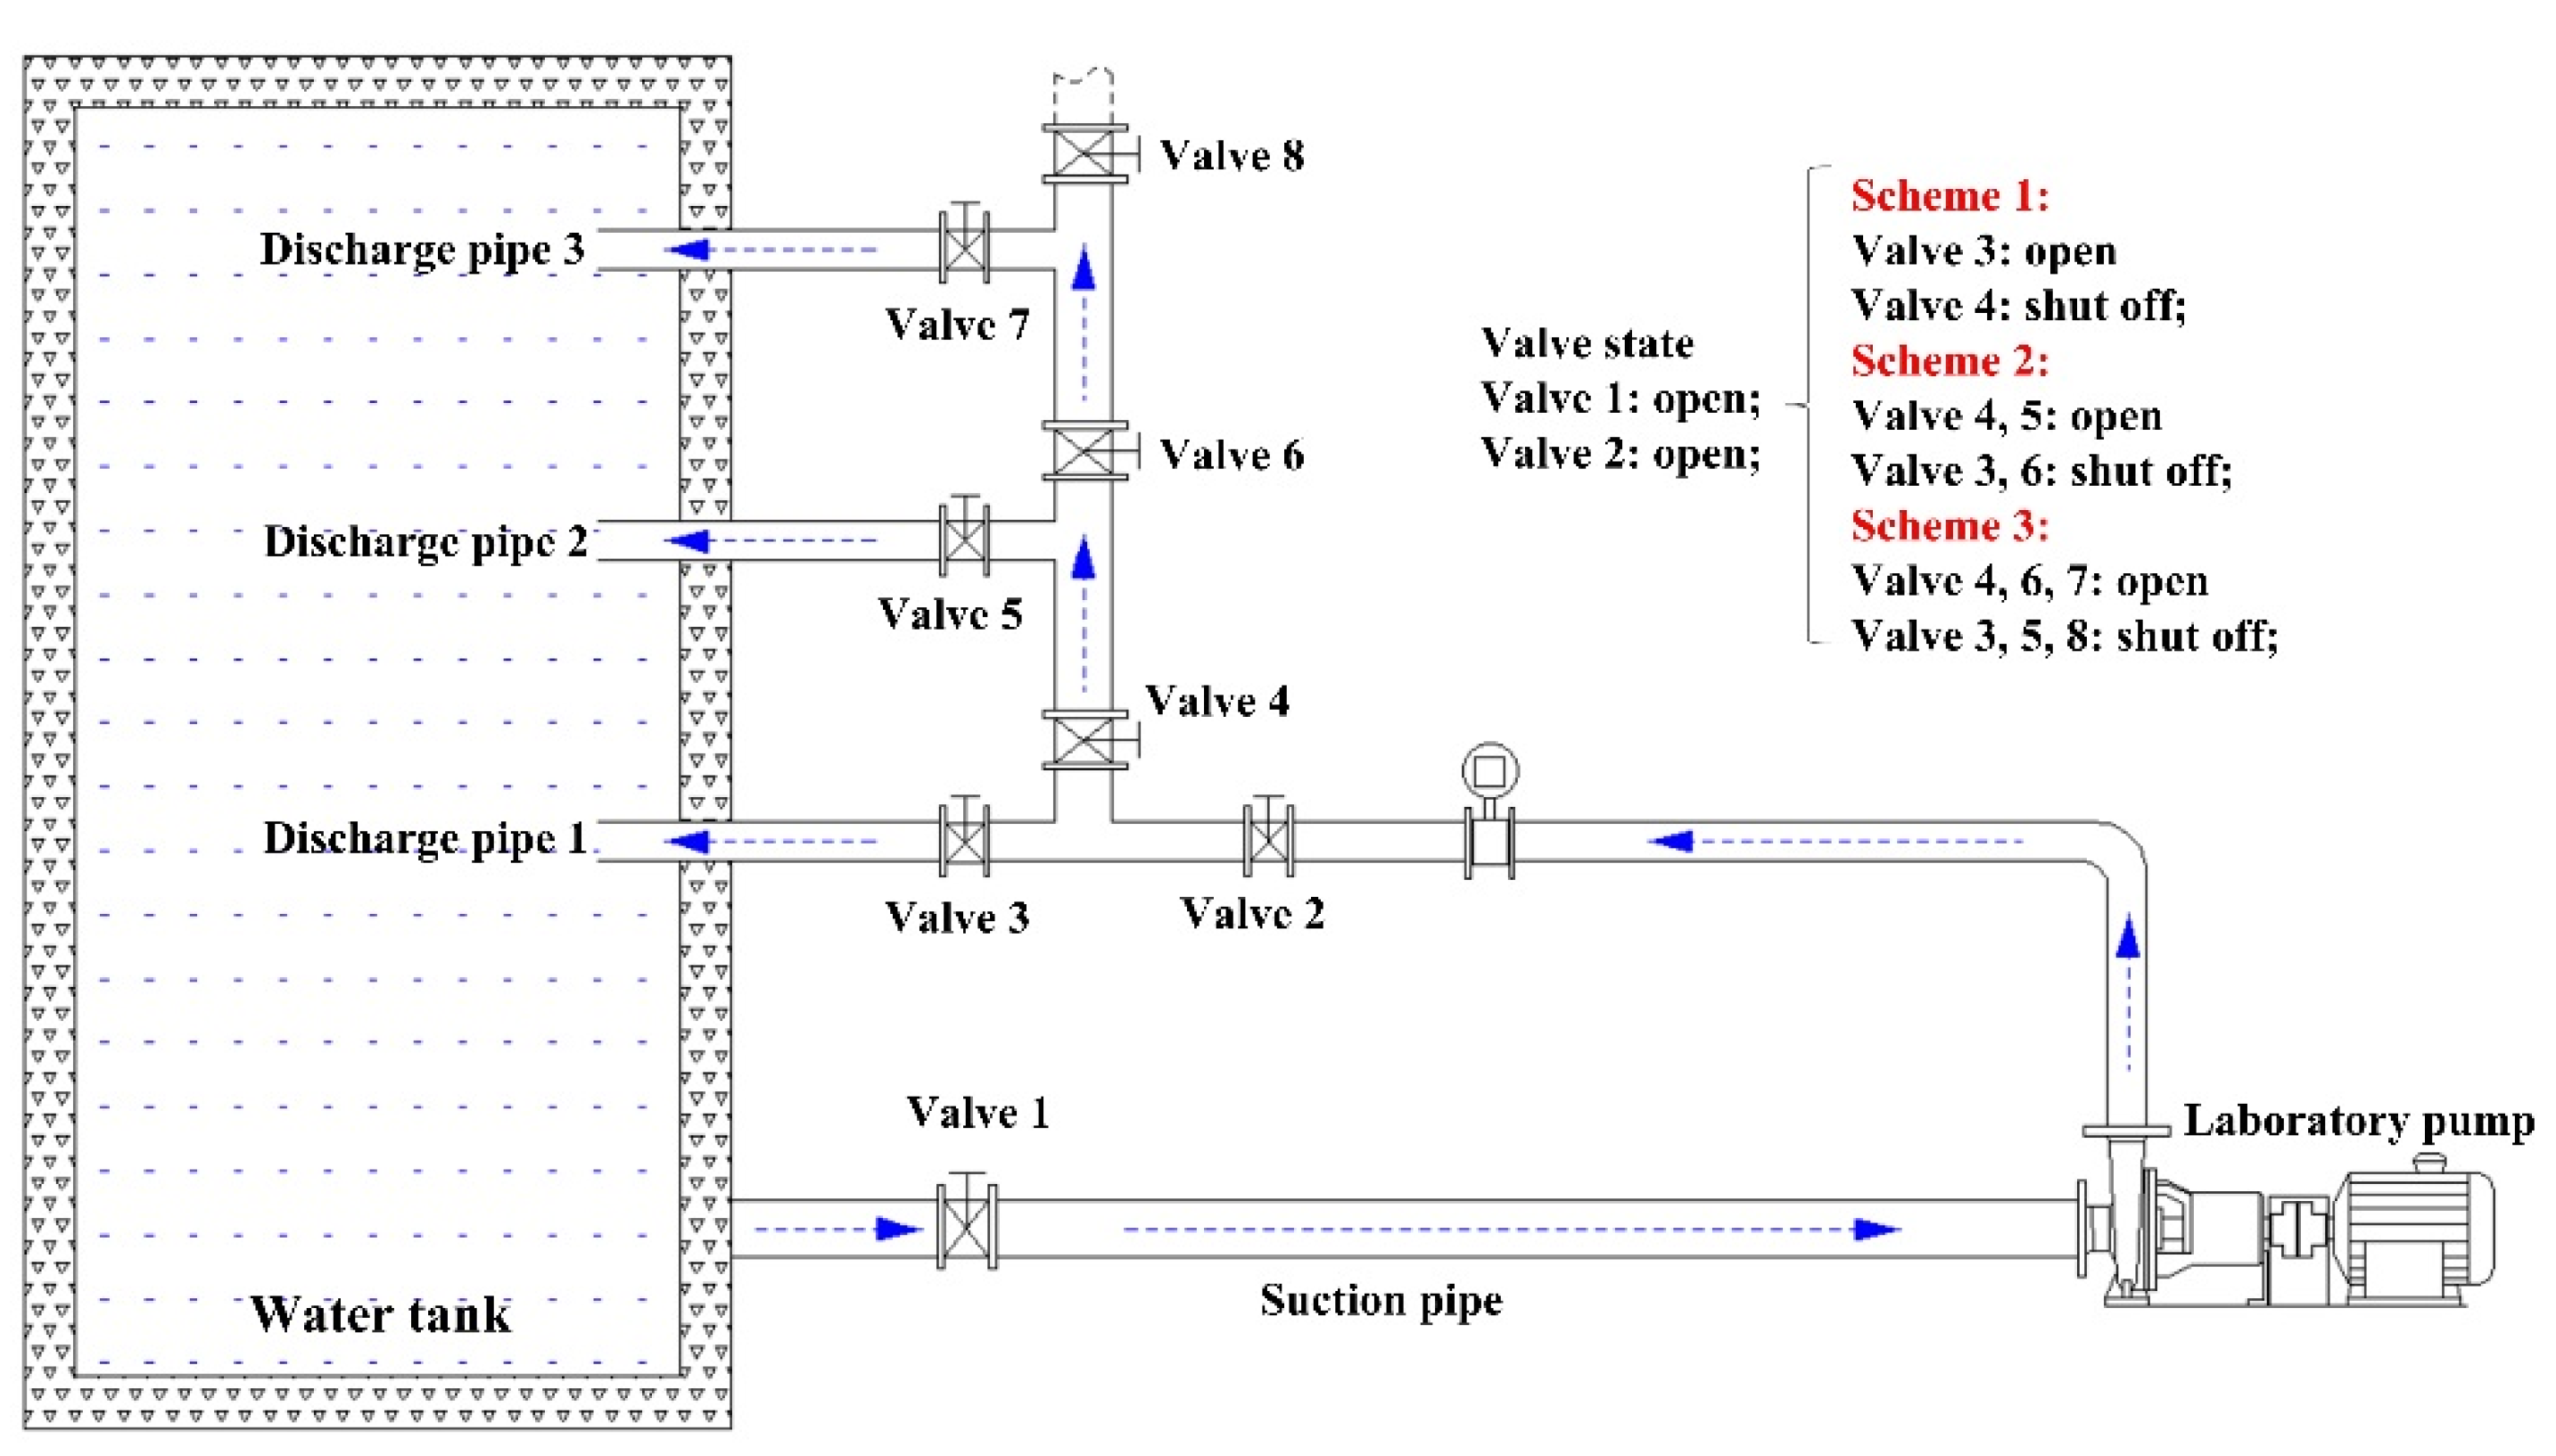
2. Pump and Experimental Configuration

The laboratory pump, with an impeller of 7 double-curved blades, was investigated to measure the transient pressure fluctuations for different hydraulic systems. Figure 1 presents a schematic view distribution of the pressure monitors and the experimental instrumentation. In this system, three piezoelectric pressure sensors were mounted on the wall of the laboratory pump to observe the change of pressure pulsations at different positions. The monitor point 1 was set up at the volute casing, close to the cutwater region. The monitor points 2 and 3 were installed at the discharge pipe, between the pump outlet and the dead-end branch respectively. The rotational speed of the pump was set to 900 rpm by means of a variable-frequency drive. In order to capture the apparent pressure pulsation phenomenon, the operating condition of the pump was set to a very low flow-rate 9 m3/h, producing relatively high pressure pulsations at its blade-passage frequency. During each test, a multi-channel device (IMC Cronos-PL2) recorded the pressure fluctuation signals from several high sensitivity piezoelectric sensors (Kistler 701A), each connected to a charge amplifier (Kistler type 5018). Then the pressure signals were post-processed as follows.

3. Methodology

To investigate the effect of the hydraulic circuit on the pressure pulsations in the centrifugal pump, three different discharge piping schemes by opening and closing the different valve combinations connected with the pump outlet were designed, as can be seen in Figure 2. For Scheme 1, the water only flowed out from the pump outlet toward the discharge pipe 1. For Scheme 2, the valves 1, 2, 4 and 5 were open and the valves 3 and 6 were closed. For Scheme 3, the pump outlet was only connected to the discharge pipe 3, before testing the laboratory pump. During the tests, the rotational speed, flow rate, head of the pump and valve opening of the piping outlet in different discharge piping schemes remained unchanged to ensure the consistency of the operational conditions. To account for variations of the pressure pulsations with the frequency, a frequency domain analysis was carried out by means of the Fast Fourier Transform (FFT) algorithm. Meanwhile, in order to fulfill the periodic requirements and avoid the aliasing and leakage errors as much as possible, pressure fluctuation signals were processed with the Hanning window function.

4. Results and Discussions

In order to verify the repeatability and reliability of the test results, the measurements of the experimental data were duplicated three times for every operational condition in the laboratory pump for each discharge piping scheme. The amplitudes of pressure pulsation at the shaft frequency (fs) and blade passing frequency (fb) were calculated, as presented in Table 1. The results suggested that the magnitude of the pressure pulsations at fs and fb varied for three different discharge piping schemes. Table 2 shows the average values of the pressure pulsations obtained for the three sets of tests. The amplitudes of the pressure pulsations at monitor point 1, close to the cutwater of the volute, had a relatively slight change compared with the other two monitor points, located at pump outlet, under the influence of changing the discharge pipeline. Moreover, the discharge piping schemes had a more significant influence on the amplitudes at fb than that at fs for different monitor points. The maximum deviations of the pressure pulsations in the different discharge piping schemes even exceed 15% at fs and 30% at fb, respectively.

5. Conclusions

Three different discharge piping schemes for a centrifugal pump were proposed by opening and closing the different valves connected with the pump outlet to measure the effect of the discharge piping on the pressure fluctuations induced from the pump. The results suggested that the amplitudes of the pressure pulsations of a constant monitor point changed at fs and fb for the different discharge piping schemes. The variation range of the pressure pulsation magnitudes for the monitor points at the pump outlet is evidently larger than that for the monitor point close to the cutwater of the volute. Therefore, the direct measurement method of pressure pulsation in the pipeline of the model pump does not directly reflect the acoustic properties of the pump itself. Due to the coupling effect of system, in some situations, it might be even seriously misleading.

Author Contributions

G.L. conducted the tests, analyzed the data and wrote the paper; J.P. conceived the study and designed the experiments; Y.W. provided guidance during the investigation.

Acknowledgments

Guidong Li gratefully acknowledges the grant provided by the “China Scholarship Council”.

Conflicts of Interest

The authors declare no conflict of interest.

References

  1. Parrondo, J.; Pérez, J.; Barrio, R.; González, J. A simple acoustic model to characterize the internal low frequency sound field in centrifugal pumps. Appl. Acoust. 2011, 72, 59–64. [Google Scholar] [CrossRef]
  2. Choi, J.S.; McLaughlin, D.K.; Thompson, D.E. Experiments on the unsteady flow field and noise generation in a centrifugal pump impeller. J. Sound. Vib. 2003, 263, 493–514. [Google Scholar] [CrossRef]
  3. Guelich, J.F.; Bolleter, U. Pressure pulsations in centrifugal pumps. J. Vib. Acoust. 1992, 114, 272–279. [Google Scholar] [CrossRef]
  4. Tao, F. The Measurement Study of Flow Induced Noise in Centrifugal Pump. Ph.D. Thesis, Institute of Acoustics, Chinese Academy of Sciences, Beijing, China, 2004. [Google Scholar]
Figure 1. Schematic view of the experimental instrumentation.
Proceedings 02 01488 g001
Figure 2. The test rig of three different discharge piping schemes.
Proceedings 02 01488 g002
Table 1. Three sets of experimental data.
PointShaft FrequencyBlade Passing Frequency
Test/Scheme P1 (Pa)P2 (Pa)P3 (Pa)P1 (Pa)P2 (Pa)P3 (Pa)
First TestScheme 1 82.8166.4145.51947.21003.4644.7
Scheme 286.3163140.71889.5857.6542.9
Scheme 3 82.8176.5156.31889.3749.9508.4
Second TestScheme 1 89.5156.6133.82093.91055.3683.2
Scheme 2 76.9154.2134.21904.9848.1538.7
Scheme 3 75.4178.3158.11910.7767.6552.8
Third TestScheme 1 80.4146.8124.22094.31057.6683.7
Scheme 2 88.8138.1113.31943.4848.2540.9
Scheme 3 87.2163.4142.51910.3849.8655.5
Table 2. The average of three sets of experimental data.
PointShaft FrequencyBlade Passing Frequency
Scheme P1 (Pa)P2 (Pa)P3 (Pa)P1 (Pa)P2 (Pa)P3 (Pa)
Scheme 184.2156.6134.52045.11038.8670.5
Scheme 284.0151.8129.41912.6851.3540.8
Scheme 381.8172.7152.31903.4789.1572.2
Max deviation2.93%13.77%15.04%7.44%31.64%23.98%
Publisher’s Note: MDPI stays neutral with regard to jurisdictional claims in published maps and institutional affiliations.

