Proceeding Paper

Analysis Technique by Laser-Induced Breakdown Spectroscopy of Powder Mineral and Slurry Samples †

by
German Marcos-Robredo
1,*,
Miguel Angel Rey-Ronco
1 and
Teresa Alonso-Sánchez
2
1
Department of Energy, University of Oviedo, 33004 Mieres, Spain
2
Department of Exploitation and Prospecting Mines, University of Oviedo, 33004 Oviedo, Spain
*
Author to whom correspondence should be addressed.
Presented at the 2nd International Research Conference on Sustainable Energy, Engineering, Materials and Environment (IRCSEEME), Mieres, Spain, 25–27 July 2018.
Proceedings 2018, 2(23), 1461; https://doi.org/10.3390/proceedings2231461
Published: 6 November 2018

Abstract

:
In this article, the results of a methodology to perform the elemental analysis of samples from mining borehole samples using the Laser-Induced Breakdown Spectroscopy (LIBS) technique are presented. The developed method can be carried out either on powder and on slurry samples, which would comparable to the samples obtained in a mineral processing plant.

1. Introduction

The Laser-Induced Breakdown Spectroscopy, LIBS is a technique that allows quantitative and qualitative analysis of a large number of elements. The LIBS technique consists of focusing on the sample, pulsed laser radiation (typically pulses of the order of nanoseconds or less) with sufficient irradiance to produce the ablation of the material and generate a plasma. Each element has a characteristic emission spectrum. If the spectrum emitted is studied, the composition of the sample can be determined.
The emission spectrum of a sample is composed of the sum of the spectra of the different elements present in it. The intensity of the peaks will be a function of the ionization energy of each element and the amount of ionized element [1].
In this article, the results of a methodology to perform the elemental analysis of samples from mining borehole samples using the Laser-Induced Breakdown Spectroscopy (LIBS) technique are presented. The developed method can be carried out either on powder and on slurry samples, which would comparable to the samples obtained in a mineral processing plant.

2. Materials and Methods

Five samples from mining research drilling have been studied. The samples come from core borehole and have WO3 contents between 2 and 12% according to the chemical analyzes. They are crushed to obtain fine grain material. The samples used have been previously analyzed by chemical analysis to know their composition (Table 1). These analyzes were subsequently used to validate the results of the analysis performed by the LIBS technique.
The equipment used:
An Nd:YAG laser NL301HT from EKSPLA has been used to generate high energy 4.5 ns laser pulses at 1064 nm. The signal is collected by a Czerny-Turner spectrometer Shamrock SR-500i-D1 from Andor Technology and registered by an iCCD (intensified Charge-Coupled Device) camera Andor iStar.
The Figure 1 shows the schemas of the experimental montages for solid samples (a) and slurries (b). The optical part is similar and only the area of incidence of the laser pulse varies. The solid samples are displaced to avoid incising twice on the same point with a Newport TRA25CC positioner. The pulps are recirculated by a Plaset 7862 pump and the laser falls directly on the jet. The signal is collected by a set of lenses and optical fiber that after being separated by wavelengths in the spectrometer is recorded by the iCCD.
To determine the most interesting wavelengths, the database of the NIST Atomic Spectra Database Lines Form was used. The highest emission intensity occurs at 400.87506 nm and has been used in this article [2,3].

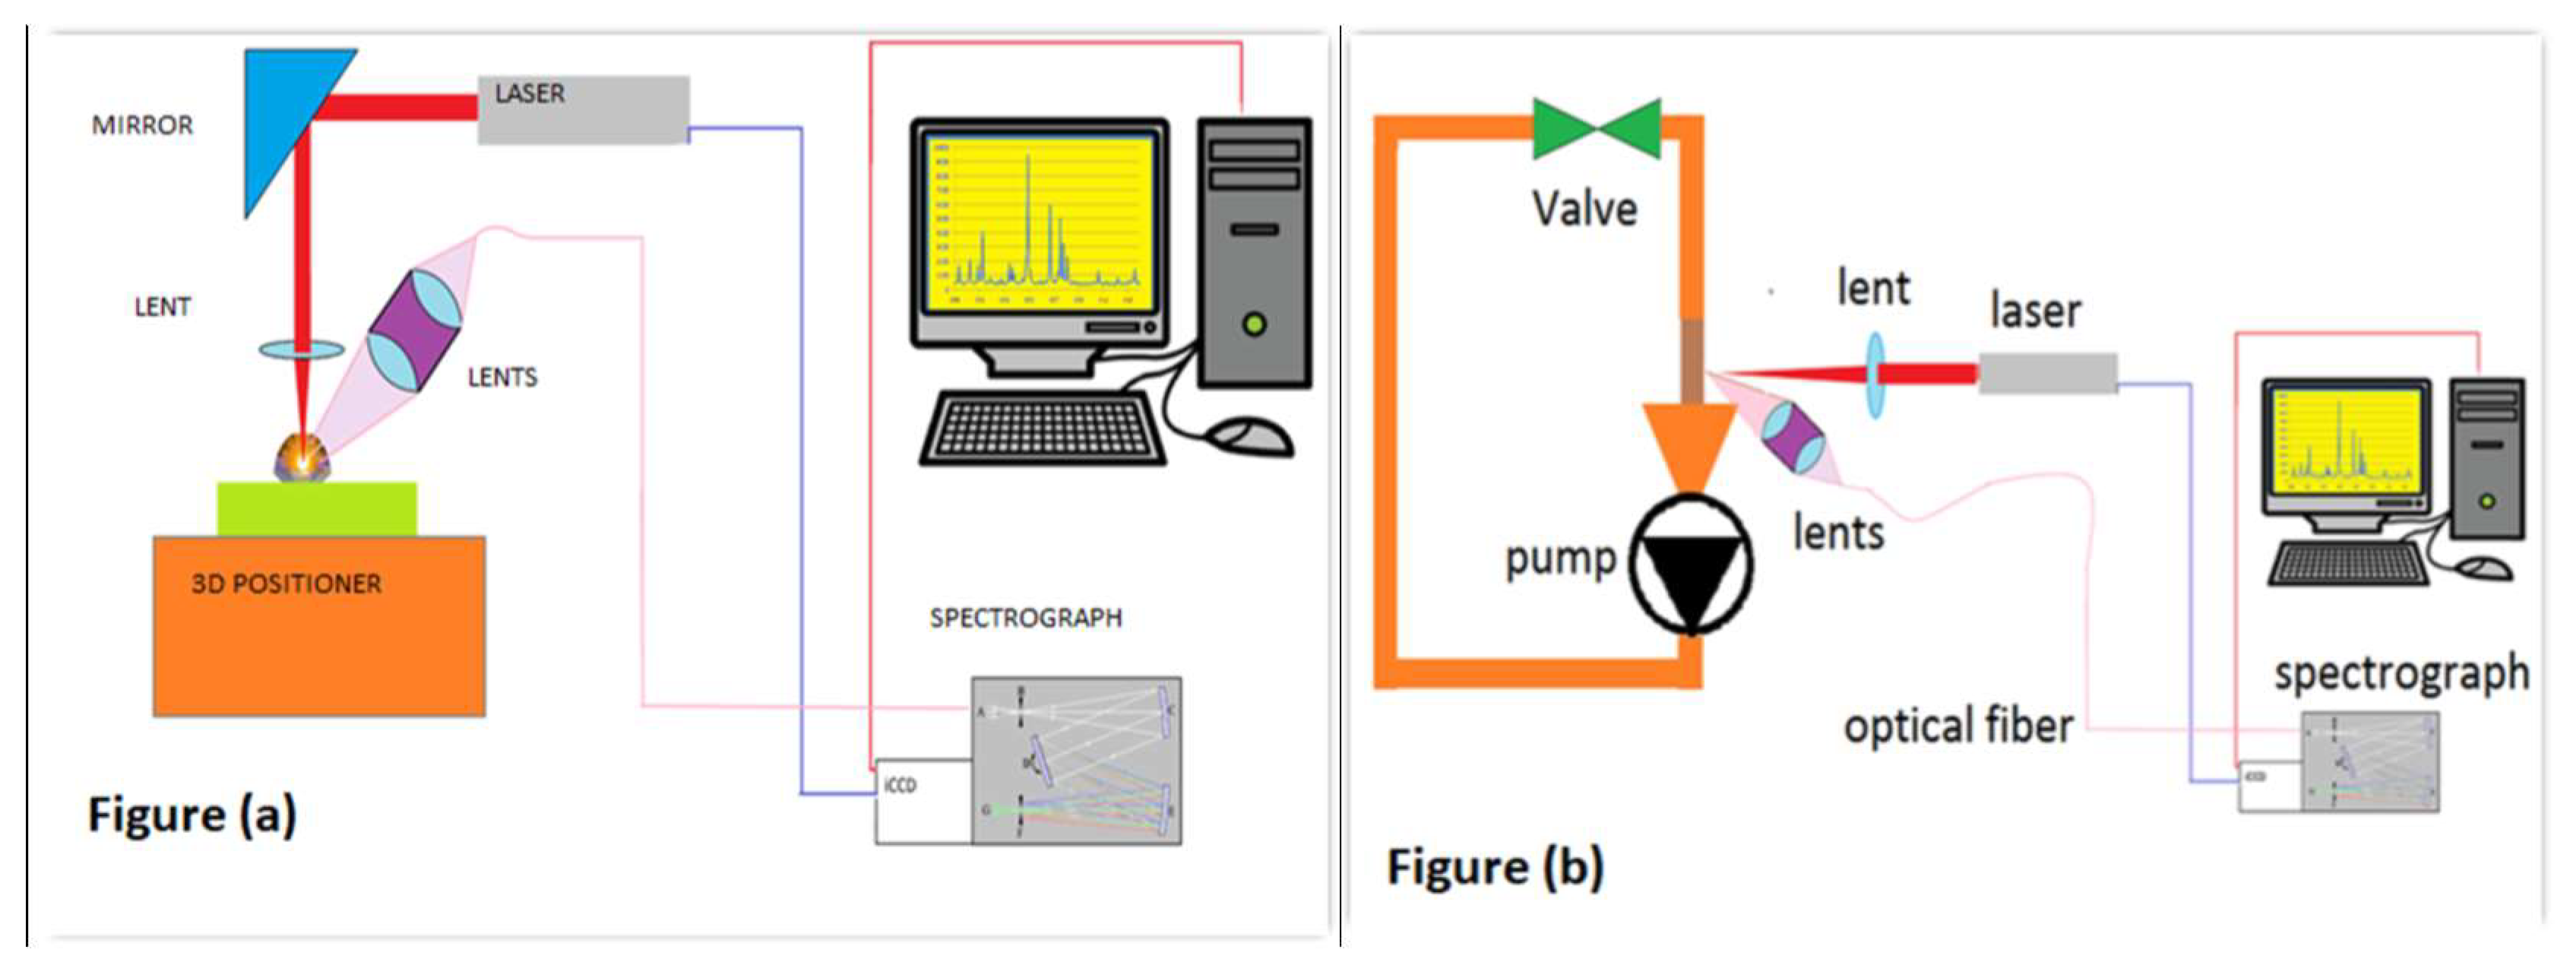
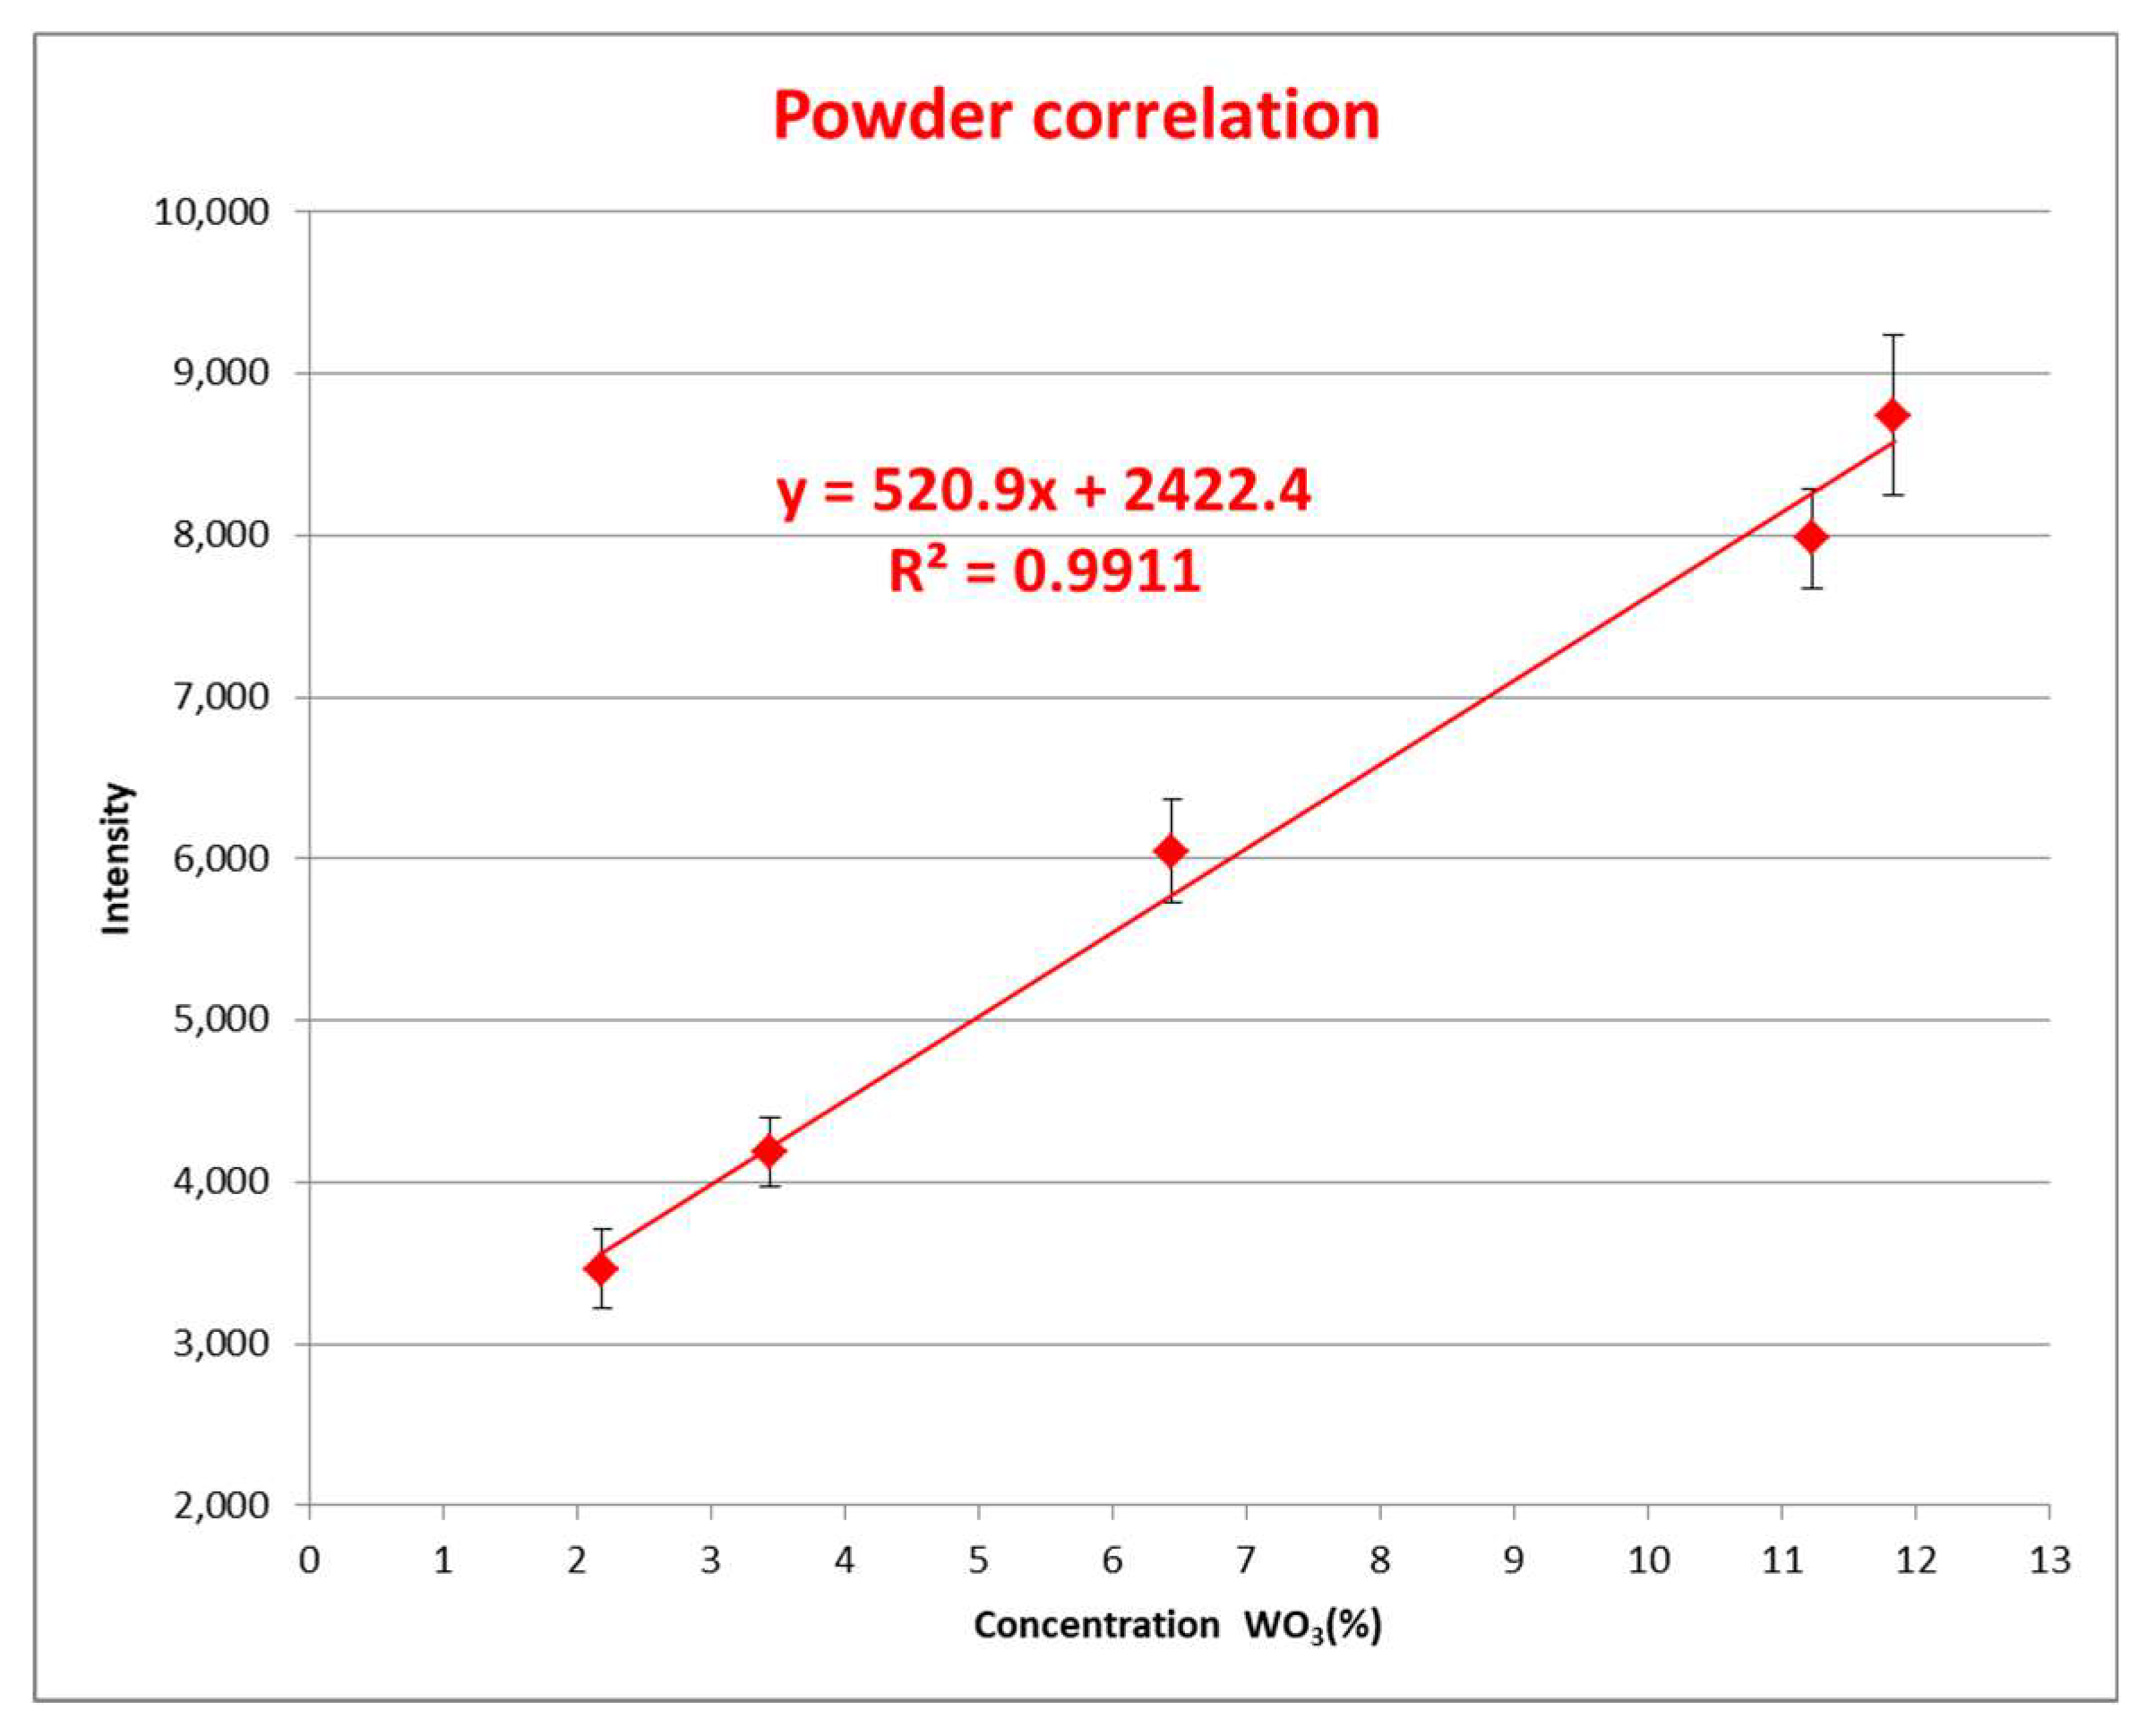
2.1. Methodology for Powder Samples

A double-sided tape is placed in a glass sample holder. On this double-sided tape, the mineral powder is poured, the excess dust that has not been adhered is removed. Six series of 100 shots were made to each sample, obtaining an average spectrum of 100 shots around the wavelengths of greatest interest. The positioner moved the sample in horizontal plane avoiding to make shots on the same point. The article [4] was used for the preparation of the experiment.

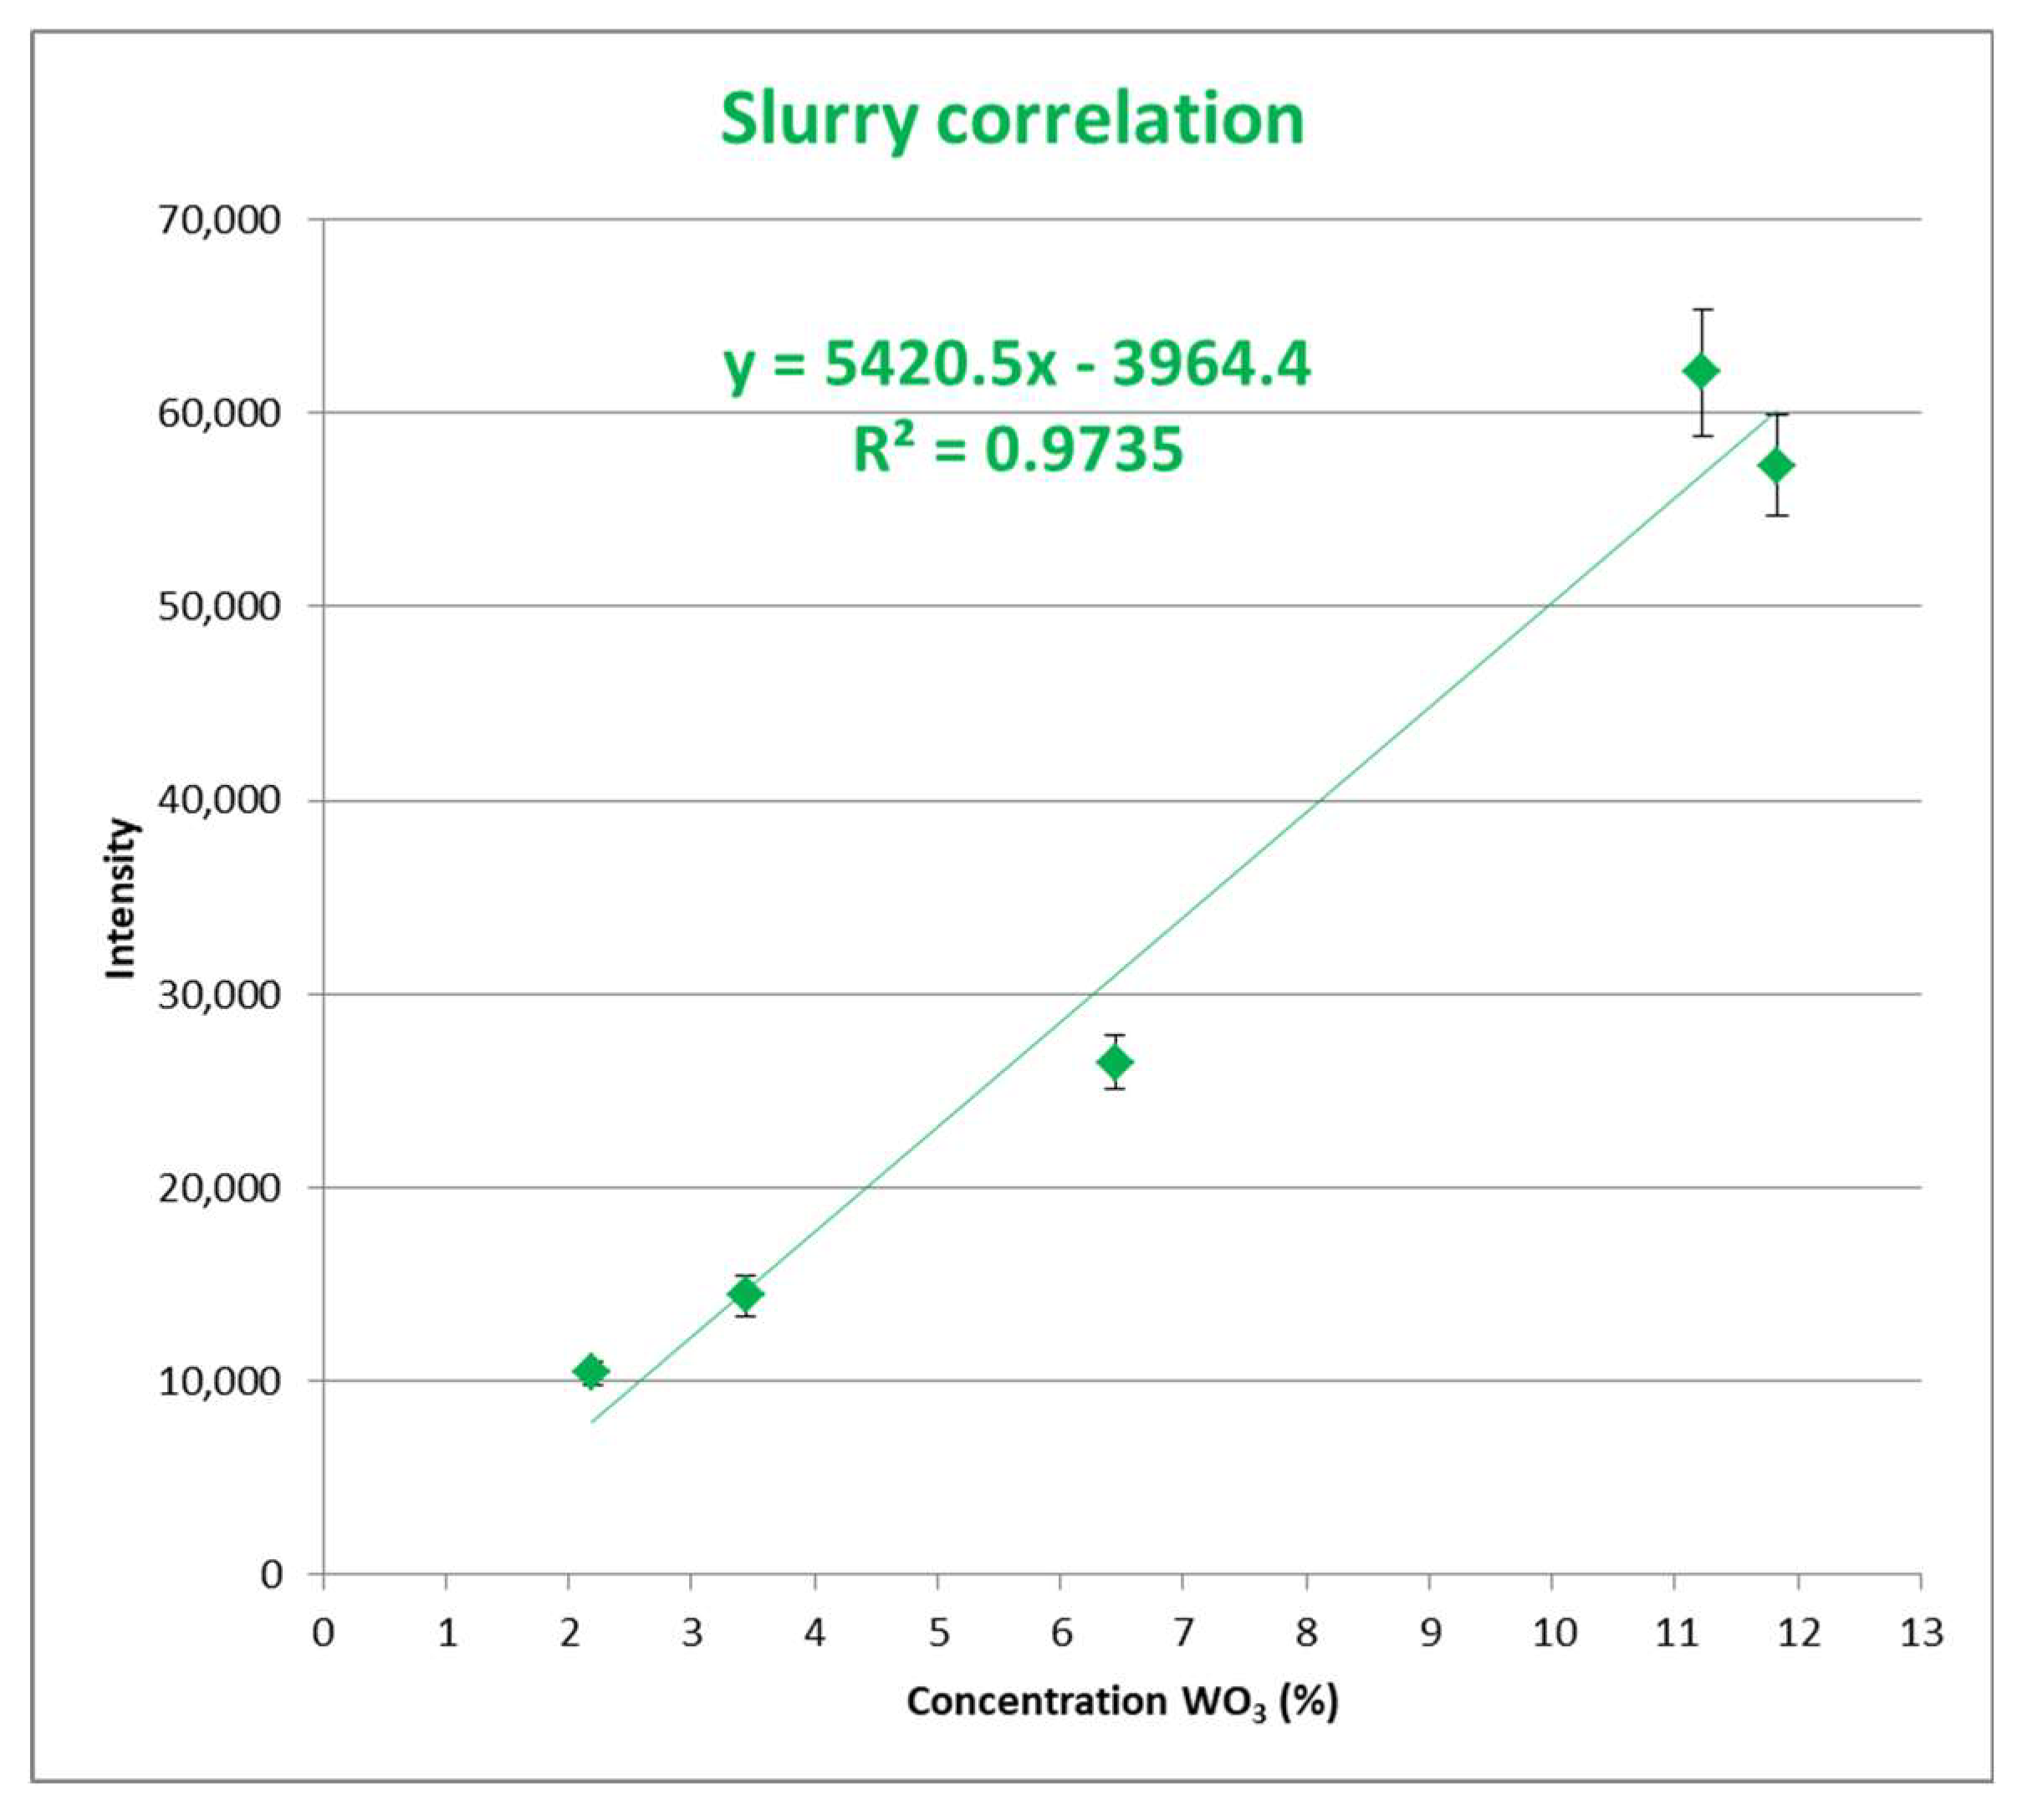
2.2. Methodology for Slurries Samples

In this case we have used a closed circuit to recicle the pulp and shot directly on the jet. To create the slurry, 60 g of sample were mixed with 200 g of water. The samples were recirculated with a paddle pump to achieve a good mix. Six series of 100 shots were made on the jet and an accumulated average spectrum was obtained. Measurement conditions were optimized by increasing the gain in the iCCD. For the realization of the experiment it was started from the exposed in the article [5].

3. Analysis of the Result

Using net signals, without background, a good correlation has been seen between the concentration of mineral of interest and the peak intensity at 400.8 nm. A correlation coefficient “R2 = 0.9911” has been obtained as can be seen in Figure 2.
Similarly, the results of the pulp calibration are shown in Figure 3, with R2 = 0.9735.

4. Conclusions

The analysis by the LIBS technique is applicable to mining samples, both in powder and slurry. Better results have been obtained in the powder samples than in the slurries samples. The analysis of samples in powder requires a minimum preparation of the samples, is fast and has given good results.
We must continue with the study of the direct analysis on the slurries, in order to look for better results. The calibration line does not have the desired precision, which may be due to errors in the procedure.
The samples taken in the plant must be dried to be analyzed if more precision is required. In any case, this drying time is always much less than the time required to analyze the samples with other conventional techniques. The ideal would be to be able to make directly on the slurries of the concentration plants what would eliminate all preparation of the sample but this has not given the expected results.
We have seen the possibility of analyzing other elements present in the sample, such as calcium or sulfur and arsenic. Other less intense peaks of the W have also been analyzed, obtaining different results.

Acknowledgments

This study is funded by “Programa Estatal de Investigación, Desarrollo e Innovación orientada a los Retos de la Sociedad. Convocatoria 2016”. Ministerio de Economía y Competitividad. Reference: CTQ2016-77887-C2-1-R.

References

  1. Asquini, C.P. 19—Laser induced breakdown spectroscopy (LIBS). In Handbook of Solid-State Lasers; Denker, B., Shklovsky, E., Eds.; Woodhead Publishing: Sawston, UK, 2013; pp. 551–571. [Google Scholar]
  2. NIST: Atomic Spectra Database Lines Form. Available online: https://physics.nist.gov/PhysRefData/ASD/lines_form.html (accessed on 11 July 2018).
  3. Strong Lines of Tungsten (W). Available online: http://physics.nist.gov/PhysRefData/Handbook/Tables/tungstentable2.htm (accessed on 31 March 2017).
  4. Álvarez, C.; Pisonero, J.; Bordel, N. Quantification of fluorite mass-content in powdered ores using a Laser-Induced Breakdown Spectroscopy method based on the detection of minor elements and CaF molecular bands. Spectrochim. Acta Part B At. Spectrosc. 2014, 100, 123–128. [Google Scholar] [CrossRef]
  5. Khajehzadeh, N.; Haavisto, O.; Koresaar, L. On-stream and quantitative mineral identification of tailing slurries using LIBS technique. Miner. Eng. 2016, 98, 101–109. [Google Scholar] [CrossRef]
Figure 1. Shows the schematics of the experimental assemblies for solid samples (a) and slurries samples (b).
Proceedings 02 01461 g001
Figure 2. Powder correlation.
Proceedings 02 01461 g002
Figure 3. Slurry samples.
Proceedings 02 01461 g003
Table 1. Samples used in the analyzes LIBS.
SampleConcentration WO3 (%)
Sample A11.829
Sample B11.224
Sample C6.444
Sample D3.443
Sample E2.194
Publisher’s Note: MDPI stays neutral with regard to jurisdictional claims in published maps and institutional affiliations.

