Proceeding Paper

5 MW Wind Turbine Annual Energy Production Improvement by Flow Control Devices †

by
Aitor Saenz-Aguirre
1,
Sergio Fernandez-Resines
2,
Iñigo Aramendia
2,
Unai Fernandez-Gamiz
2,*,
Ekaitz Zulueta
1,
Jose Manuel Lopez-Guede
1 and
Javier Sancho
2
1
Automatic Control and System Engineering Department, University of the Basque Country UPV/EHU, 01006 Vitoria-Gasteiz, Spain
2
Nuclear Engineering and Fluid Mechanics Department, University of the Basque Country UPV/EHU, 01006 Vitoria-Gasteiz, Spain
*
Author to whom correspondence should be addressed.
Presented at the 2nd International Research Conference on Sustainable Energy, Engineering, Materials and Environment (IRCSEEME), Mieres, Spain, 25–27 July 2018.
Proceedings 2018, 2(23), 1452; https://doi.org/10.3390/proceedings2231452
Published: 6 November 2018

Abstract

:
Several flow control devices have been studied in recent years. Majority of them were designed firstly for aeronautical purposes. At present many research is aimed to introduce these devices in wind turbines (WTs) in order to optimize their aerodynamic performance. The main goal of the present work is to analyze the influence of passive flow control devices, Vortex Generators and Gurney Flaps, on the Annual Energy Production (AEP) of a large Horizontal Axis Wind Turbine (HAWT). Consequently, BEM based calculations were performed in order to study their effect on the NREL offshore 5 MW Baseline Wind Turbine. Obtained results show an increment in the maximum value of the power coefficient, C p _ m a x , and a considerable improvement of the AEP.

1. Introduction

Flow control devices are known for their good performance when controlling flow across WT blades. As a result, aerodynamic performance and energy production of the system can be considerably improved. Over the last years, several flow control devices have been extensively studied, Johnson et al. [1]. Most of them were initially designed for aeronautical issues and, nowadays, researchers are working to optimize and introduce them in WTs [2,3].
These devices are usually classified according to their operating principle into two groups: passive or active [4,5]. Vortex generators and Gurney flaps seem to be two of the most capable passive devices. A Vortex Generator (VG) consists of two vanes, which modify the boundary layer fluid motion bringing momentum from the outer flow region into the inner flow region of the wall bounded flow. A Gurney flap (GF) is a mere vane positioned normal to the upper or lower side of the airfoil close to the trailing edge. Its height is within 1% and 2% of the airfoil chord length. GFs can raise the total lift of the airfoil but they reduce the drag once they get their adequate size.
Holst et al. [6] state an adverse side-effect of the utilization of GFs on WT blades, the shedding of additional vortices. In an attempt to characterize the effect of the GF on the wake left by the turbine blade, Holst et al. [6] analyze the structure, velocity and frequencies of the induced vortices. Relevancy of this concept lies on the possible influence of the generated turbulent wakes on wind speed and direction measurement devices. Hence, WT control strategies, such as, yaw control system, can be negatively affected, and due to misoperation of the yaw control, fatigue loads in the WT blades and Annual Energy Production (AEP) of the wind farm can worsen.
The main objective of the present work is to study the influence of mounting passive flow control devices on the AEP of a multi megawatt HAWT. To that end, wind speed data of the year 2016, at 10 m and 50 m, was obtained from the NASA Earth data website in the location of the Hywind Pilot Park. This data was extrapolated to the hub height (90 m) of the 5 MW NREL reference wind turbine, Jonkman et al. [7], and BEM-based calculations were performed based on the algorithm developed by Fernandez-Gamiz et al. [8]. All the experimental polar curves have been made available by TU Delft for the AVATAR project. The data obtained from wind tunnel experiments at the Low-Speed Tunnel of TU Delft at the Reynolds number of Re = 2 × 10⁶ are taken into account in the current investigation. Full details of the experimental work can be found in Timmer et al. [9].
Additionally, interaction of the passive flow control devices with the WT control system, in terms of unreal wind speed and direction measurements, and their influence on the whole wind farm AEP is to be studied in future works.

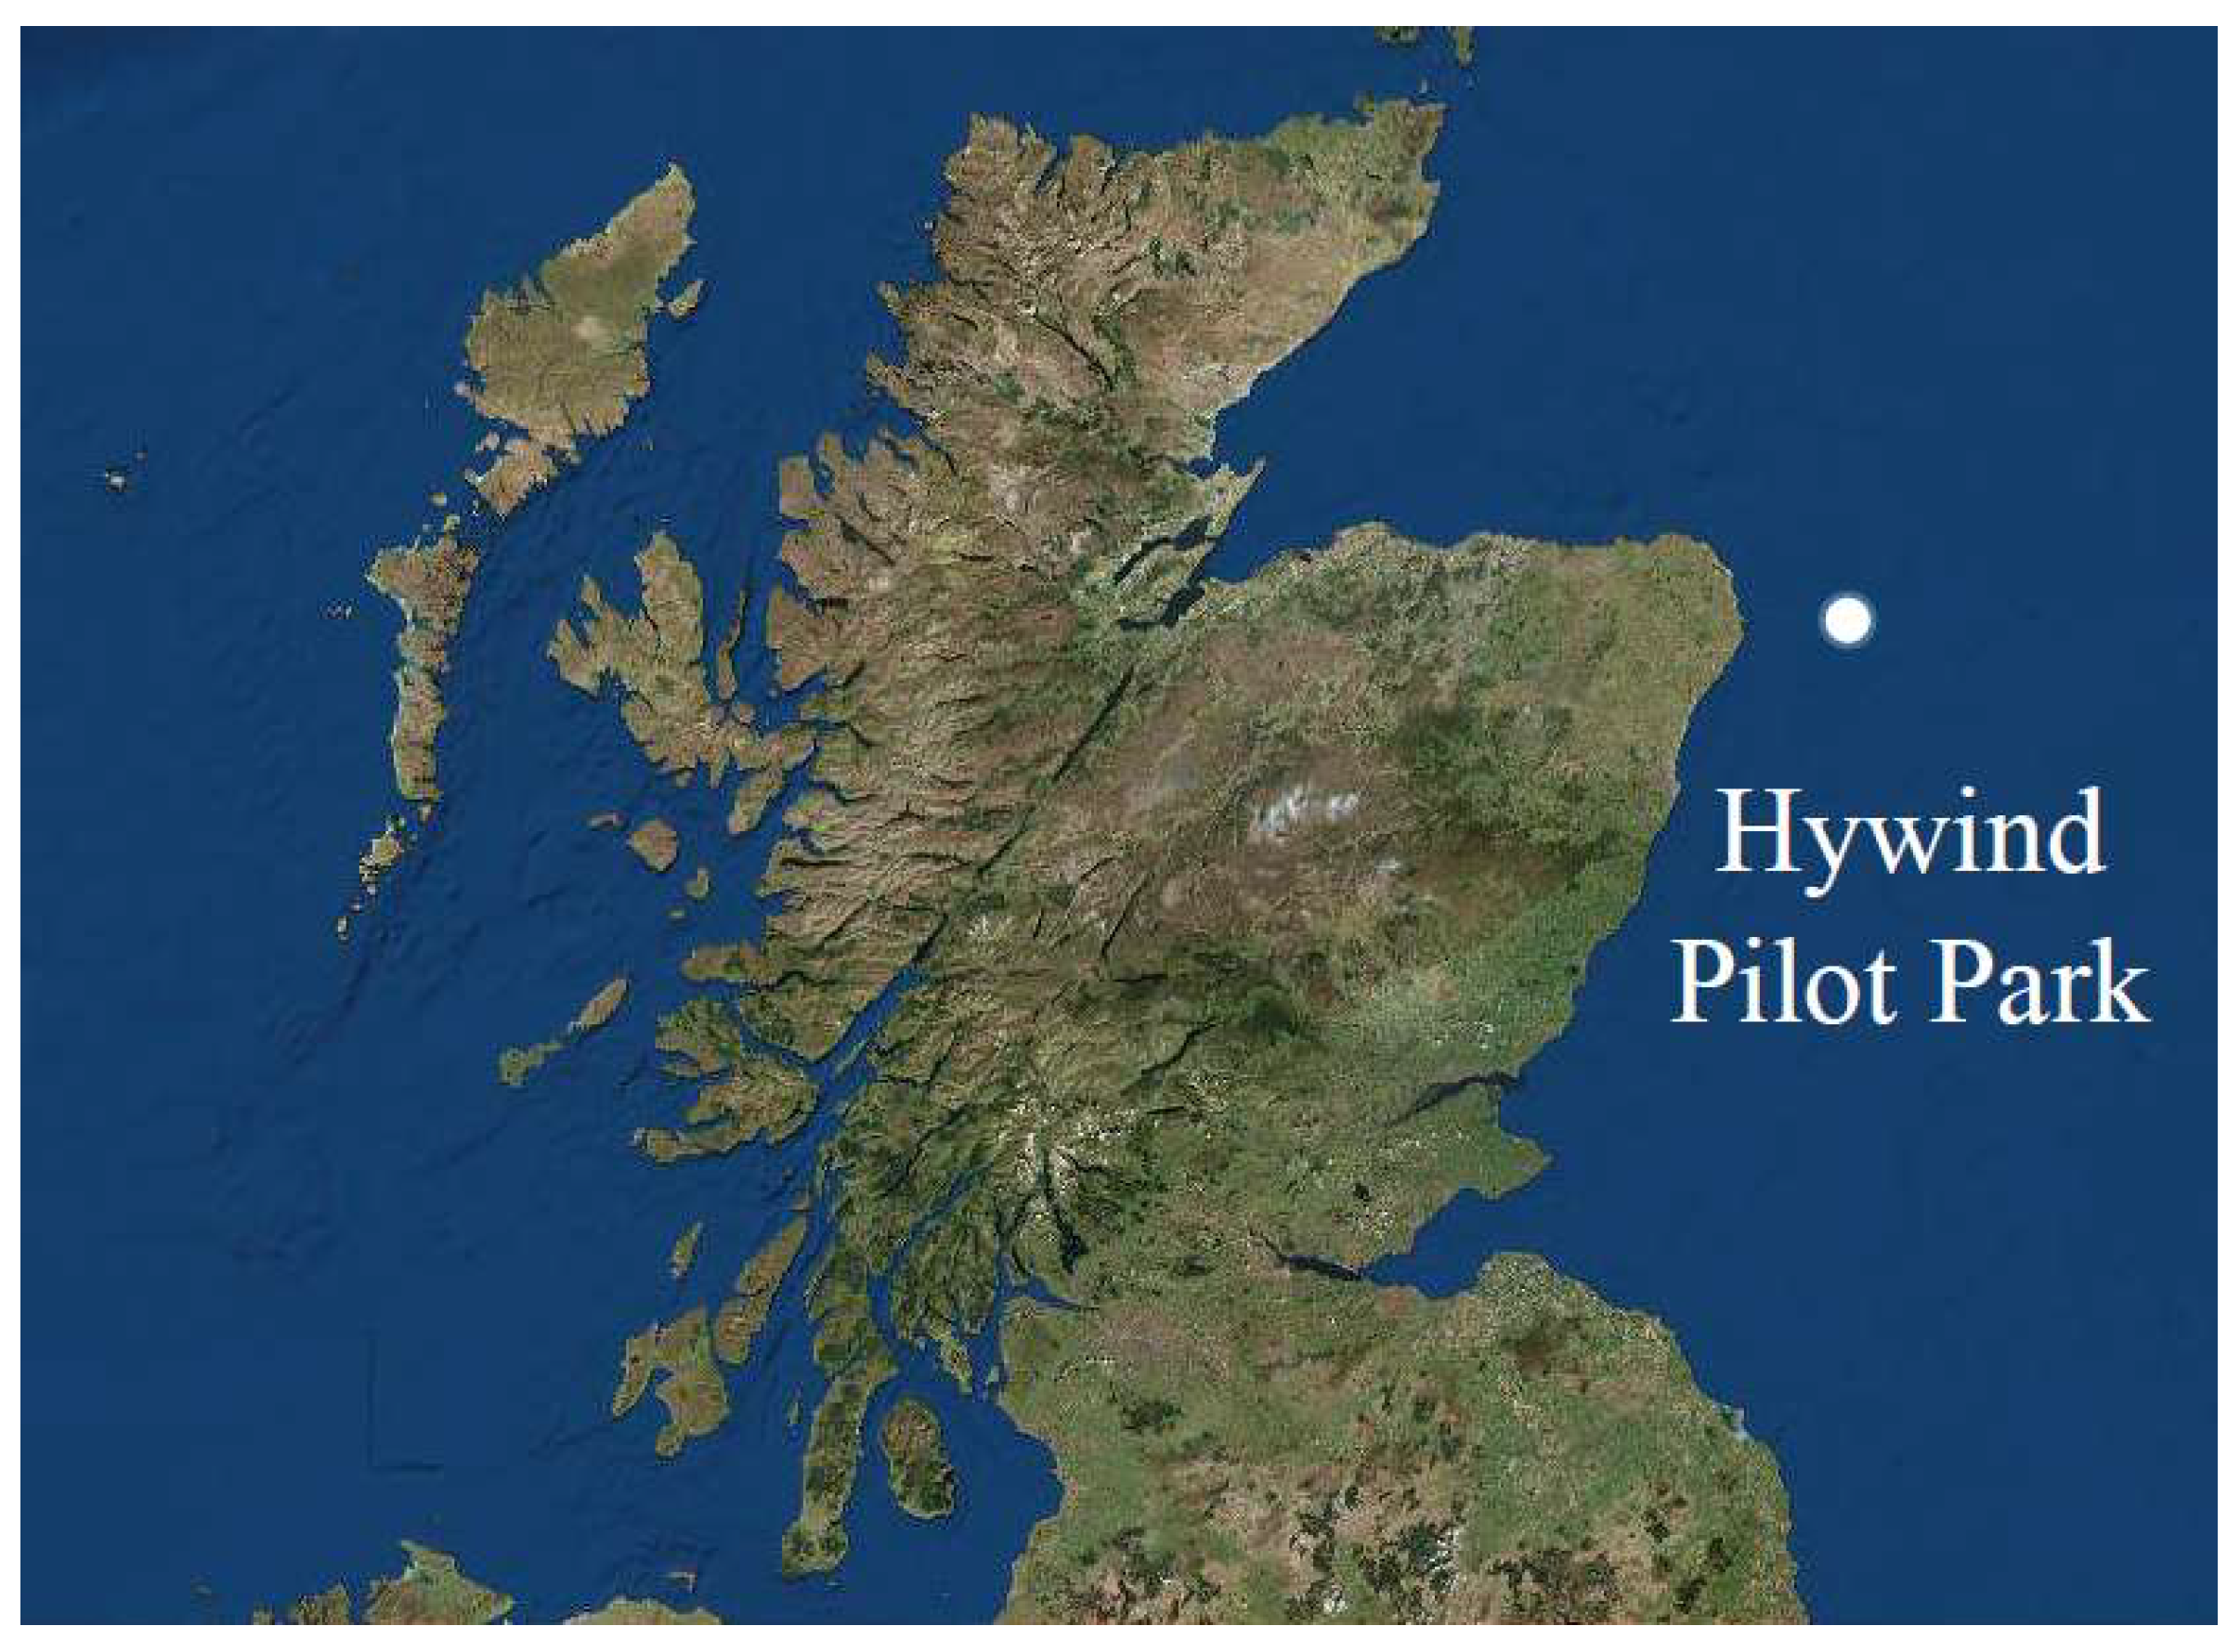
2. Wind Turbine Location

Wind resource data used in this paper has been obtained from the NASA Earthdata website [10]. Normally, wind speed averages can be extracted in three different time intervals: 1-hourly, 3-hourly and monthly. In order to make the best possible estimation, 1-hourly time averages have been selected.
Wind speed data of the year 2016 was used to make a wind profile and subsequent calculations of AEP. The area, from which data is extracted, is located in the North Sea near the coast of Scotland. This particular area is the location of the so-called Hywind Pilot Park, see Figure 1. Hywind Pilot Park is the name of the wind farm, in which five WTs, each one of 6 MW power capacity, are being installed.

3. Annual Wind Speed Characterization

The first goal of this study is the calculation of the wind speed profile at the hub height of the WT. Since only wind speeds at heights 2 m, 10 m and 50 m are available in the NASA Earthdata data base, extrapolation of the data to the hub height of 90 m is necessary, Jonkman et al. [7]. The objective is to obtain an average wind speed at the turbines height so that the AEP can be calculated. Effect of the surroundings on the wind speed needs to be observed and taken into account in order to extrapolate with highest accuracy possible. The range of elevation in which wind speeds are affected by the Earth’s surface, creating turbulence, is defined as the atmospheric boundary layer (ABL).
Wind speed data at two different heights is interrelated by means of the Hellmann exponential rule, see Equation (1), where v and v0 are the wind speed at heights H and at height H0 respectively, being H0 the referenced height which is often defined as a 10 m height. Coefficient α is known as the Hellmann exponent or friction coefficient, and is set to 1 7 .
v v 0 = ( H H 0 ) α
After correlation, Figure 2 shows the wind speed profile of the year 2016 for a 90 m height:

4. Simulation of Wind Turbine Energy Production

In this section the aerodynamic behavior of a clean turbine, i.e., a turbine with clean airfoils, is collated with the aerodynamic behavior of a turbine with airfoils equipped with VGs and GFs. To be precise, incidences of the flow control mechanisms on the AEP are analyzed for the NREL 5 MW turbine, presented by Jonkman et al. [7]. The NREL 5 MW reference wind turbine represents the foundation of the up-to-date and coming offshore HAWT. Hence, many research studies have been based on this turbine. This design of a 5MW wind turbine is based on the data obtained from the DOWEC study; with a concept from the UpWind project. The chord configuration and the airfoils used in this study are the same of the NREL. Detailed data on the DU family of the airfoils used is presented in Timmer et al. [9].
Weibull distribution was applied to the results obtained in order to estimate the influence of the wind speeds along one whole year on the AEP. Distribution along year 2016 has been taken into account in this work. Figure 2 depicts the wind data of the year 2016 interpolated for the value of the hub height of the NREL 5 MW turbine, i.e., 90 m.
As a result, following Weibull parameters have been obtained for the wind profile depicted in Figure 2: k = 2.23 which is the shape parameter, and A = 8.57 m/s which is the scale parameter. Both parameters stand for the characteristic mean wind speed.
According to the results, shown in Table 1, for the airfoil cases and the wind turbine location analysed, AEP of the WT with flow control devices is incremented by a 3.85% in comparison with the WT without these devices. This increase is much higher than the one achieved by Ebrahimi et al. [11] in the same wind turbine but with plasma actuators, in which the increment for the best case does not exceed the 0.85%.

5. Conclusions

The effects of mounting passive flow control devices, Gurney Flaps and Vortex Generators, on a multi megawatt horizontal axis wind turbine have been analysed in this paper. BEM based computations have been performed and the WT control system has been modeled in order to study the influence of assembling VGs and GFs on the performance of the system. According to the results obtained, for the airfoil cases and the WT location studied, an increment of 3.85% is achieved in the AEP with the introduction of these flow control devices.

Author Contributions

A.S.-A., S.F.-R. and I.A. wrote the manuscript and participated in the AEP increment calculations. U.F.-G. and E.Z. helped with the BEM based solver and guided redaction of the manuscript. J.M.L.-G. and J.S. provided constructive instructions in the process of preparing the paper.

Acknowledgments

This project has been financed by the Educational Innovative Project P.I.E. 10-2018/2019 call of the University of the Basque Country UPV/EHU.

Conflicts of Interest

The authors declare no conflict of interest.

References

  1. Johnson, S.J.; van Dam, C.P. Active Load Control Techniques for Wind Turbines; SAND2008-4809; Sandia National Laboratories: Livermore, CA, USA, 2008. [Google Scholar]
  2. Fernandez-Gamiz, U.; Velte, C.M.; Réthoré, P.; Sørensen, N.N.; Egusquiza, E. Testing of self-similarity and helical symmetry in vortex generator flow simulations. Wind Energy 2016, 19, 1043–1052. [Google Scholar] [CrossRef]
  3. Martínez-Filgueira, P.; Fernandez-Gamiz, U.; Zulueta, E.; Errasti, I.; Fernandez-Gauna, B. Parametric study of low-profile vortex generators. Int. J. Hydrogen. Energy 2017, 42, 17700–17712. [Google Scholar] [CrossRef]
  4. Aramendia-Iradi, I.; Fernandez-Gamiz, U.; Sancho-Saiz, J.; Zulueta-Guerrero, E. State of the art of active and passive flow control devices for wind turbines. Dyna 2016, 91, 512–516. [Google Scholar]
  5. Aramendia, I.; Fernandez-Gamiz, U.; Ramos-Hernanz, J.; Sancho, J.; Lopez-Guede, J.M.; Zulueta, E. Flow Control Devices for Wind Turbines. In Energy Harvesting and Energy Efficiency: Technology, Methods, and Applications; Bizon, N., Mahdavi Tabatabaei, N., Blaabjerg, F., Kurt, E., Eds.; Springer International Publishing: Cham, Switzerland, 2017; pp. 629–655. [Google Scholar]
  6. Holst, D.; Bach, A.; Nayeri, C.; Paschereit, C.; Pechlivanoglou, G. Wake Analysis of a Finite Width Gurney Flap. J. Eng. Gas Turbines Power 2015, 138. [Google Scholar] [CrossRef]
  7. Jonkman, J.; Butterfield, S.; Musial, W.; Scott, G. Definition of a 5MW Reference Wind Turbine for Offshore System Development; NREL/TP-500-38060; National Renewable Energy Laboratory: Golden, CO, USA, 2009. [Google Scholar]
  8. Fernandez-Gamiz, U.; Zulueta, E.; Boyano, A.; Ansoategui, I.; Uriarte, I. Five Megawatt Wind Turbine Power Output Improvements by Passive Flow Control Devices. Energies 2017, 10, 742. [Google Scholar] [CrossRef]
  9. Timmer, W.; Rooij, R.P.J.O.M. Summary of the Delft University Wind Turbine Dedicated Airfoils. J. Sol. Energy Eng. Trans. ASME 2003, 125. [Google Scholar] [CrossRef]
  10. Available online: https://earthdata.nasa.gov/ (accessed on 5 January 2017).
  11. Ebrahimi, A.; Movahhedi, M. Power improvement of NREL 5-MW wind turbine using multi-DBD plasma actuators. Energy Convers. Manag. 2017, 146, 96–106. [Google Scholar] [CrossRef]
Figure 1. Location settings from NASA Earthdata.
Proceedings 02 01452 g001
Figure 2. Wind speed profile of the year 2016.
Proceedings 02 01452 g002
Table 1. Assessment of the AEP.
Annual Energy Production
YearClean (W·h)ID25 (W·h)∆AEP (%)
20162.4371 × 10102.5309 × 10103.85
Publisher’s Note: MDPI stays neutral with regard to jurisdictional claims in published maps and institutional affiliations.

