Wiping Systems: Influence of the Surface Tension in Water Film Rupture †


Abstract
:1. Introduction
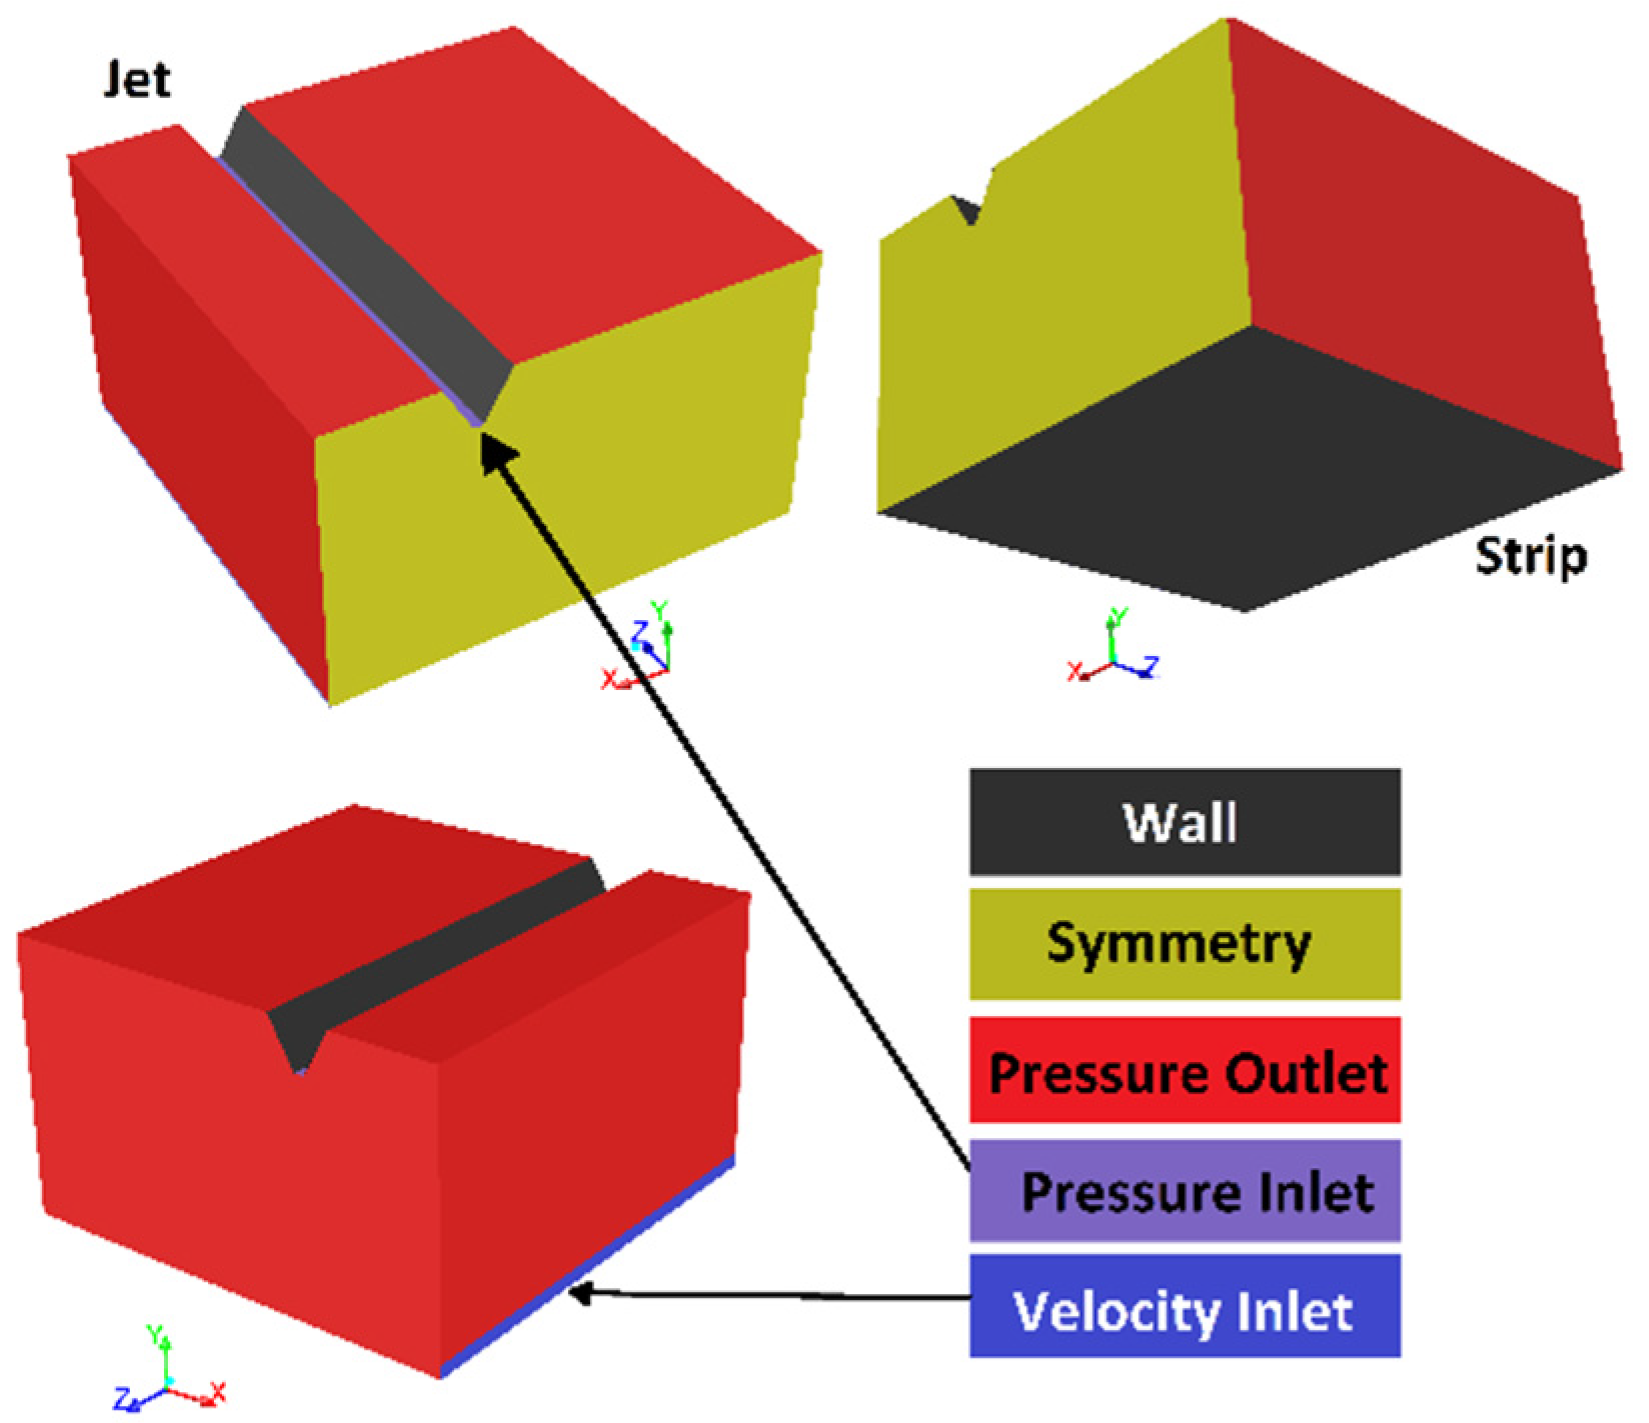
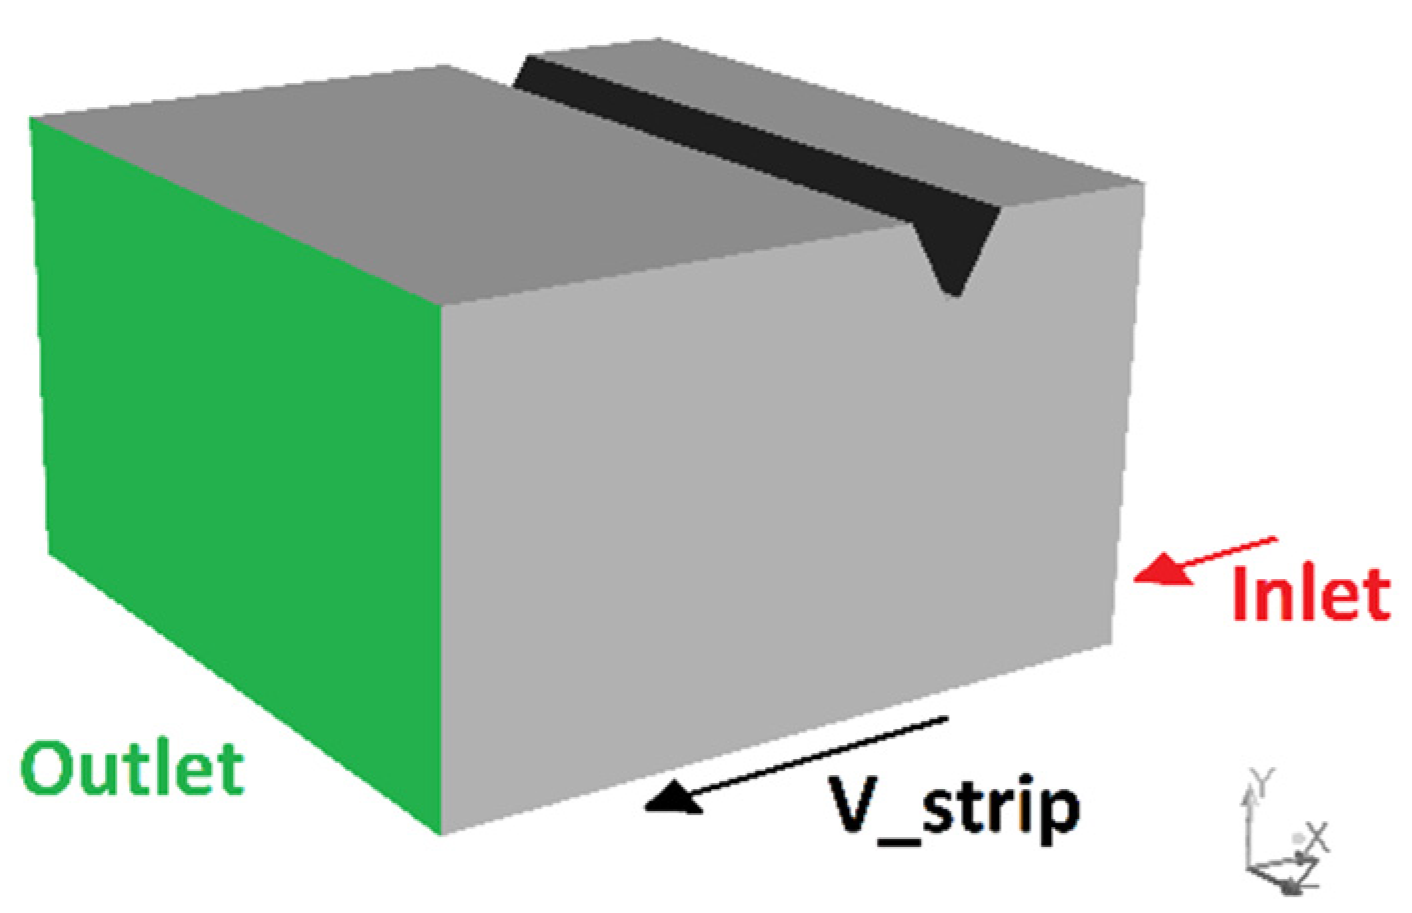
2. Numerical Model
3. Analysis of the Results and Discussion
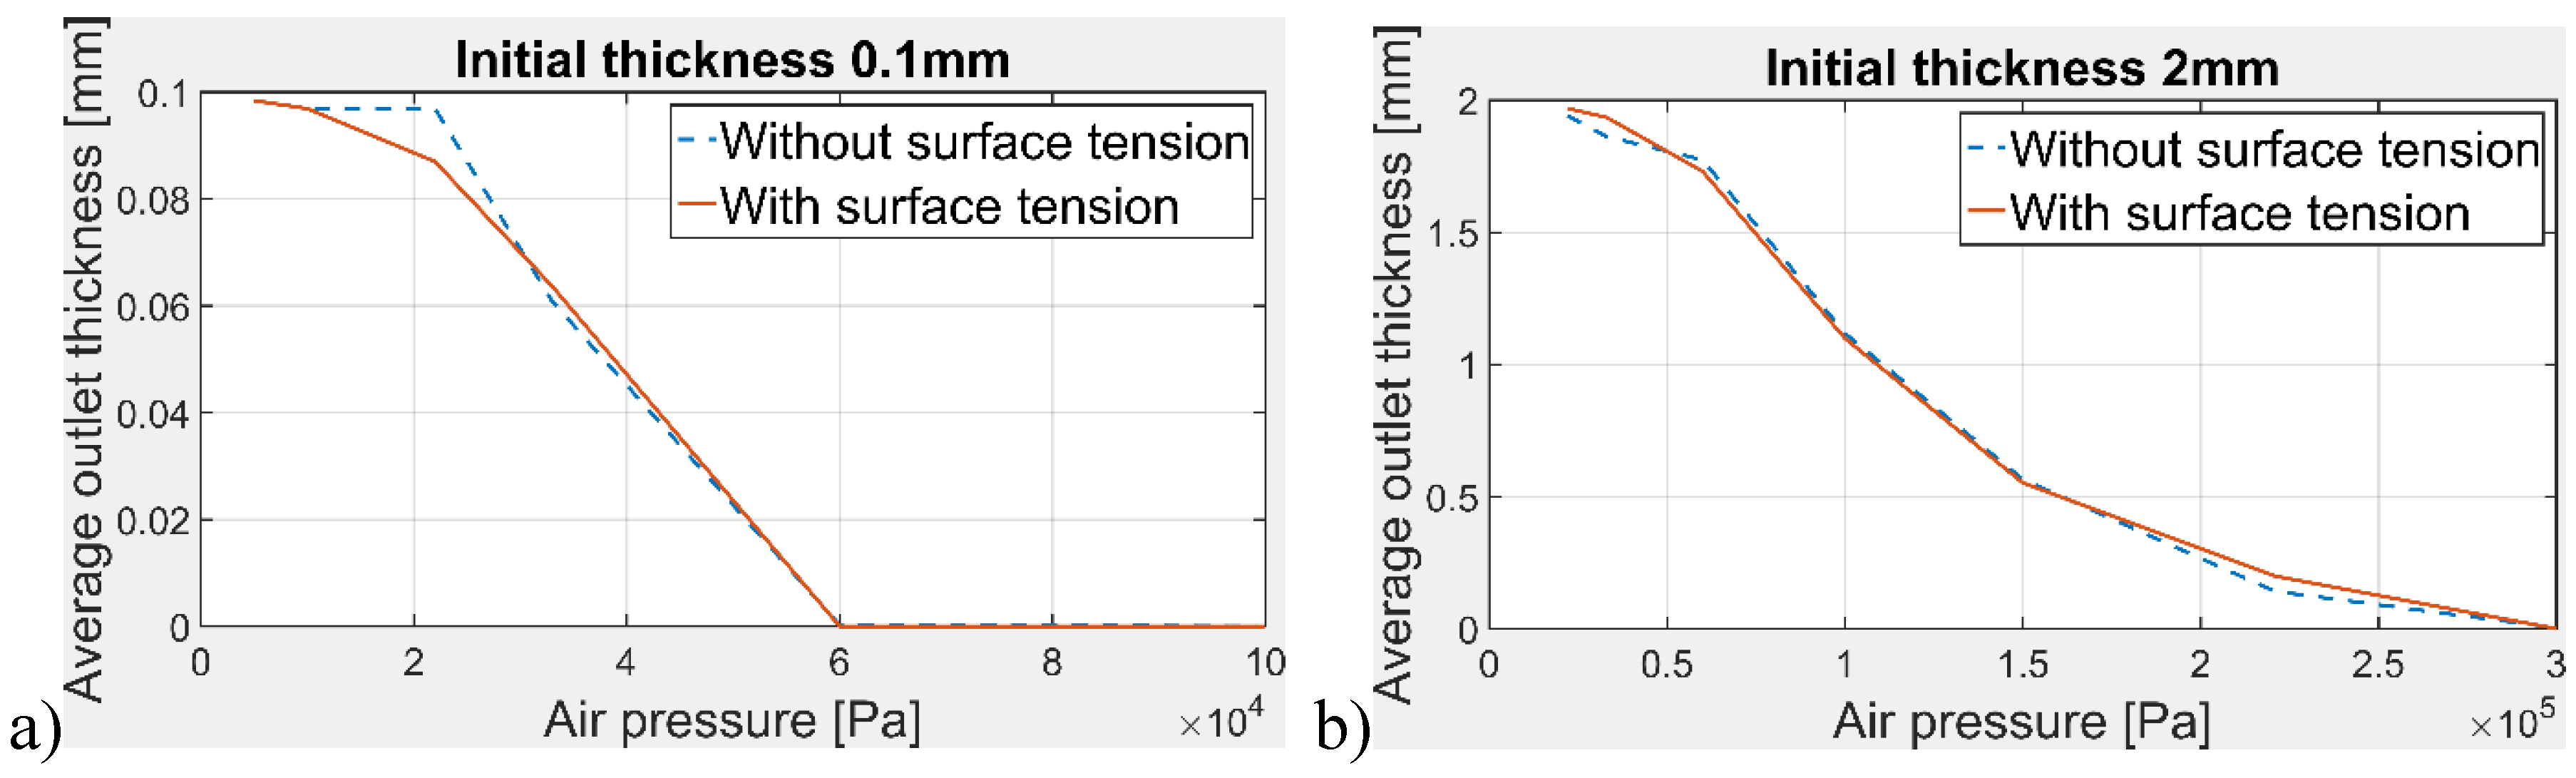
3.1. Average Thickness of Water at the Outlet
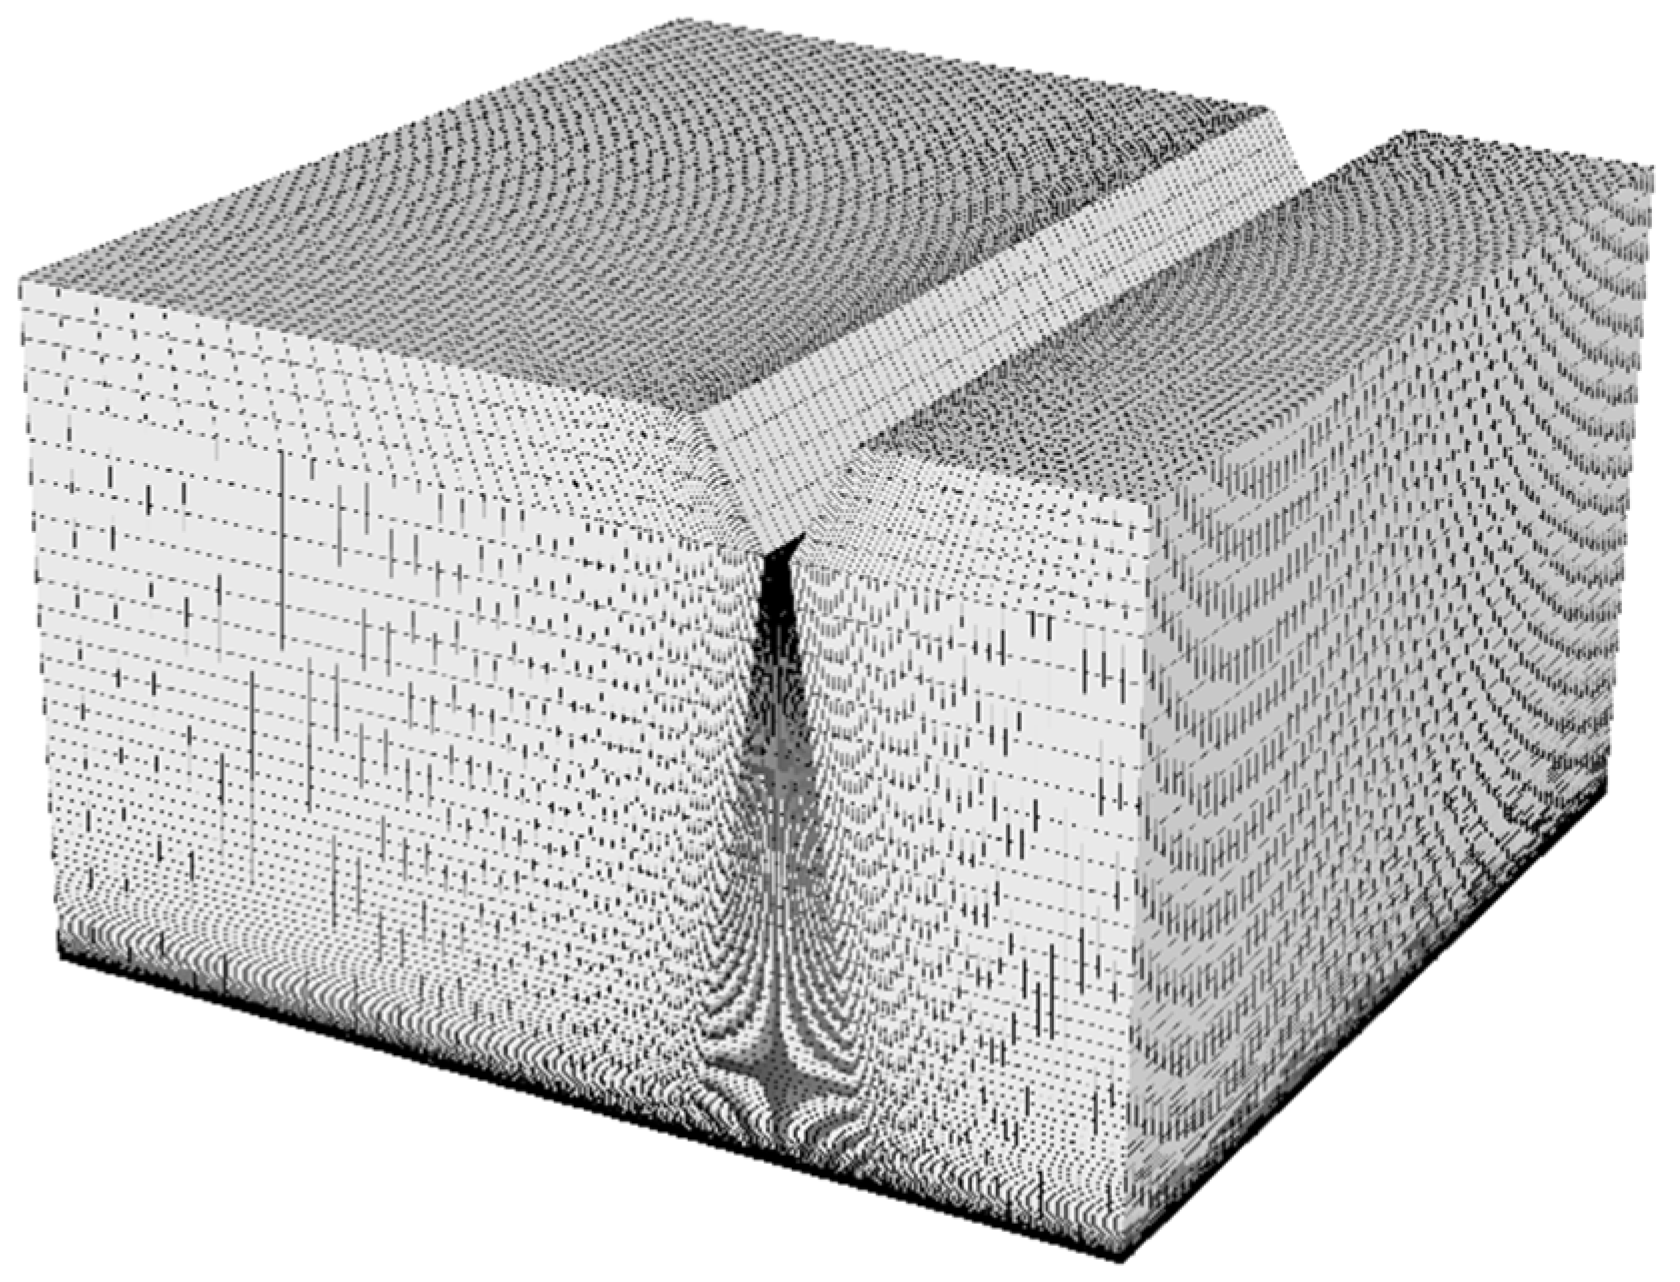
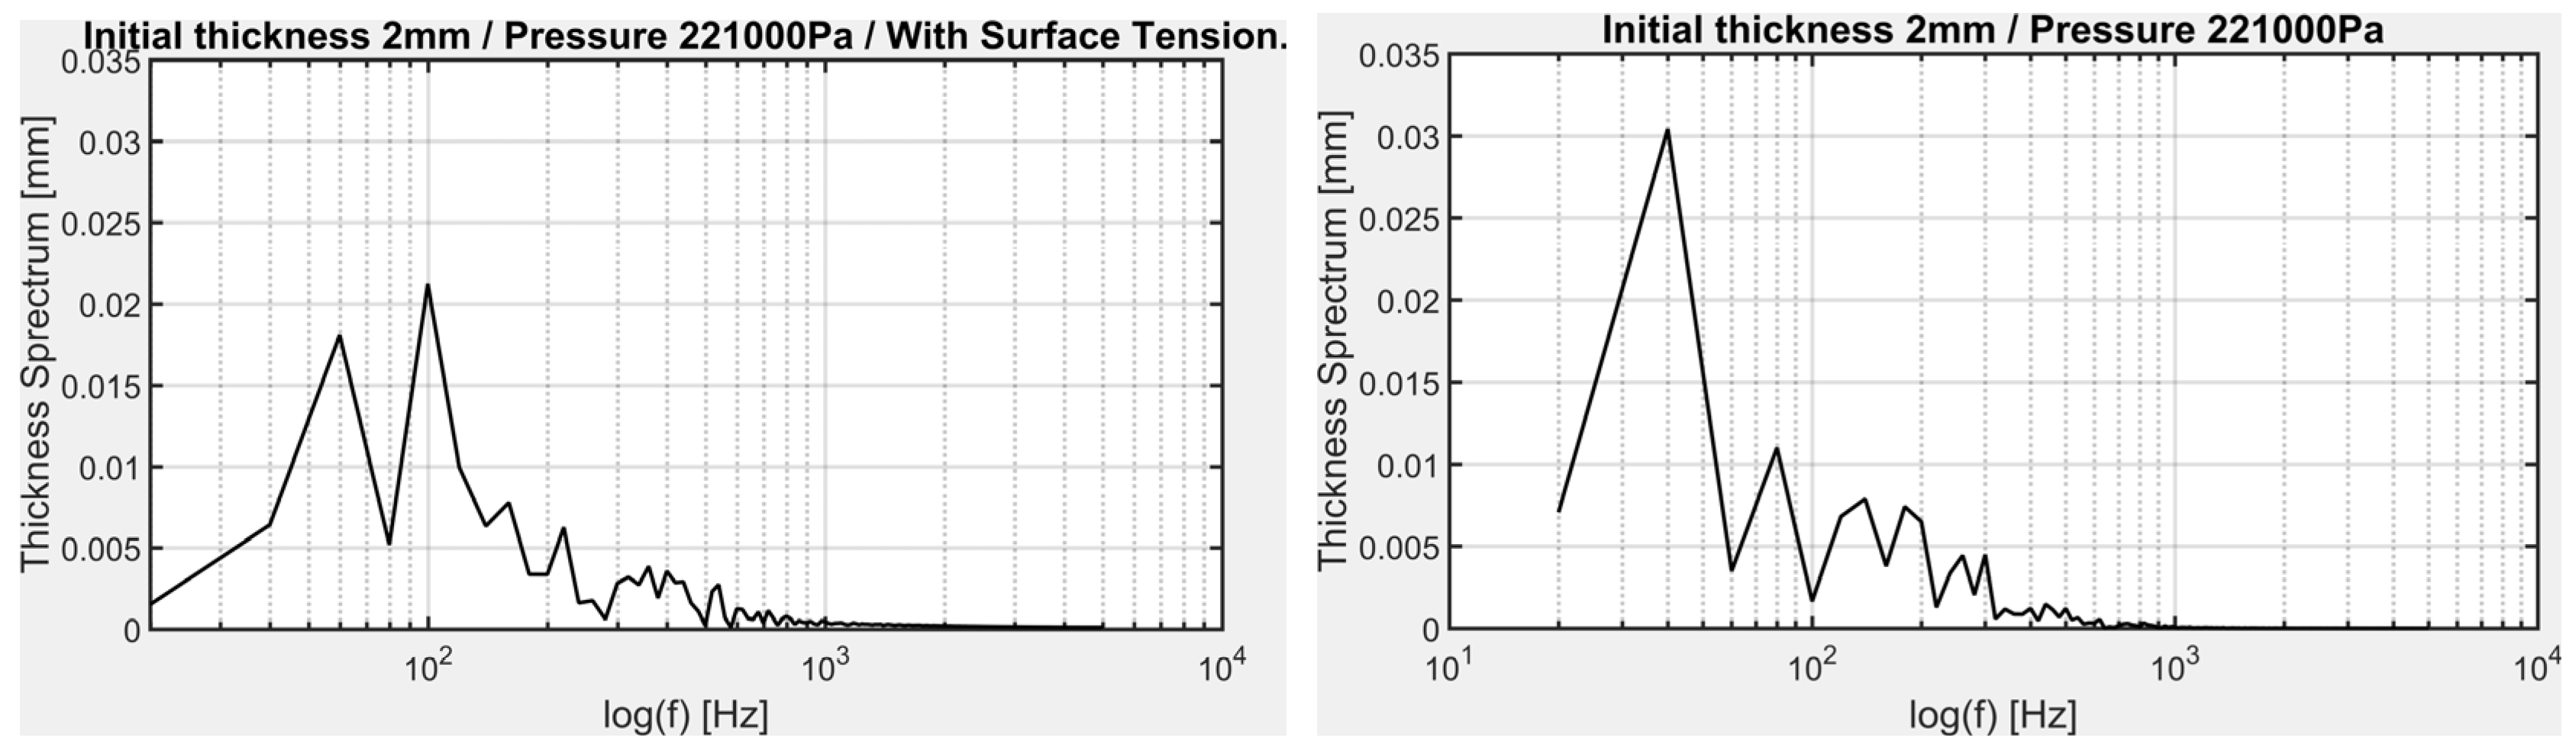
3.2. Waves Analysis
4. Conclusions
References
- Thornton, J.A.; Graff, H.F. An analytical description of the jet finishing process for hot-dip metallic coatings on strip. Metall. Trans. B 1976, 7, 607–618. [Google Scholar] [CrossRef]
- Ellen, C.H.; Tu, C.V. An Analysis of Jet Stripping of Molten Metallic Coatings. In Proceedings of the Eighth Australasian Fluid Mechanics Conference, Newcastle, New South Wales, 28 November–2 December 1983; pp. 2C.4–2C.7. [Google Scholar]
- Moriarty, J.A.; Schwartz, L.W.; Tuck, E.O. Unsteady spreading of thin liquid films with small surface tension. Phys. Fluids A 1991, 3, 733–742. [Google Scholar] [CrossRef]
- Pfeiler, C.; Mataln, M.; Kharicha, A.; Riener, C.K.; Angeli, G. Importance of the Zinc Film Modeling for Gas Jet Wiping Simulations. In Proceedings of the International Conference on Zinc and Zinc Alloy Coated Steel Sheet (Galvatech 2015), Toronto, ON, Canada, 31 May–4 June 2015; pp. 1–15. [Google Scholar]
- Elsaadawy, E.A.; Hanumanth, G.S.; Balthazaar, A.K.S.; McDermid, J.R.; Hrymak, A.N.; Forbes, J.F. Coating weight model for the continuous hot-dip galvanizing process. Metall. Mater. Trans. B 2007, 38, 413–424. [Google Scholar] [CrossRef]
- Tamadonfar, P. Numerical Investigation of Multiple-Impinging Slot Jets in the Gas-Jet Wiping of Liquid Zinc Coatings. Ph.D. Thesis, McMaster University, Hamilton, ON, Canada, 2010. [Google Scholar]


| With/Without Surface Tension | |
|---|---|
| t = 2 mm | t = 0.1 mm |
| Air Pressure [Pa] | Air Pressure [Pa] |
| 22,000 | 5000 |
| 33,000 | 10,000 |
| 60,000 | 22,000 |
| 100,000 | 33,000 |
| 150,000 | 60,000 |
| 221,000 | 100,000 |
| 300,000 | |
| 350,000 | |
Publisher’s Note: MDPI stays neutral with regard to jurisdictional claims in published maps and institutional affiliations. |
© 2018 by the authors. Licensee MDPI, Basel, Switzerland. This article is an open access article distributed under the terms and conditions of the Creative Commons Attribution (CC BY) license (https://creativecommons.org/licenses/by/4.0/).
Share and Cite
Miguel, C.; García, M.; Pereiras, B. Wiping Systems: Influence of the Surface Tension in Water Film Rupture. Proceedings 2018, 2, 1432. https://doi.org/10.3390/proceedings2231432
Miguel C, García M, Pereiras B. Wiping Systems: Influence of the Surface Tension in Water Film Rupture. Proceedings. 2018; 2(23):1432. https://doi.org/10.3390/proceedings2231432
Chicago/Turabian StyleMiguel, Celia, Manuel García, and Bruno Pereiras. 2018. "Wiping Systems: Influence of the Surface Tension in Water Film Rupture" Proceedings 2, no. 23: 1432. https://doi.org/10.3390/proceedings2231432
APA StyleMiguel, C., García, M., & Pereiras, B. (2018). Wiping Systems: Influence of the Surface Tension in Water Film Rupture. Proceedings, 2(23), 1432. https://doi.org/10.3390/proceedings2231432