Proceeding Paper

Land Cover Mapping Using Sentinel-1 SAR Satellite Imagery of Lagos State for 2017 †

by
Esther O. Makinde
1,* and
Oluwaseun E. Oyelade
2
1
Surveying and Geoinformatics Engineering Department, University of Lagos, Nigeria/KITE Group,Environment Department, University of York, York YO10 5ND, UK
2
Department of Surveying and Geoinformatics, University of Lagos, 100213 Lagos state, Nigeria
*
Author to whom correspondence should be addressed.
Presented at the Economy, Sustainable Development and Energy International Conference (ESDEIC), Edinburgh, Scotland, UK, 25–27 June 2018.
Proceedings 2018, 2(22), 1399; https://doi.org/10.3390/proceedings2221399
Published: 29 October 2018

Abstract

:
For several years, Landsat imageries have been used for land cover mapping analysis. However, cloud cover constitutes a major obstacle to land cover classification in coastal tropical regions including Lagos state. In this work, a land cover map for Lagos state is created using Sentinel-1 Synthetic Aperture Radar (SAR) imagery. To this aim, a sentinel-1 SAR dual-pol (VV+VH) Interferometric Wide swath mode (IW) data orbit for 2017 over Lagos state, Nigeria was acquired and used. Results include an RGB composite of the image, classified image, with overall accuracy calculated as 0.757, while the kappa value for this project was evaluated to be about 0.719. The classification therefore passed the accuracy assessment. It is concluded that the Sentinel 1 SAR results has been effectively exploited for producing acceptably accurate land cover map of Lagos state, with relevant advantages for areas with cloud cover.

1. Introduction

Cloud cover constitutes a major obstacle to land cover classification in the humid tropical regions when using optical remote sensing such as Landsat imagery. The advent of freely available Sentinel-1 C band synthetic aperture radar (SAR) imagery offers new opportunities for land cover classification in frequently cloud covered environments [1]. SAR data has been investigated in several studies and proven that it is effective for land cover monitoring [2,3,4]. Landsat images are widely known and used massively for land cover mapping. However, Landsat comes with a lot of challenges when used over Lagos state for example, cloud cover. There is no known study for the use of sentinel-1 SAR image in Nigeria especially in Lagos. Thus, this work assesses the use of Sentinel-1 imagery to analyse land cover in Lagos, Nigeria. The focus of this study is to acquire a Sentinel-1 SAR satellite imagery of Lagos State, Nigeria for 2017; perform supervised pixel based classification of the image and carry out accuracy assessment on the classification.

2. Material and Methods
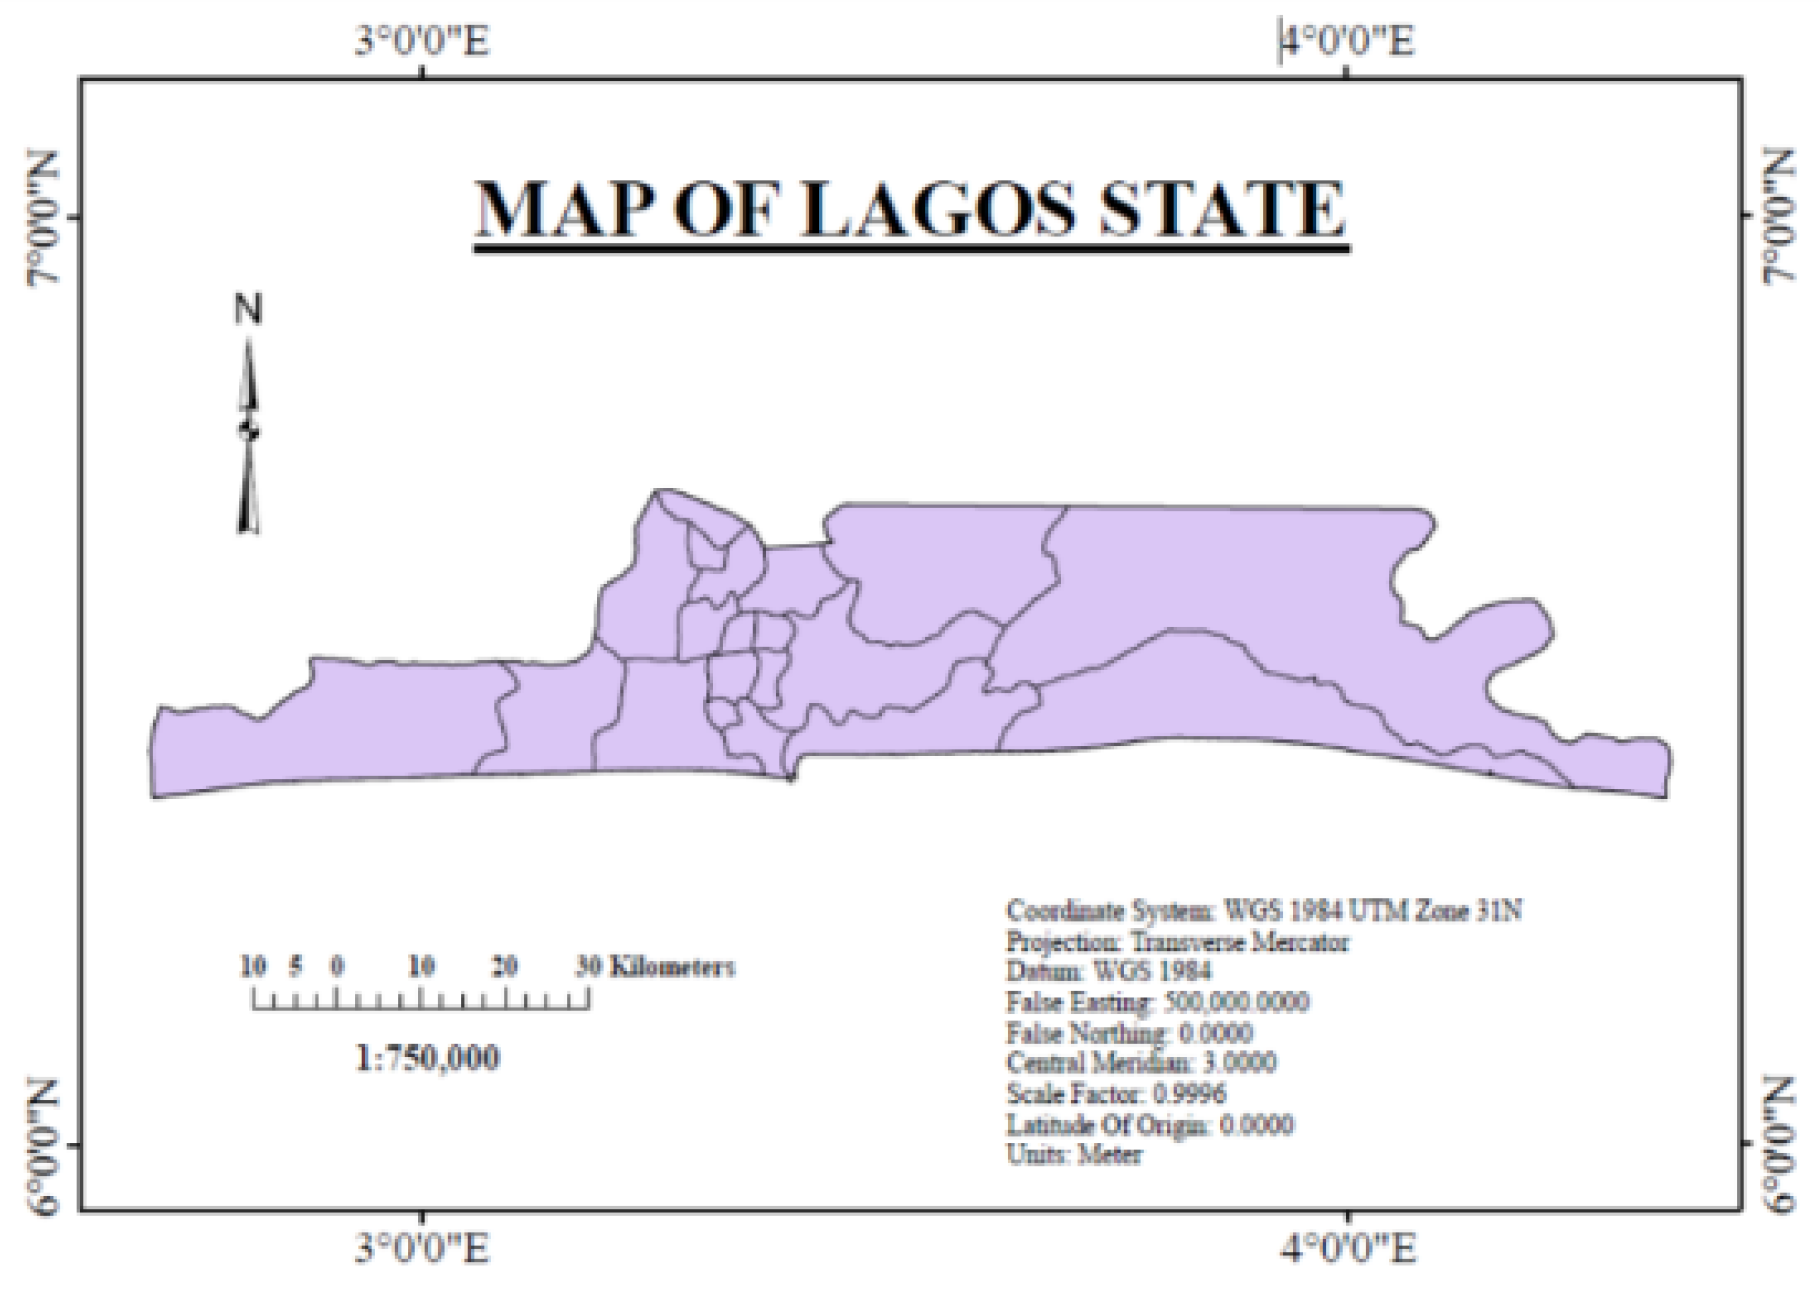
2.1. Study Area

Lagos State is the economic capital of Nigeria with its capital being Ikeja. It is ranked 2nd with a population of 9,019,534 spread across 3577 square kilometres, 22% or 787 sq. km of which consists of lagoons and creeks. Lagos State (Figure 1) lies to the south-western part of the Federation. It shares boundaries with Ogun State both in the North and East and is bounded on the west by the Republic of Benin. In the South it stretches for 180 km along the coast of the Atlantic Ocean. The smallest State in the Federation, it occupies an area of 3577 sq. km [5].

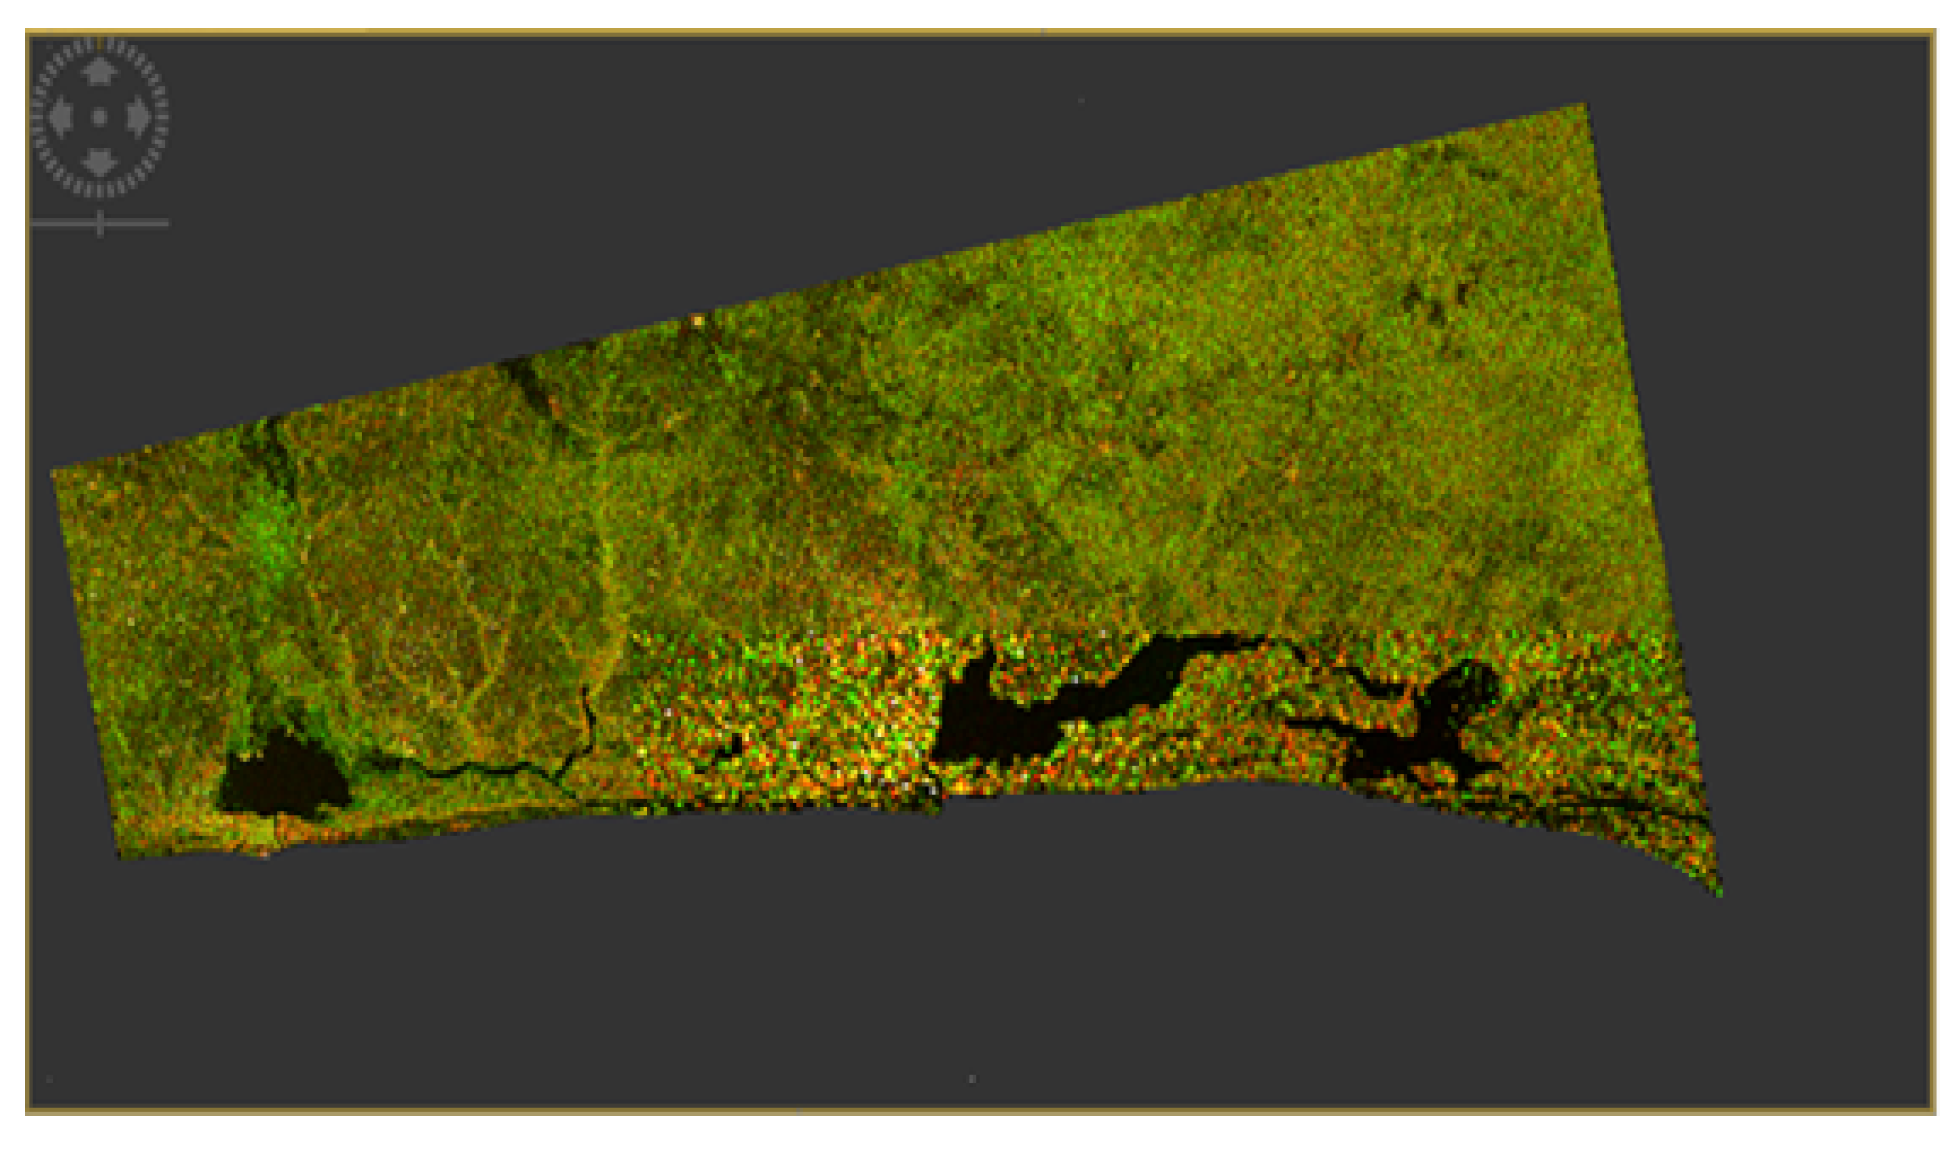
2.2. Field Data and Processing

A sentinel-1 SAR dual-pol (VV+VH) Interferometric Wide swath mode (IW) data orbit for 2017 over Lagos state, Nigeria was acquired and used. The Sentinel-1 imagery was calibrated and terrain corrected using a 25 m resolution SRTM DEM. Pre-processing was performed using the Sentinel-1 toolbox (S1TBX) in the Sentinel Application Platform provided by ESA. The Sentinel L1 product was provided with dedicated Calibration Annotation Data Set (CADS) providing the necessary information to convert the radar reflectivity into physical units. The CADS provided four Look Up Tables (LUTs): Aβ: to transform the radar reflectivity into beta β0 where the area normalization is aligned with the slant range; Aσ: to transform the radar reflectivity into radar cross-section σ0 where the area normalization is aligned with ground range plane; Aγ: to transform the radar reflectivity into gamma γ0 where the area normalization is aligned with a plane perpendicular to slant range; Adn: to revert for the final pixel scaling. The final products are coded in unsigned 16 bits integers (signed for SLC). The final products are generated from the same internal SLC product coded in floats. The four Level-1 calibration Look Up Tables (LUTs) produce beta ( ), sigma ( ) and gamma ( ) or to return to the Digital Number (DN). The LUTs apply a range-dependent gain including the absolute calibration constant. Being a GRD product, a constant offset was also applied [6,7].
The LUT’s is defined by:
A σ = A d n 2 · K sin α
A β = A d n 2 · K
A γ = A d n 2 · K tan α
where:
A_dn is the product final scaling from internal SLC to final SLC or GRD; α is the local incidence angle; K is the calibration constant
Radiometric calibration was performed in the Sentinel Toolbox interface. All three—sigma0, gamma0 and beta0 as output bands were selected from both VV and VH polarisations. From this process, the following bands were obtained: Sigma0_VH, Gamma0_VH, Beta0_VH, Sigma0_VV, Gamma0_VV, and Beta0_VV. Due to topographical variations of a scene and the tilt of the satellite sensor, the Range Doppler Terrain Correction Operator that implements the Range Doppler orthorectification method for geocoding SAR images from single 2D raster radar geometry was used [8]. As a reference DEM, the SRTM 3 arc-second GeoTiff was used with a pixel spacing of 10 metres.The band math editor was used to formulate new mathematical bands in order to have more combination options creating RGB composites. RGB composites were then created using the artificial bands as a third option to provide a training area used to distinguish each class. The most suitable composite was selected based on the ability to discriminate between chosen classes. This composite was the Dual Pol Multiple Sigma0 profile (Figure 2).

2.3. Image Classification amd Accuracy Assessment

Regions of Interest (ROIs) was populated for each class by creating new geometries using the various drawing tools provided by the Sentinel Toolbox through the Interactions Toolbar. These Regions of Interest (ROIs) were then used as training samples (vectors) when classifying the image. The selected classes include water bodies, bare land, vegetation and urban areas. The classification method used was Maximum Likelihood Classification Algorithm which was subsequnetly subjected to accuracy assessment. To determine the accuracy of each classification and class, thematic accuracy assessment was performed using the ArcGISn 10.5 software. For this purpose, a reference data set including a total of 206 points was created. These points were selected over different locations representing different land cover/use classes. The sampling procedure used for this assessment was the Random Sampling Method. An average of 50 samples per class were selected in accordance with a rule of thumb recommended by Congalton that stats at least 50 samples should be taken per class [9]. Ground Control Points were taken as placemarks using the google earth software and then saved as a KML file.

3. Result and Discussion

The result of the classification (Figure 3) is a land cover map of Lagos State showing water bodies, bare land, urban areas and vegetation with bare land and urban areas having the largest land areas and then waterbodies and vegetation respectively. During processing, it was observed that the combination of VV and VH polarisations was necessary for needed classes to be distinguishable. This can be seen when comparing RGB Composites with the colour manipulation results where only one or two classes were distinguishable. These findings agree with the work of [8] in Land Cover Mapping Using Sentinel-1 SAR data where the water class is extracted clearly when using even only one variable as VH image but failed for the extraction of urban class. The most suitable composite is seen to be the Dual Pol Difference Sigma VV+VH which consists of Sigma0_VV, Sigma0_VH and Sigma0_ (VV–VH).
Comparing the result with google earth images show that urban areas were understated and areas with low building density were sometimes misclassified as vegetation or bare land which agrees with [10] stating that ‘The mask based on average SAR backscatter does not classify areas with lower building density as urban areas and these are then often falsely classified as forests’. Misclassification was also observed in the waterbodies where a lot of pixels were classified as bare land. This could be due to the penetrating power of radar. Water bodies were also found in areas known to be bare land. It could be suggested to be due to high reflective power of water on radar, although this contradicts [11] where waterbodies are said to have low backscattering. The results of the accuracy assessment also support this observation as water bodies has the highest commission with 23 out of the 65 pixels assigned to it belonging to another class. Bare Land has the highest number of pixels not classified.
With an Overall Accuracy and Kappa Value of 0.757 and 0.719 respectively, the classification can be considered to be acceptable. The total land area for the classification being 3550 square km is comparable to that of Lagos, 3575 square km. However, comparing the results from the accuracy assessment with other studies show that [10] who employed the use of Otsu threshold and K-means clustering had a higher overall accuracy of 92% and kappa statistics of 0.81. [8], using Support Vector Machines (SVM) classification also achieved an overall accuracy of 93.28% when using a combination of VV and VH polarizations. This could indicate better accuracy for Sentinel-1 data using those methods. It however be noted that the processing methods were different and the classification was only for forest area derivation in the case of [11] as opposed to four classes in this project. Therefore, assuming the better classification methods using the available data alone would not be very accurate until research is done using same data source, parameters and procedure for the different classification method.

4. Conclusions

In this study, a Land Cover Map for Lagos state was created using Sentinel-1 SAR imagery for 2017. The raw imagery was downloaded from Copernicus database servers in a SAFE format. The sentinel toolbox also had to be downloaded and installed for read and process the data. Using the sentinel toolbox, the image underwent radiometric calibration and terrain correction. New bands were generated using the band math window after which they were used to generate RGB Composites. The most suitable composite was seen to be the Dual Pol Difference Sigma VV+VH which consisted of Sigma0_VV, Sigma0_VH and Sigma0_(VV–VH). Regions of Interests (ROI’s) were selected from each proposed class and used to classify the image. The classification method used was the Maximum Likelihood Classifier. Accuracy assessment was done using ArcMap software where confusion matrix, omission and commission tables were created. From the assessment the classification was shown to favour waterbodies over bare land areas. An acceptable Overall Accuracy and Kappa Value of 0.757 and 0.719 respectively was gotten. The classification therefore passed and Sentinel-1 SAR data has proven to be useful and acceptably accurate for land cover mapping.

Author Contributions

E.O.M. and O.E.O. conceived and designed the experiments; E.O.M. designed this work, monitored and supervised its implementation. O.E.O. performed the experiments; E.O.M. and O.E.O. analyzed the data and wrote the manuscript.

Conflicts of Interest

There is no Conflict of Interest.

References

  1. Fonteh, L.M.; Fonkou, T.; Cornelius, L.M.; Russell, M.; Abel, R.; Moses, C. Assessing the Utility of Sentinel-1 C Band Synthetic Aperture Radar Imagery for Land Use Land Cover Classification in a Tropical Coastal Systems When Compared with Landsat 8. J. Geogr. Inf. Syst. 2016, 8, 495–505. [Google Scholar] [CrossRef]
  2. Longepe, N.; Rakwatin, P.; Isoguchi, O.; Shimada, M.; Uryu, Y.; Yulianto, K. Assessment of ALOS PALSAR 50 m Orthorectified FBD Data for Regional Land Cover Classification by Support Vector Machines. IEEE Trans. Geosci. Remote. Sens. 2011, 49, 2135–2150. [Google Scholar] [CrossRef]
  3. Niu, X.; Ban, Y. Multi-temporal RADARSAT-2 polarimetric SAR data for urban land-cover classification using an object-based support vector machine and a rule-based approach. Int. J. Remote Sens. 2013, 34, 1–26. [Google Scholar] [CrossRef]
  4. Balzter, H.; Cole, B.; Thiel, C.; Schmullius, C. Mapping CORINE Land Cover from Sentinel-1A SAR and SRTM Digital Elevation Model Data using Random Forests. Remote Sens. 2015, 7, 14876–14898. [Google Scholar] [CrossRef]
  5. Lagos State (2017). Available online: https://en.wikipedia.org/wiki/Lagos_State (accessed on March 2017).
  6. Attema, E.; Cafforio, C.; Gottwald, M.; Guccione, P.; Guarnieri, A.M.; Rocca, F.; Snoeij, P. Flexible dynamic block adaptive quantization for Sentinel-1 SAR missions. IEEE Geosci. Remote Sens. Lett. 2010, 7, 766–770. [Google Scholar] [CrossRef]
  7. de Zan, F.; Guarnieri, A.M. Topsar: Terrain Observation by Progressive Scans. IEEE Trans. Geosci. Remote Sens. 2006, 44, 2352–2360. [Google Scholar] [CrossRef]
  8. Abdikan, S.; Sanli, F.B.; Ustuner, M.; Calò, F. Land Cover Mapping using Sentinel-1 SAR Data. Int. Arch. Photogramm. Remote Sens. Spat. Inf. Sci. 2016, XLI-B7, 757–762. [Google Scholar] [CrossRef]
  9. Congalton, R.G. A Review of Assessing the Accuracy of Classifications of Remotely Sensed Data. Remote. Sens. Environ. 1991, 37, 35–46. [Google Scholar] [CrossRef]
  10. Dostálová, A.; Hollaus, M.; Milenković, M.; Wagner, W. Forest Area Derivation from Sentinel-1 Data. ISPRS Ann. Photogramm. Remote Sens. Spat. Inf. Sci. 2016, III-7, 227–233. [Google Scholar] [CrossRef]
  11. Banqué, X.; Lopez-Sanchez, J.M.; Monells, D.; Ballester, D.; Duro, J.; Koudogbo, F. Polarimetry-Based Land Cover Classification with Sentinel-1 Data. In Proceedings of the POLinSAR 2015: The 7th International Workshop on Science and Applications of SAR Polarimetric Interferometry, Frascanti, Italy, 26–30 January 2015. [Google Scholar]
Figure 1. Map of Lagos State.
Proceedings 02 01399 g001
Figure 2. RGB composites for Dual Pol. Multiple.
Proceedings 02 01399 g002
Figure 3. Classified Image.
Proceedings 02 01399 g003
Publisher’s Note: MDPI stays neutral with regard to jurisdictional claims in published maps and institutional affiliations.

