Modelling Two Dimensional Affected Regions by “Seca” Disease with Proximity Diagrams †


Abstract
:1. Introduction
2. Materials and Methods
3. Results and Discussion
Author Contributions
Acknowledgments
Conflicts of Interest
References
- Brasier, C.M. Oak tree mortality in Iberia. Nature 1992, 360, 539. [Google Scholar] [CrossRef]
- Tuser, J.J.; Sánchez, G. La Seca: El Decaimiento de Encinas, Alcornoques y Otros Quercus en España; Ediciones Mundi Prensa: Madrid, Spain, 2004. [Google Scholar]
- Del Pozo, J.L. Prospección de la seca en Extremadura. Análisis de los resultados. En Gestión Ambiental y Económica del Ecosistema Dehesa en la Península Ibérica: 131–143. Junta de Extremadura; Consejería de Infraestructura y Desarrollo Tecnológico: Mérida, Mexico, 2006. [Google Scholar]
- Vivas, M.; Curbera, E.; Moreno, G.; Solla, A. The Decline of Quercus ilex and Q. suber in the Iberian Peninsula; Agroforestry Systems as a Technique for Sustainable Land Management; AECID Unicopia Ediciones: Madrid, Spain, 2009; pp. 225–233. ISBN 978-84-96351-59-2. [Google Scholar]
- Cubera, E.; Moreno, G.; Solla, A. Quercus ilex root growth in response to heterogeneous conditions of soil bulk density and soil NH4-N content. Soil Till. Res. 2009, 103, 16–22. [Google Scholar] [CrossRef]
- De Berg, M.; van Kreveld, M.; Overmars, M.; Schwarzkopf, O. Computational Geometry, Algorithms and Applications; Springer: Berlin/Heidelberg, Germany, 1997. [Google Scholar]
- Preparata, F.P.; Ian Shanmos, M. Computational Geometry, An Introduction; Springer: New York, NY, USA, 1985. [Google Scholar]
- Geoportal. Observación Dehesa Montado. Visualización de Información Cartográfica. IDE Extremadura. Available online: http://geoportal.observatoriodehesamontado.gobex.es (accessed on 1 May 2018).
- Wolfram Research, Inc. Mathematica, version 10.4; Wolfram Research, Inc.: Champaign, IL, USA, 2016. [Google Scholar]

| Thownship | Number of Focus | Labels |
|---|---|---|
| Santiago de Alcántara | 2 | 2, 23 |
| Membrío | 1 | 41 |
| Valencia de Alcántara | 3 | 8, 25, 35 |
| San Vicente de Alcántara | 2 | 3, 29 |
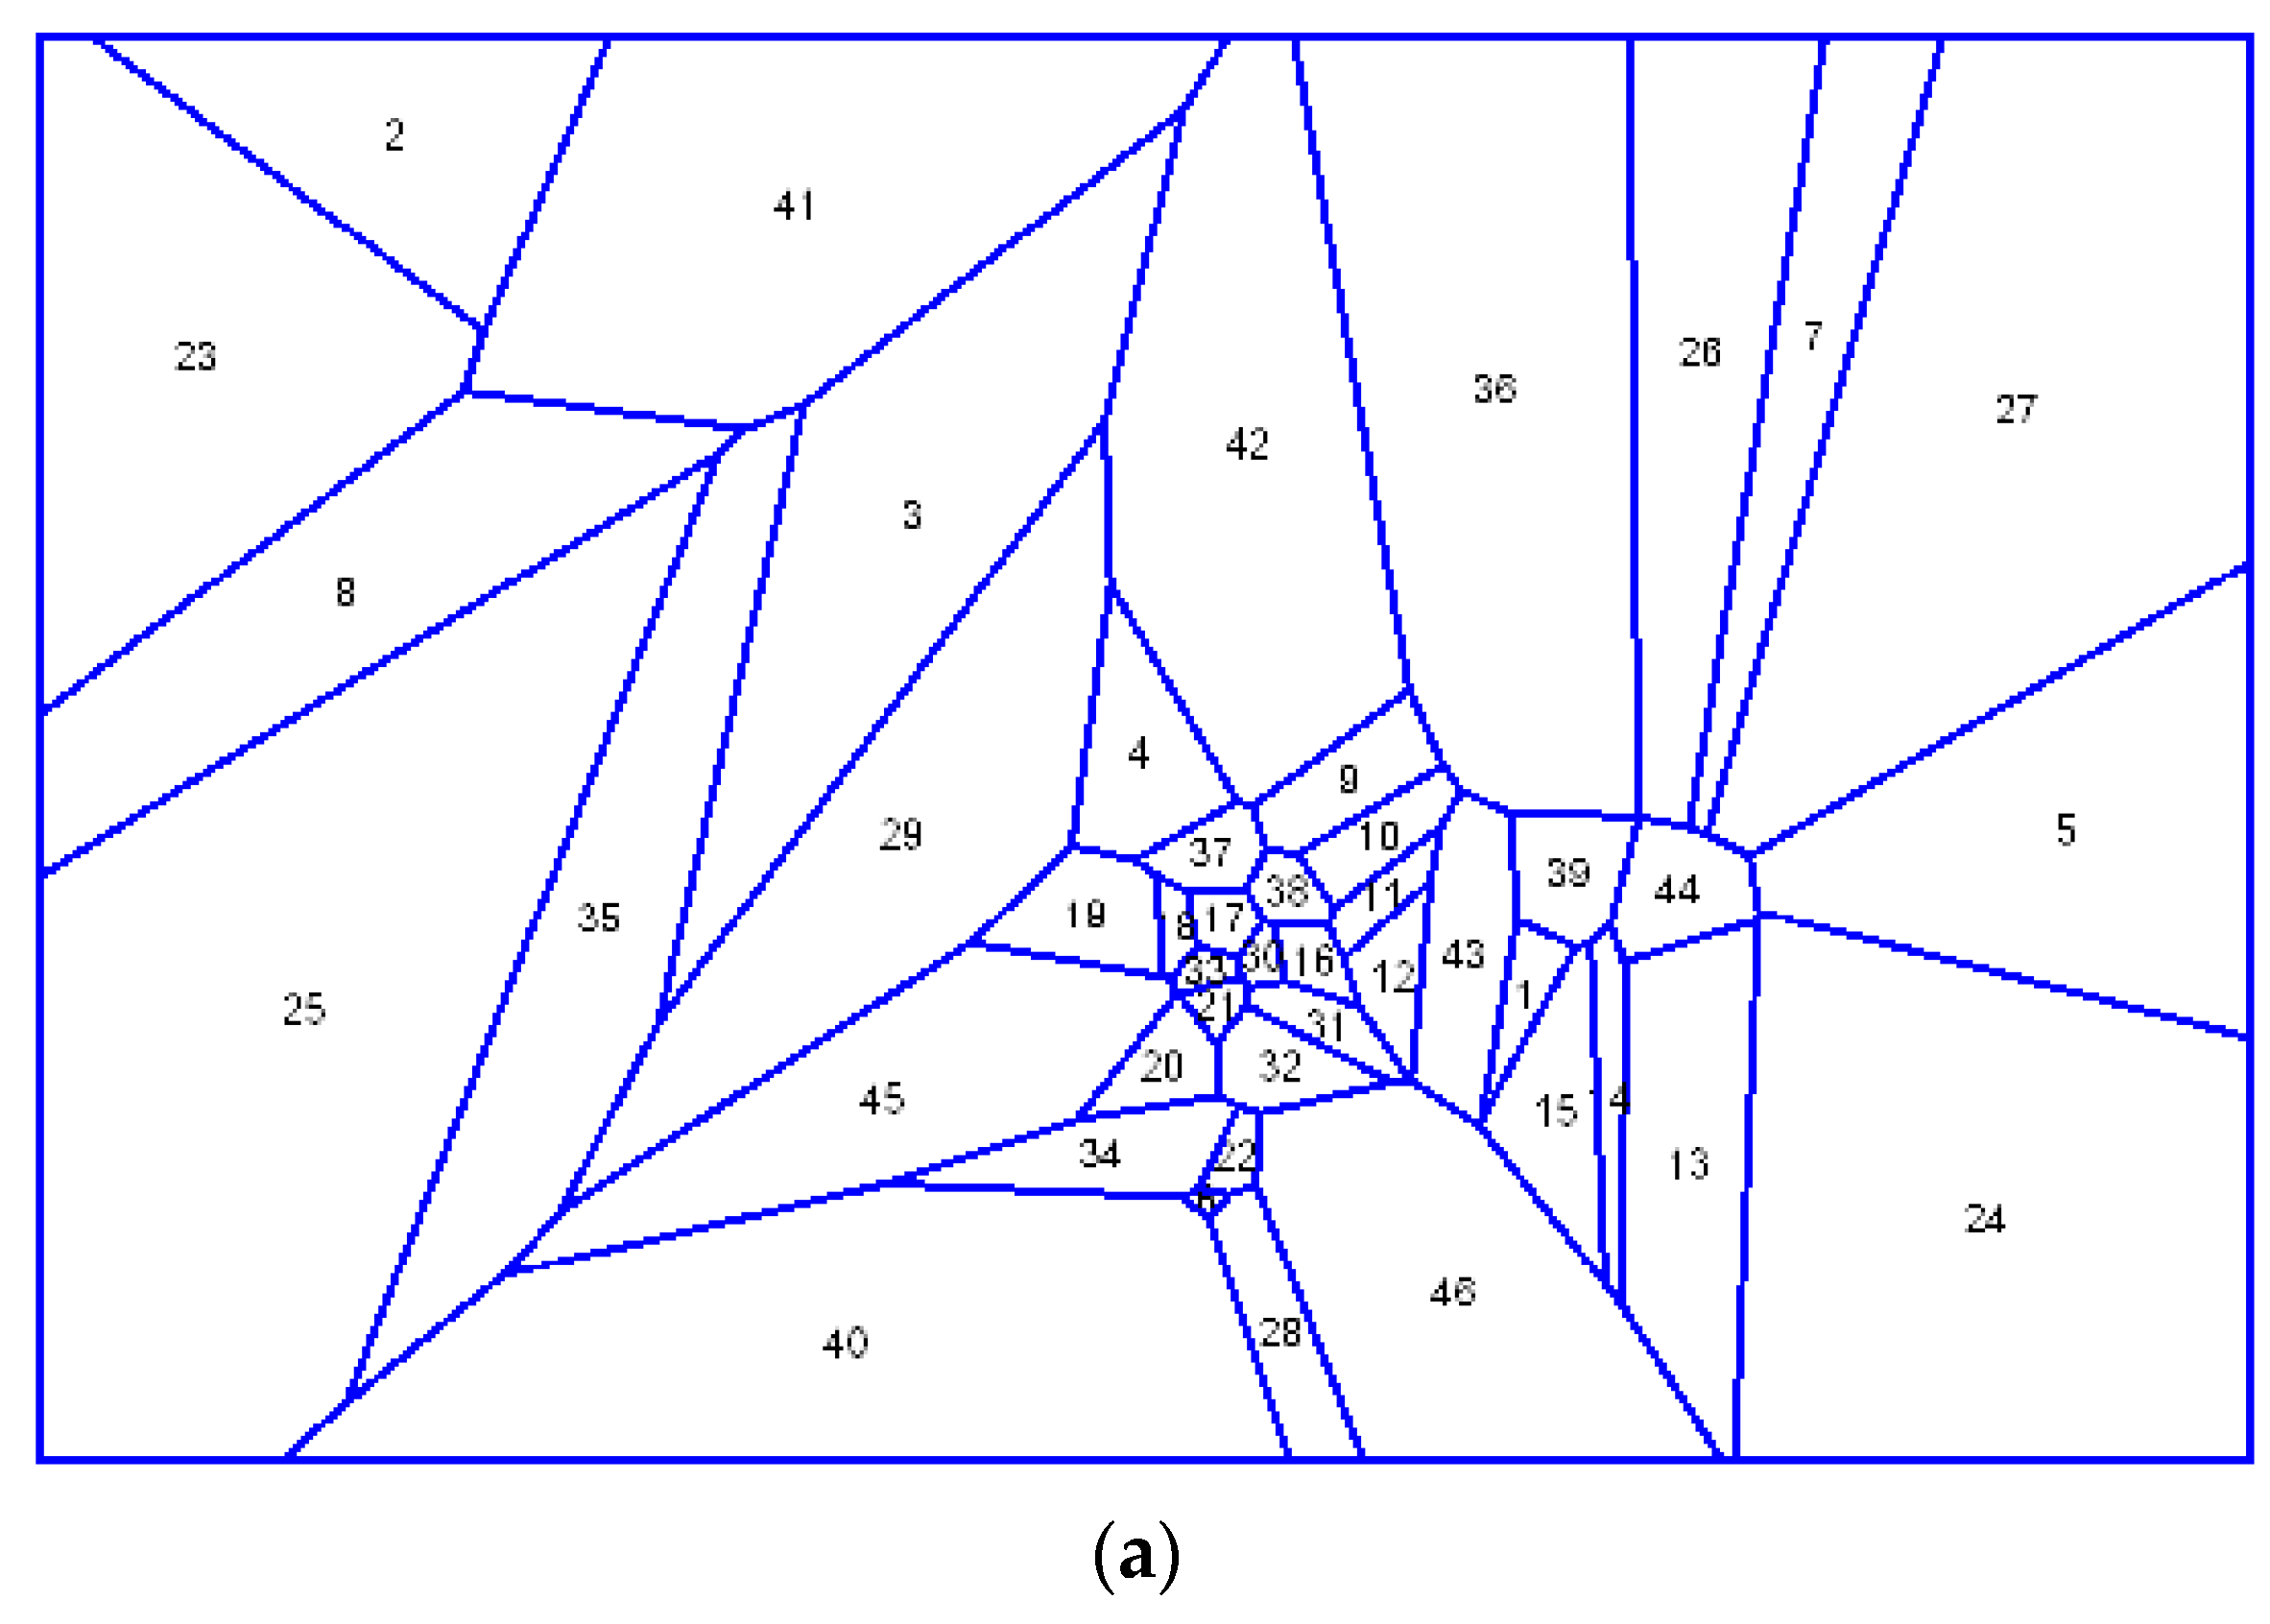
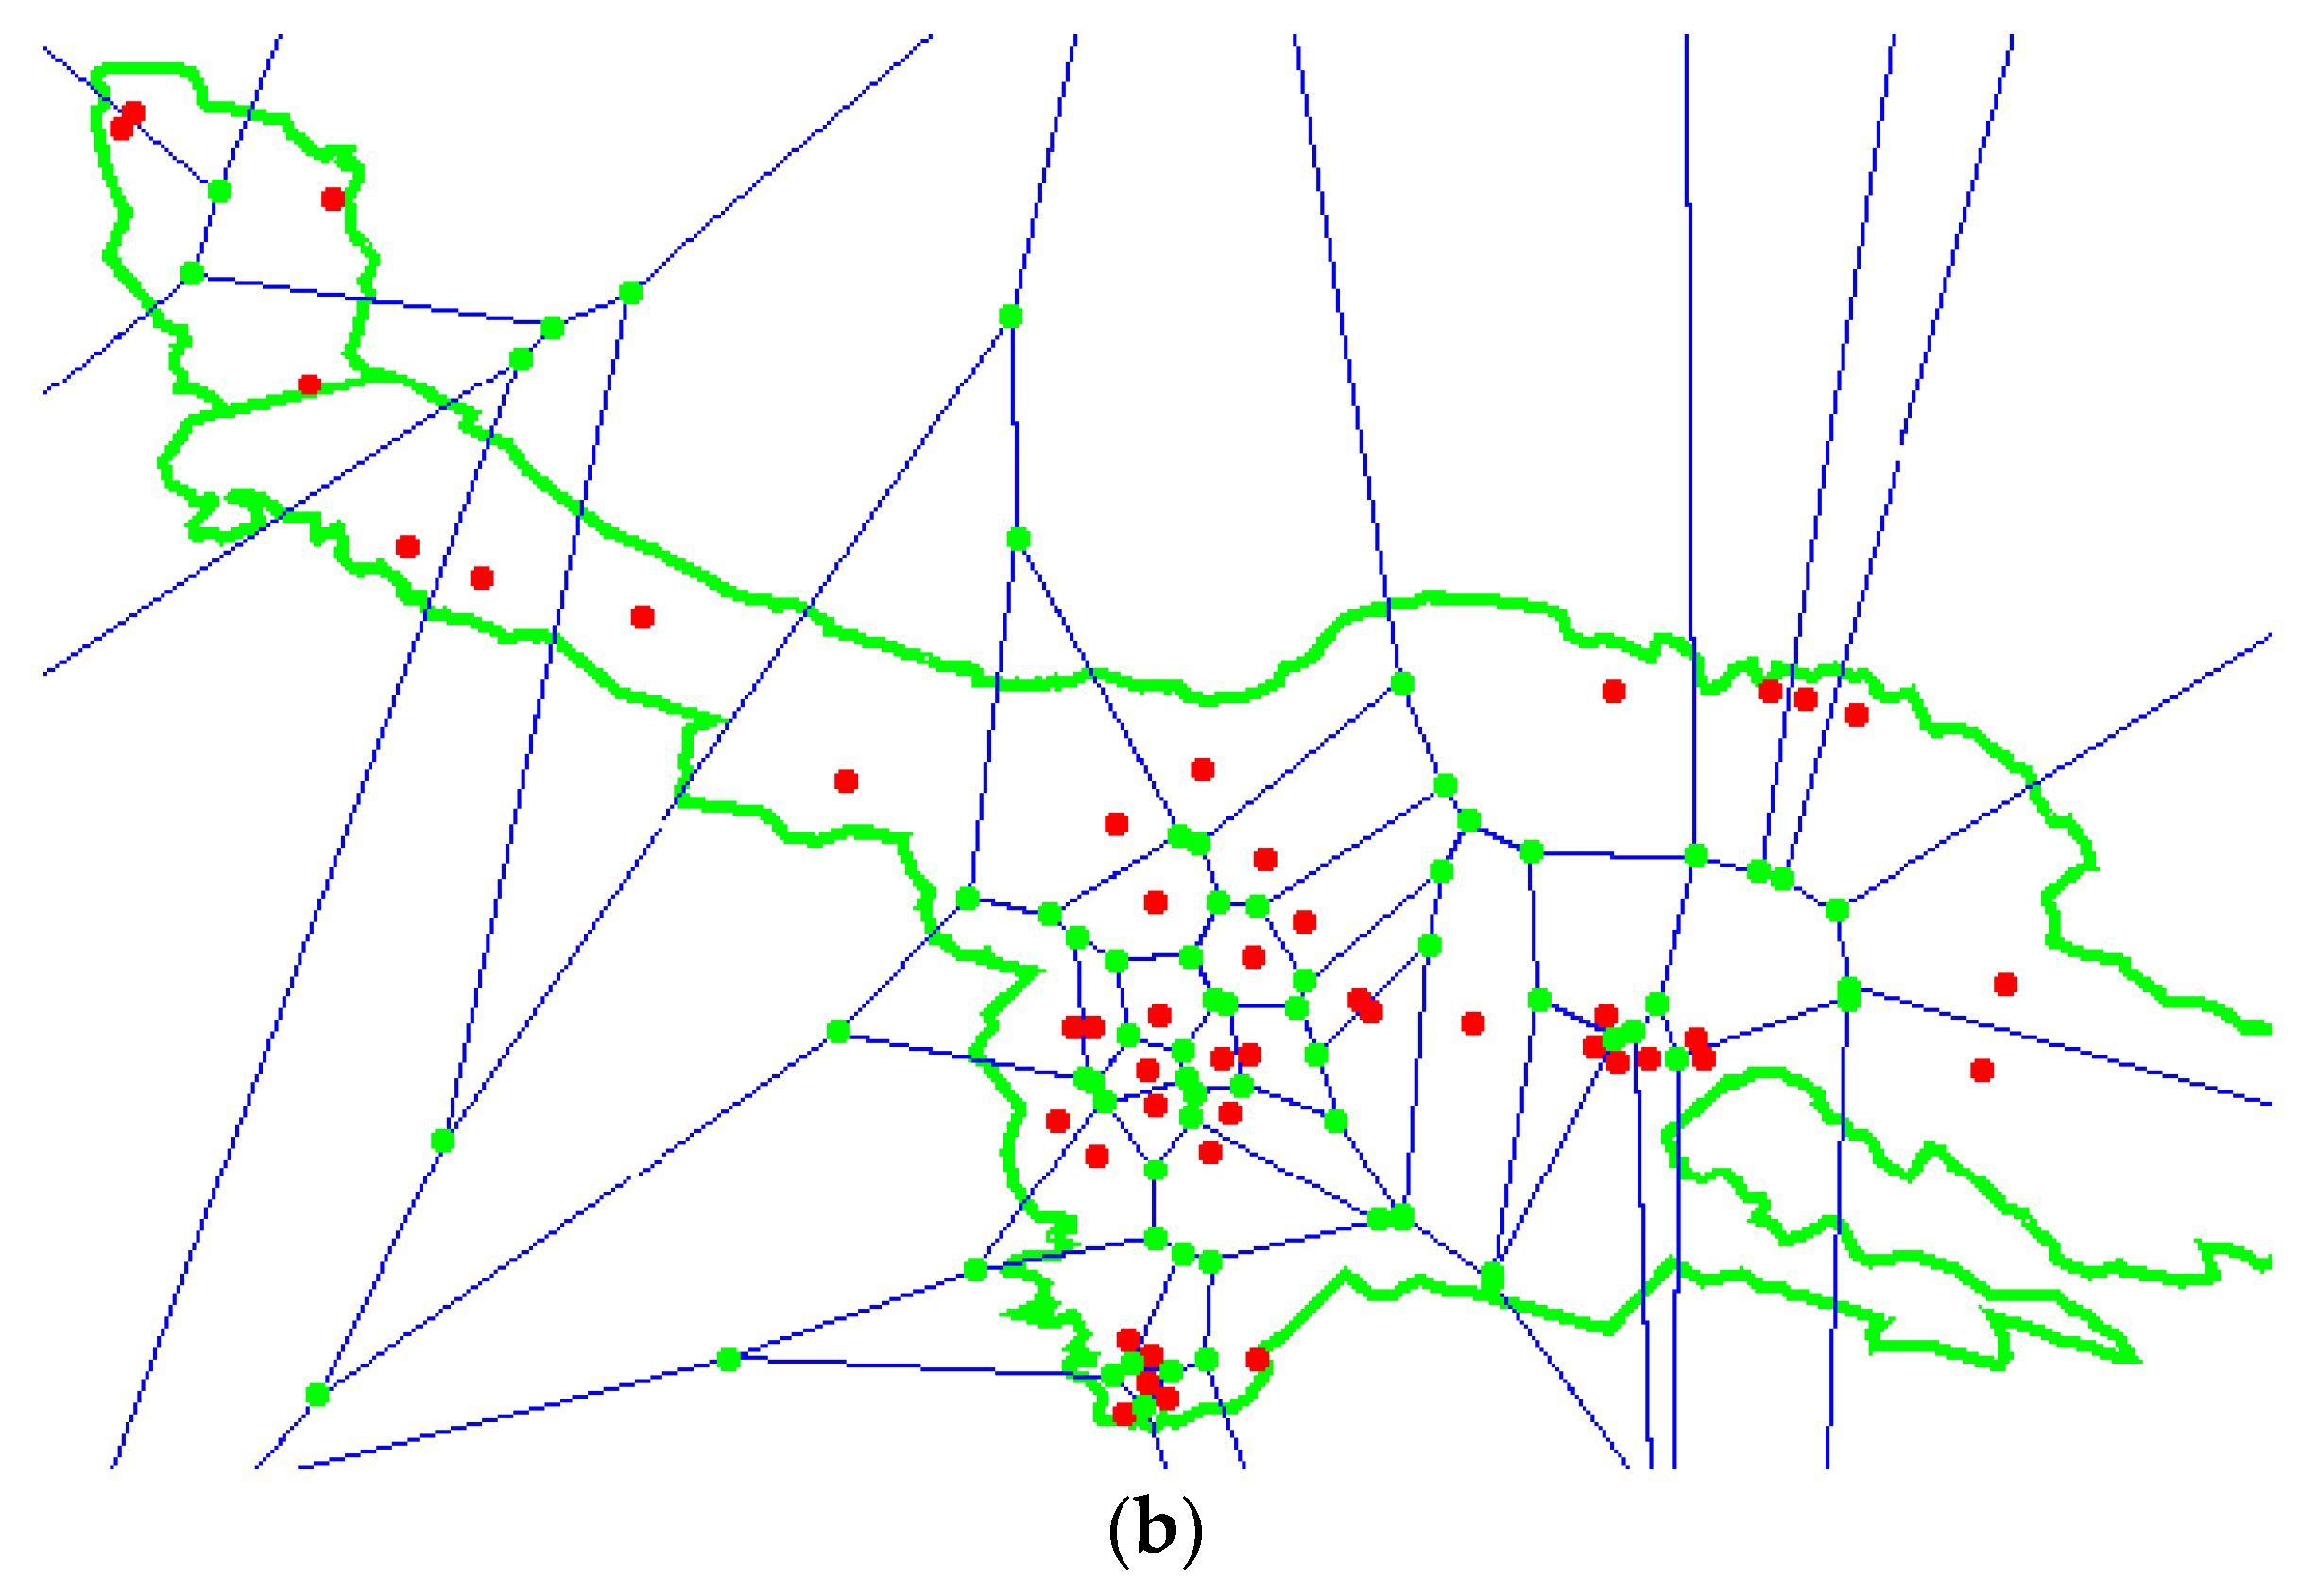
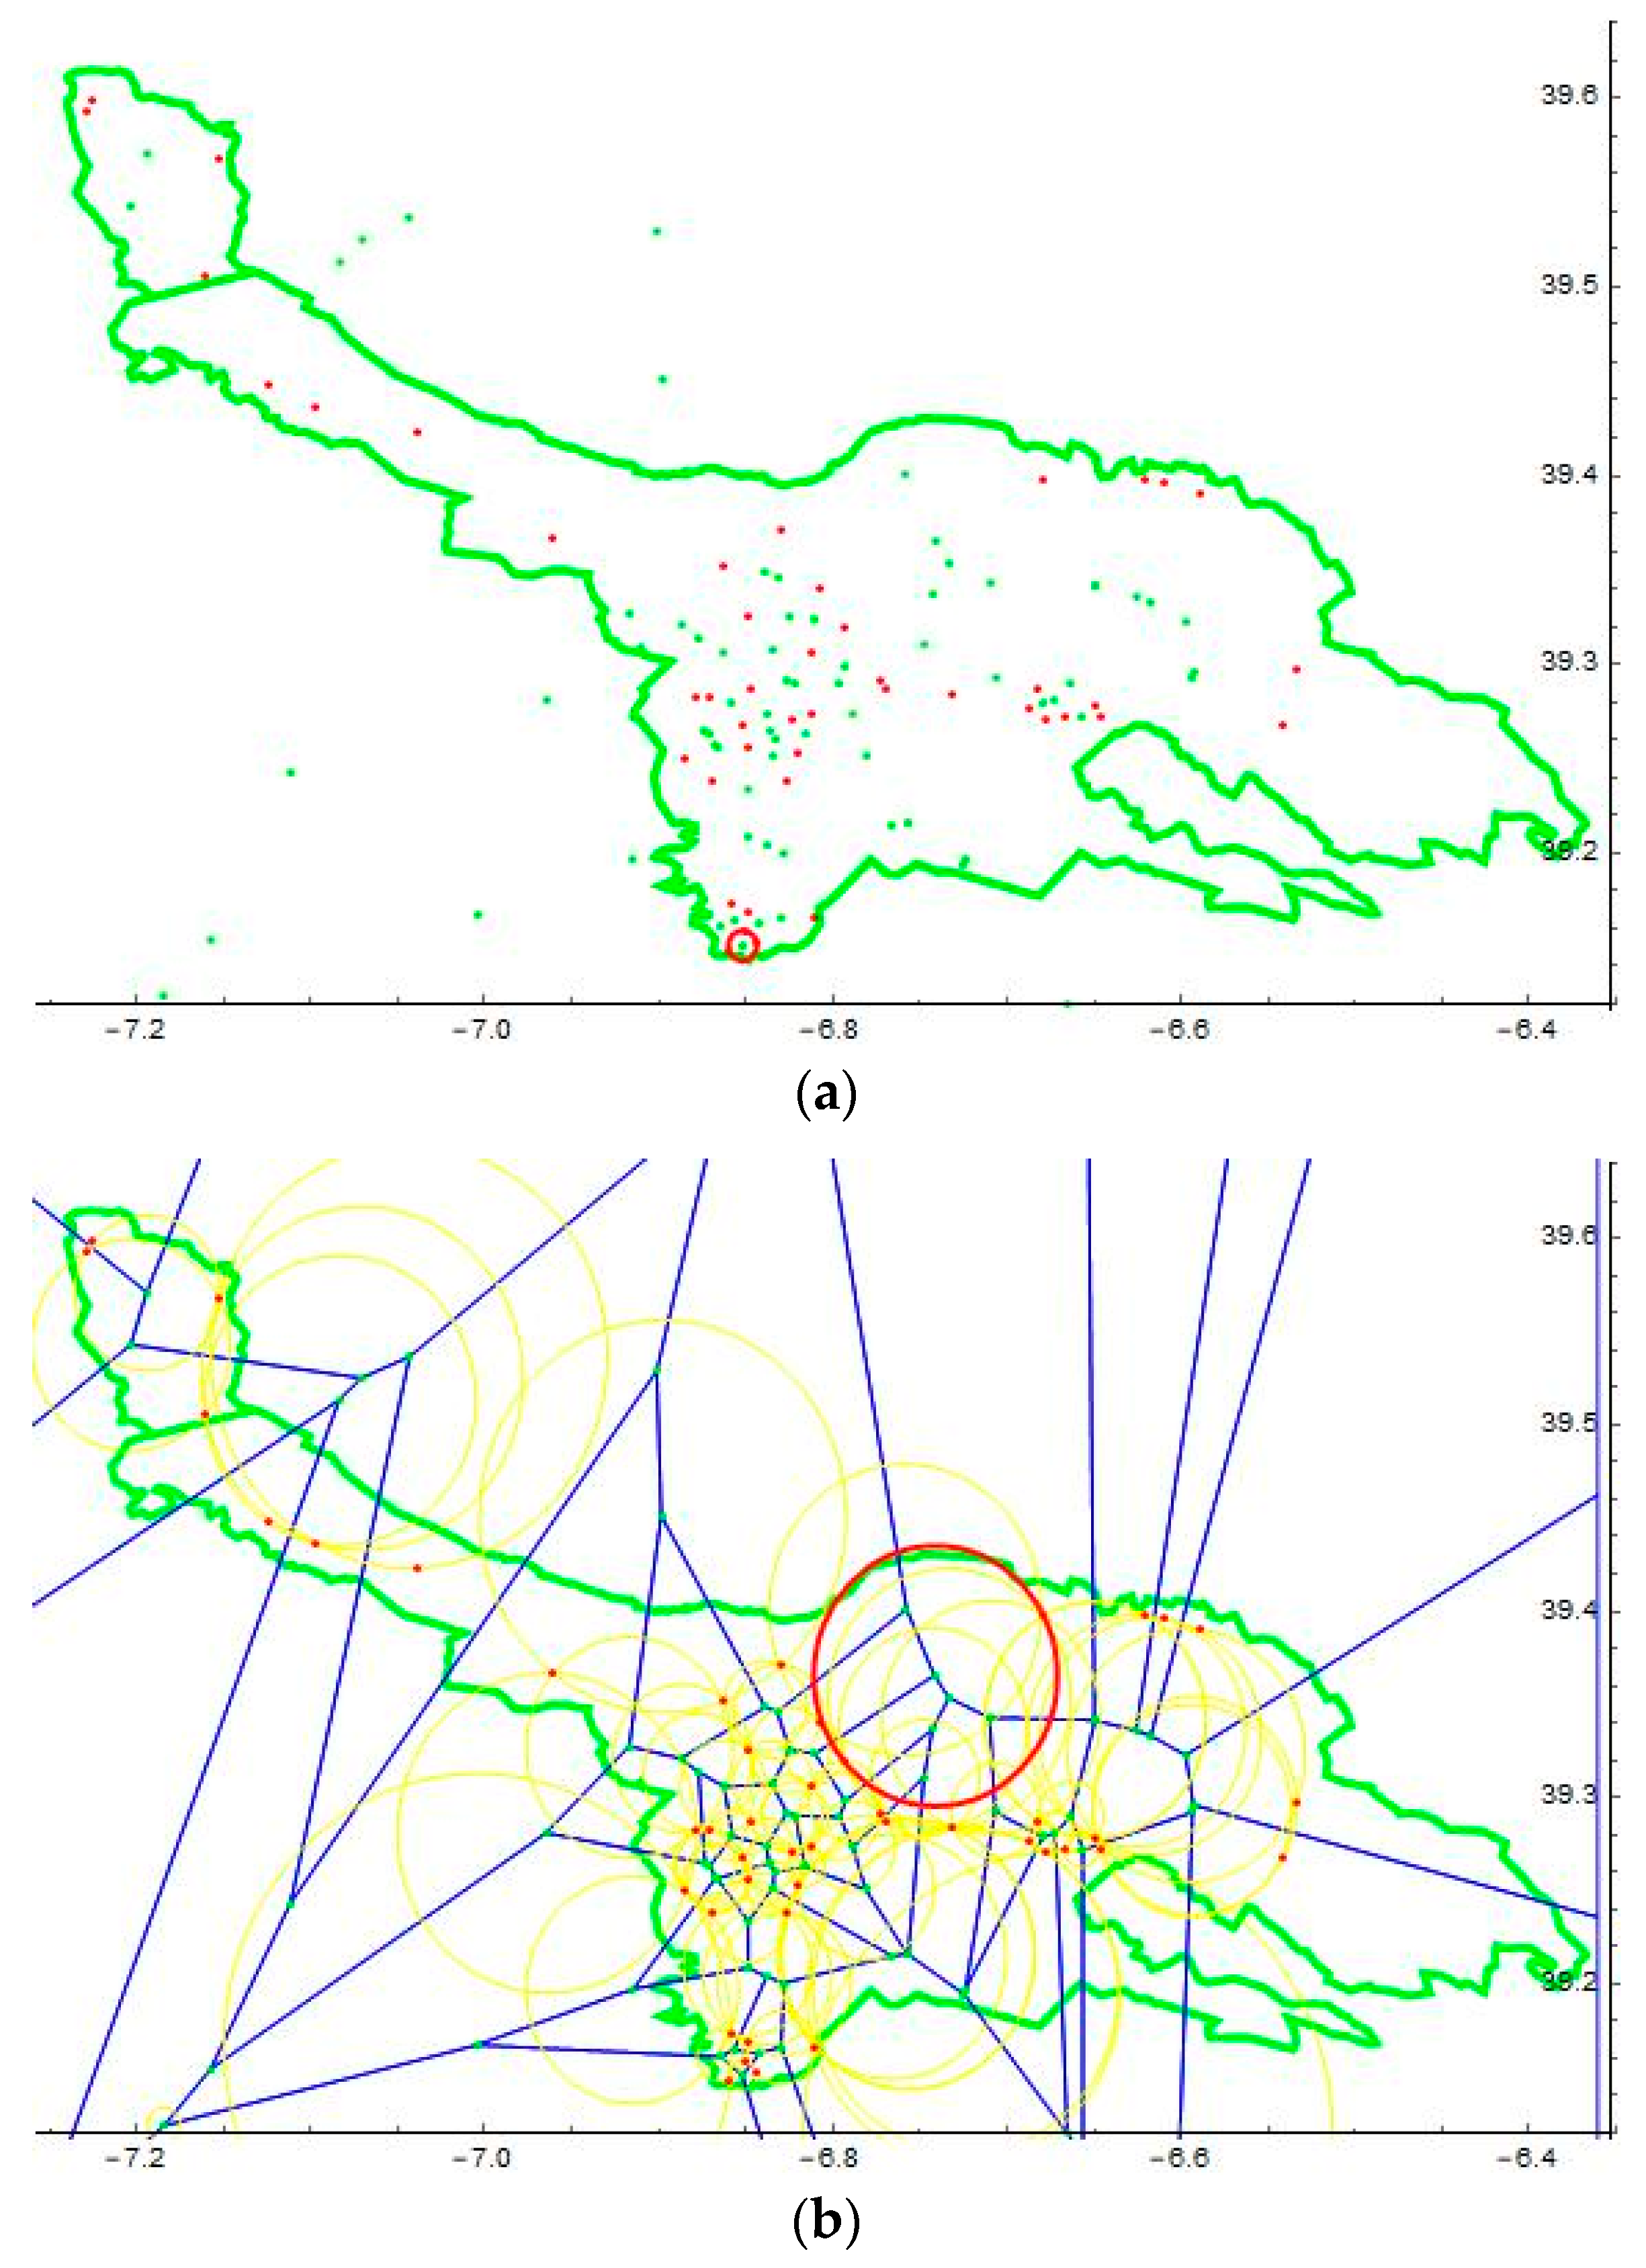
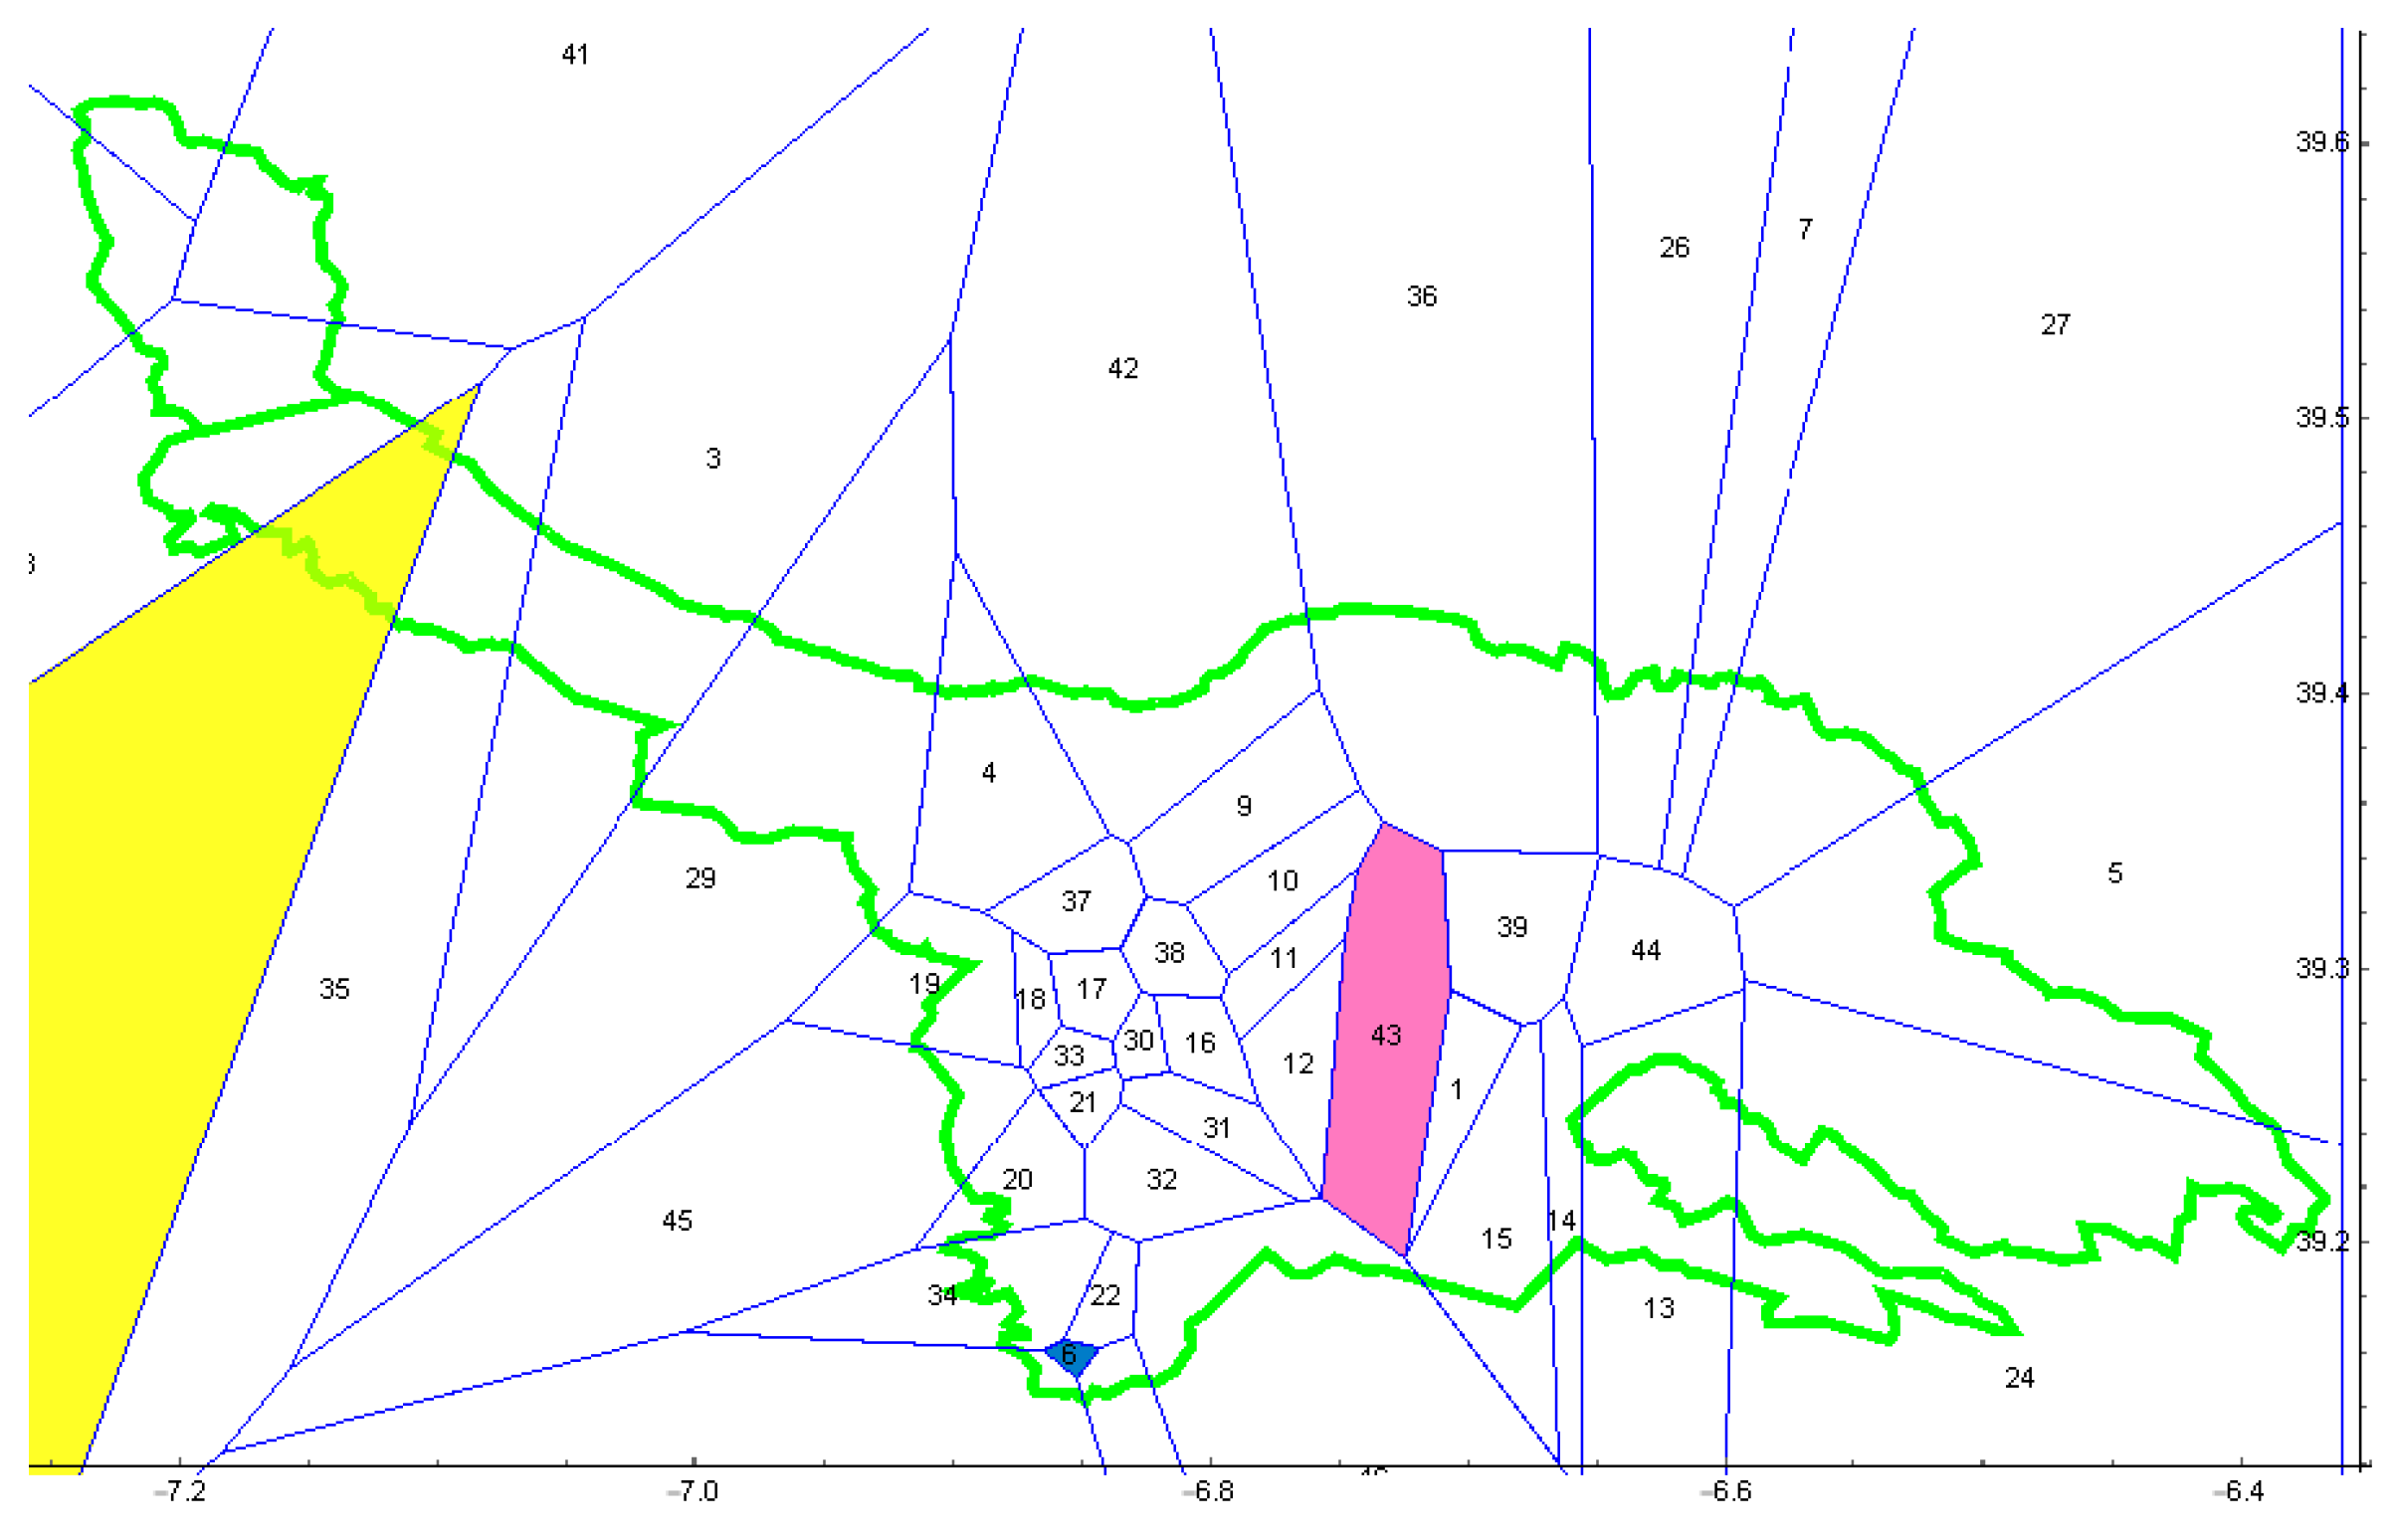
| Alburquerque | 21 | 4, 42, 37, 9, 10, 11, 12, 13, 38,19, 8, 17, 33, 30, 16, 45, 21, 31, 20, 32, 34, 22, 6, 40, 28 |
| Villar del Rey | 4 | 10, 6, 28, 46 |
| Aliseda | 1 | 36 |
| Cáceres | 12 | 26, 7, 27, 43, 39, 1, 15, 14, 44, 13, 5, 24 |
Publisher’s Note: MDPI stays neutral with regard to jurisdictional claims in published maps and institutional affiliations. |
© 2018 by the authors. Licensee MDPI, Basel, Switzerland. This article is an open access article distributed under the terms and conditions of the Creative Commons Attribution (CC BY) license (https://creativecommons.org/licenses/by/4.0/).
Share and Cite
Calvo-Jurado, C.; Candel-Pérez, M. Modelling Two Dimensional Affected Regions by “Seca” Disease with Proximity Diagrams. Proceedings 2018, 2, 1303. https://doi.org/10.3390/proceedings2201303
Calvo-Jurado C, Candel-Pérez M. Modelling Two Dimensional Affected Regions by “Seca” Disease with Proximity Diagrams. Proceedings. 2018; 2(20):1303. https://doi.org/10.3390/proceedings2201303
Chicago/Turabian StyleCalvo-Jurado, Carmen, and Miguel Candel-Pérez. 2018. "Modelling Two Dimensional Affected Regions by “Seca” Disease with Proximity Diagrams" Proceedings 2, no. 20: 1303. https://doi.org/10.3390/proceedings2201303
APA StyleCalvo-Jurado, C., & Candel-Pérez, M. (2018). Modelling Two Dimensional Affected Regions by “Seca” Disease with Proximity Diagrams. Proceedings, 2(20), 1303. https://doi.org/10.3390/proceedings2201303