1. Introduction
The utilization of solar energy is one of the best effective methods to combat the climate change and this is supported by governments and policy makers [
1]. This issue has developed the need to assess the city’s solar potential of developing countries and cities [
2]. Solar potential models of rooftops in urban areas are usually generated by Geographical Information Systems (GIS) since many years ago [
3]. To improve the precision in those models, Light Detection And Ranging (LiDAR) data has been included for urban areas. Nowadays, the most accurate solar potential model, in an urban area, is obtained using a Digital Surface Model (DSM), determined from LiDAR data, and local meteorological time series [
4]. If further evaluation of the radiation is performed, the orientation and the slope of the roofs are crucial issues and they can be calculated from LiDAR data. To perform this evaluation, a vector could be defined by an azimuth, the orientation of the roof, and a module, the value of the received radiation.
Directional statistics deal with angular data, axes or vectors, and allow us to analyze the orientation in two dimensions. The analysis of angular data requires special methods because directional data is different from the analysis of linear data. Literature dealing with circular data can be consult in [
5,
6].
The purpose of this work is to perform a directional statistical analysis of the distribution of the monthly solar potential of rooftops in Cáceres city related to the orientation of the rooftops in three different neighborhoods. The orientation values will be treated as a directional data and the radiation values as a linear data. The monthly potential solar of rooftops have been calculated using the methodology described in [
7].
2. Study Case
The working area is Cáceres, Spain, a medium size city with a mixed urban distribution. It is a city of 23 km2 with a population of around 100,000 and a Mediterranean climate and positioned in the area with higher solar potential values in Europe, with approximately 5.1 kWh/m2. Three neighborhoods were selected according to different urban characteristics; A portion of the city center with irregular streets and different types of buildings (zone 1), a new residential area in the outskirts of the city with more regular and wide streets and similar buildings (zone 2), and, finally an industrial area (zone 3), with wide streets and similar industrial warehouses buildings. The rooftops delineations were provided by the local council administration and their gables were detailed in most of the buildings.
The variables to be analyzed in these cases are:
To perform the statistical analysis two applications were used, Oriana [
8] and VecStatGraphs2D [
9], that it is an R package.
3. Methods
Linear statistics has been used to analyze the radiation values (module of the vector). The analysis comprises the usual descriptive statistics. Directional statistics has been used to analyze the angular data, that are, the orientation.
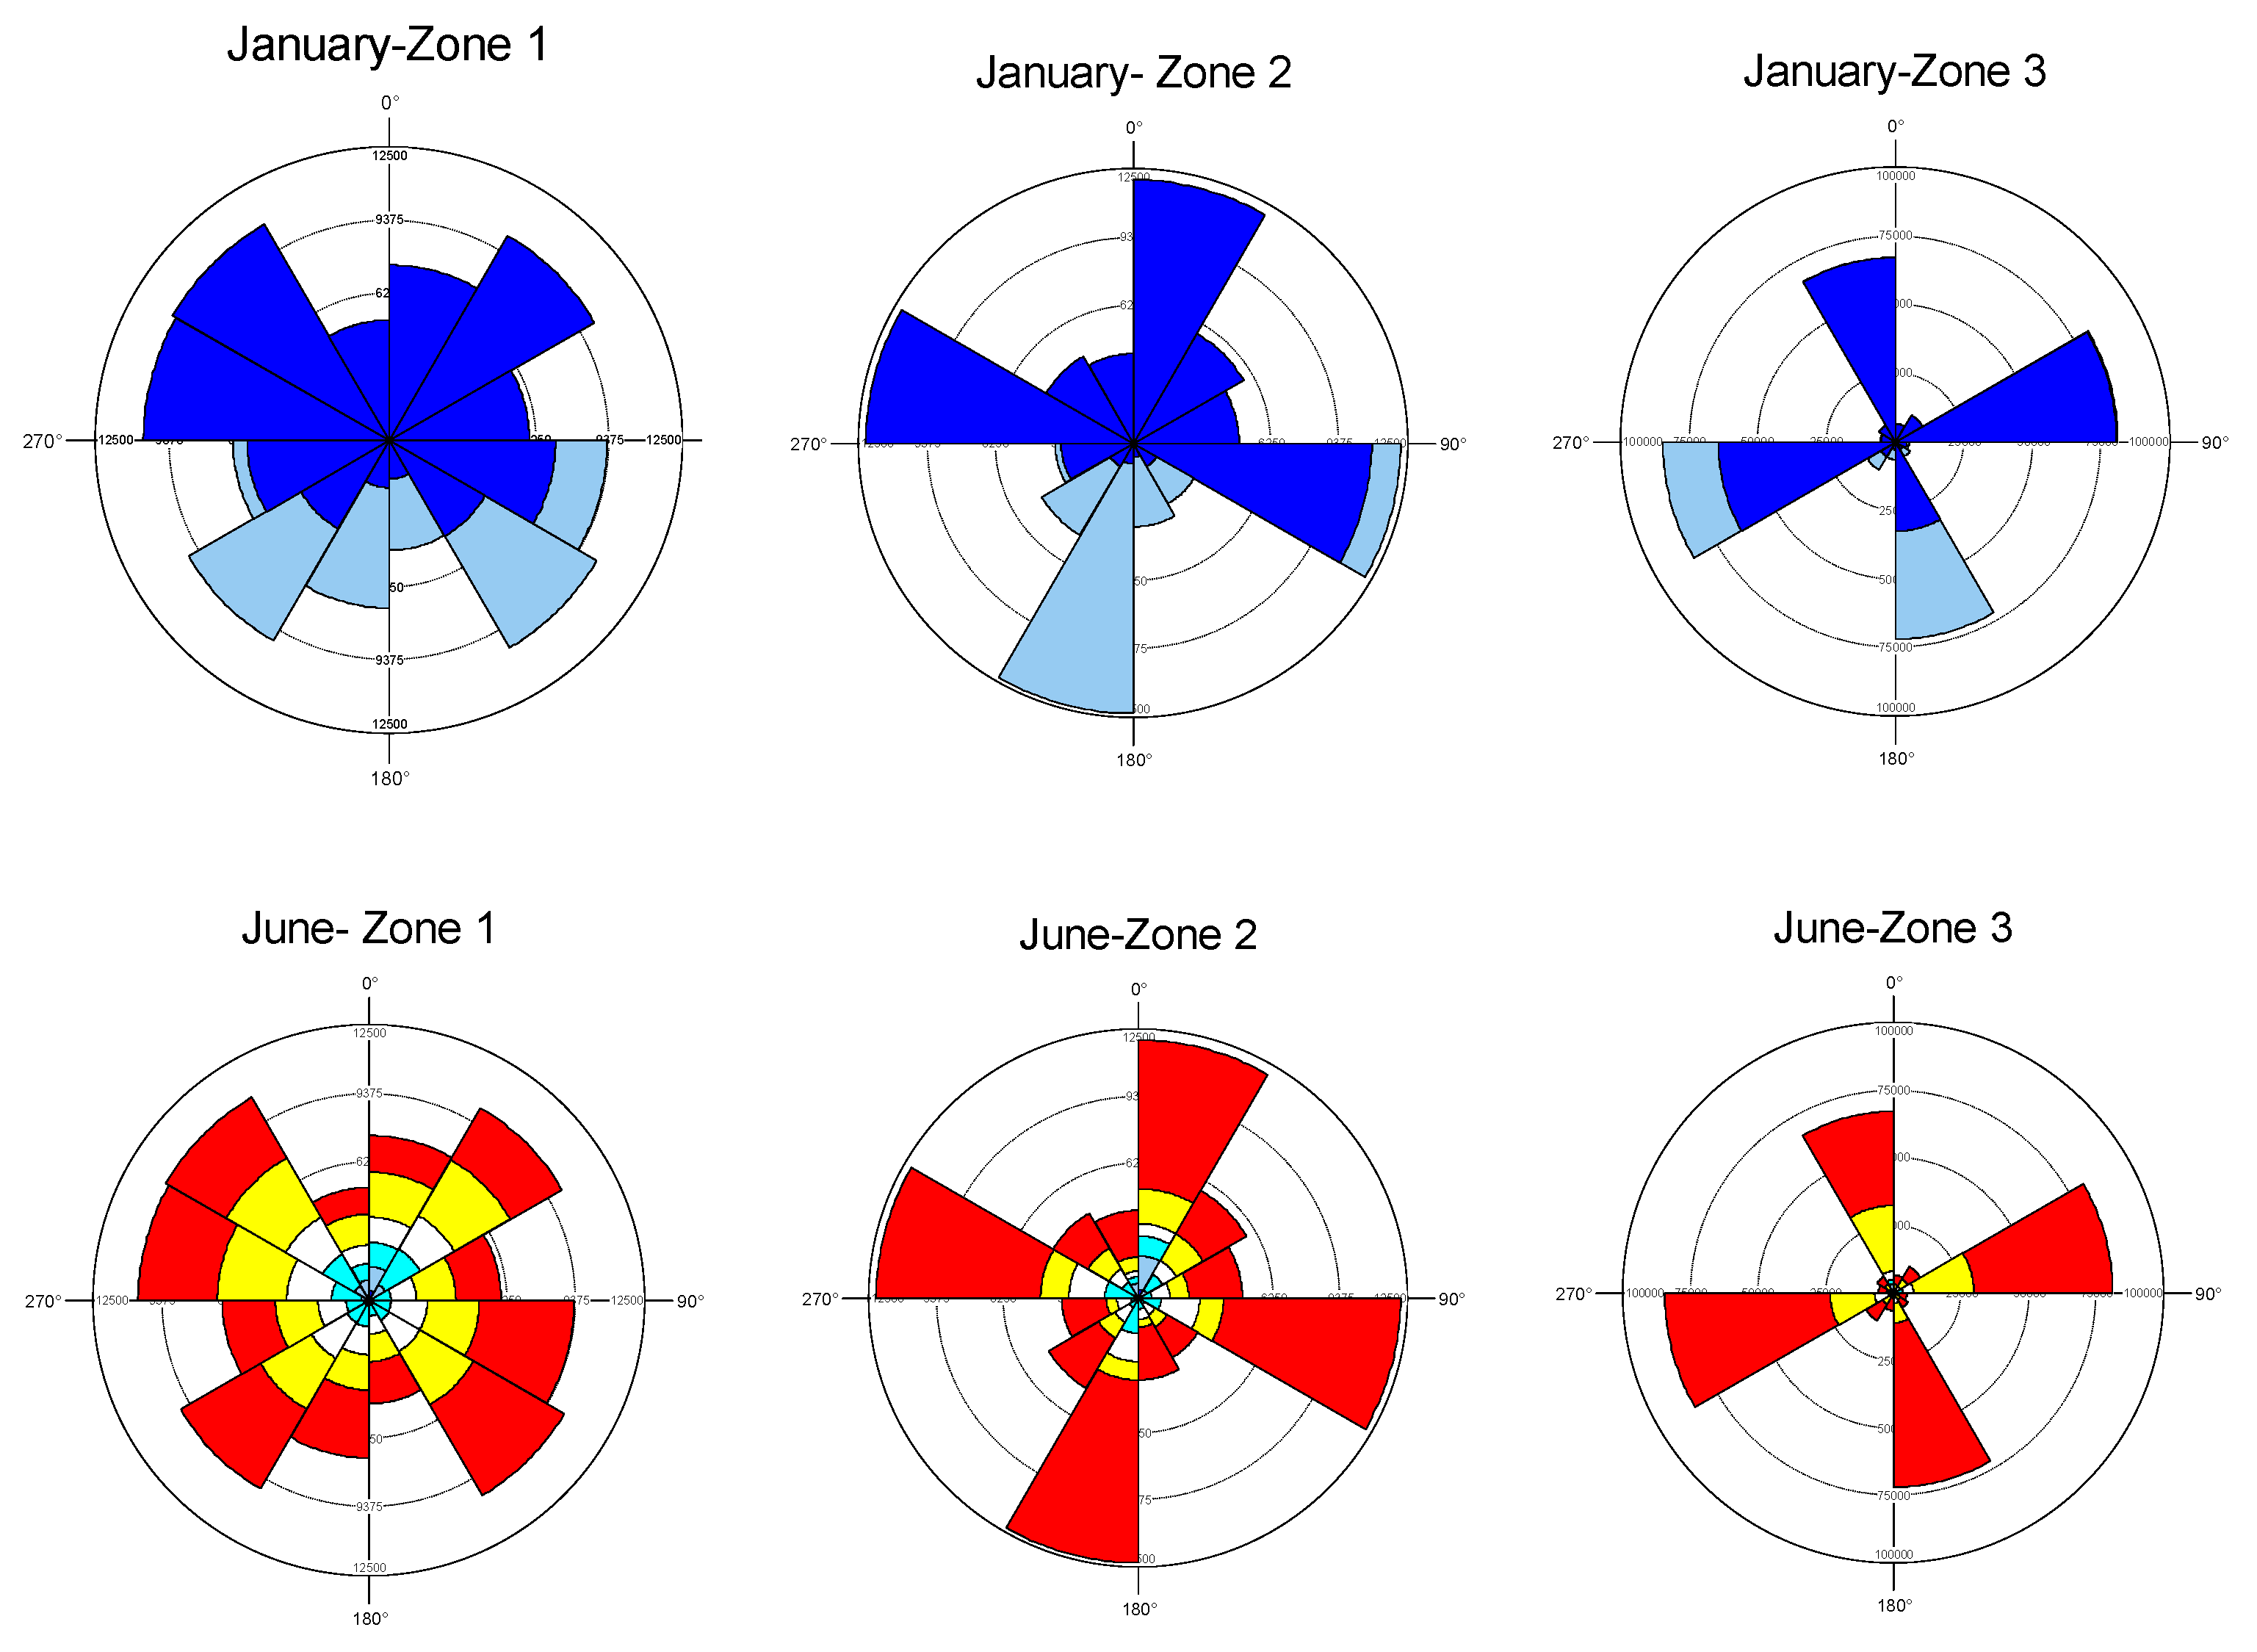
The joint distribution of circular and linear data has been provided by a two-variable circular histogram graphic (
Figure 1). This kind of graphic consists in a histogram wrapped around the circle. Every wedge is divided up the radiation variable into frequency classes represented by a color ramp. Blue colors represent low values of radiation and red color implies a higher level of the received radiation.
4. Results
The directional statistical analysis of the distribution of the monthly solar potential of rooftops in Cáceres city is based on the study of the vector distribution. In this study, the module of the vector corresponds to the radiation value. Some descriptive statistics for the radiation values for the three zones are shown: the arithmetic mean and the minimum and maximum radiation values received. The mean values for the arithmetic mean in zone 1, 2 and 3 are, respectively 3.77, 4.06 and 4.46 kWh/m2. The minimum value of the received radiation is in the range of 0.003 for the zone 1. A higher value is reached for the zone 2 (0.03) and a mean value of 0.01 for the zone 3. In the three cases with little variation between months. Therefore, the zone 1, in the city center, receives a smaller value of the radiation than the other two zones.
It is observed that the maximum value of the arithmetic mean values and the maximum value of the radiation is obtained in July for zones 1 and 2 and in June for zone 3. These maximum values of the arithmetic mean are 6.28, 6.75 y 7.44, respectively. The maximum value of the radiation is 8.33, 8.27 and 8.31, with the same criteria. The minimum value of the arithmetic mean values is obtained in December for zones 2 (1.16) and 3 (1.13) and in January for zone 1 (1.08).
The two-variable circular histogram graphic (
Figure 1) is a histogram wrapped around the circle which each section of the histogram, with 30° wedge-shaped, depict the number of observations (radiations) falling within that portion of the range. Blue colors represent low values of radiation and red color implies a higher level of the received radiation.
According to two-variable circular histogram graphics, the roofs oriented to the North, receive less radiation that the ones oriented to the South specially from September to March. From May to July, the sun is higher and the differences between the two oriented roofs are more equal.
5. Discussion and Conclusions
The numerical and graphical results allow us to compare the radiation values along a year in different types of building in a small city in Spain. According to two-variable circular histogram graphic, the roofs oriented to the North, receive less radiation that the ones oriented to the south, specially from September to March. From May to July, the sun is higher and the differences between the two oriented roofs are more similar. Regarding the urban characteristics, the differences in solar radiation founded in the three different neighbourhoods are also in accordance with works like [
10], where the organization of the streets, buildings and other urban elements had a high impact on the obtained results.
The achievements of the present work make possible to compare the radiation values throughout a year in different types of neighborhoods in a medium size city. The results reveal more in depth the best urban characteristics for capturing solar energy. The proposed analysis could also be extrapolated to urban planning for the designing of more sustainable cities to face with the challenge of climate change.
Author Contributions
E.Q. conceived and designed the experiments; E.Q., M.P. and M.-E.P. performed the experiments; E.Q., M.P. and M.-E.P. analyzed the data; E.Q., M.P. and M.-E.P. contributed reagents/materials/analysis tools; M.-E.P., E.Q. and M.P. wrote the paper.
Acknowledgments
The publication edition was supported by the Government of Extremadura (Spain) (Project GR15129) and co-funded by the European Regional Development Fund.
Conflicts of Interest
The authors declare no conflict of interest. The founding sponsors had no role in the design of the study; in the collection, analyses, or interpretation of data; in the writing of the manuscript, and in the decision to publish the results.
References
- Hoggett, R. Technology scale and supply chains in a secure, affordable and low carbon energy transition. Appl. Energy 2014, 123, 296–306. [Google Scholar] [CrossRef]
- Bazán, J.; Rieradevall, J.; Gabarrell, X.; Vázquez-Rowe, I. Low-carbon electricity production through the implementation of photovoltaic panels in rooftops in urban environments: A case study for three cities in peru. Sci. Total Environ. 2018, 622–623, 1448–1462. [Google Scholar] [CrossRef] [PubMed]
- Marcel, Š.; Jaroslav, H. A new gis-based solar radiation model and its application to photovoltaic assessments. Trans. GIS 2004, 8, 175–190. [Google Scholar]
- Brito, M.C.; Freitas, S.; Guimarães, S.; Catita, C.; Redweik, P. The importance of facades for the solar pv potential of a mediterranean city using lidar data. Renew. Energy 2017, 111, 85–94. [Google Scholar] [CrossRef]
- Fisher, N.I. Statistical Analysis of Circular Data, 2nd ed.; Cambridge University Press: Cambridge, UK, 1995; p. 277. [Google Scholar]
- Jammalamadaka, S.R.; SenGupta, A. Topics in Circular Statistics; World Scientific Publishing: Singapore, 2001; Volume 5, p. 322. [Google Scholar]
- Quirós, E.; Pozo, M.; Ceballos, J. Solar potential of rooftops in cáceres city, spain. J. Maps 2018, 14, 44–51. [Google Scholar] [CrossRef]
- Kovach Computing Service. Oriana for Windows, version 4.02; Kovach Computing Service: Wales, UK, 2012.
- Rodríguez, P.G.; Polo, M.E.; Cuartero, A.; Felicísimo, Á.M.; Ruiz-Cuetos, J.C. VecStatGraphs2D, a tool for the analysis of two-dimensional vector data: An example using quikscat ocean winds. IEEE Geosci. Remote Sens. Lett. 2014, 11, 921–925. [Google Scholar] [CrossRef]
- Montavon, M.; Scartezzini, J.L.; Compagnon, R. Comparison of the solar energy utilisation potential of different urban environments. In Proceedings of the 21th Conference on Passive and Low Energy Architecture, Eindhoven, The Netherlands, 19–22 September 2004. [Google Scholar]
| Publisher’s Note: MDPI stays neutral with regard to jurisdictional claims in published maps and institutional affiliations. |
© 2018 by the authors. Licensee MDPI, Basel, Switzerland. This article is an open access article distributed under the terms and conditions of the Creative Commons Attribution (CC BY) license (https://creativecommons.org/licenses/by/4.0/).


