1. Introduction
Image classification is fundamental in many important applications relying on remote-sensed data. Marine surveillance is critical in this sense, for its vital importance in safety and security applications, including safety of life at sea, marine traffic control, and monitoring of smuggling and other illegal activities. High-resolution, satellite-borne synthetic-aperture radar (SAR), is one of the technologies used in marine surveillance, since it provides wide-area images independent of weather and daylight, thus enabling the designated authorities to monitor a large number of targets, provided that fast analysis tools are available. To discover possibly anomalous behaviours in time to take proper countermeasures, an automatic or partially automatic analysis system is essential, able to detect all the ships in the imaged area, to extract their features, and to foresee their possible courses.
In this paper, we assume to have a series of images cropped from a wide-swath SAR image, each containing a single ship, and propose a method to obtain a list of overall sizes and headings estimated from such crops. A number of SAR target classification methods have been proposed in the literature [
1,
2,
3,
4], based on radiometric and polarimetric features extracted from the image. In actual images, however, this is not always feasible, as polarimetry could not be available and artefacts due to strong reflectors, insufficient sampling rates or antenna sidelobes could be present. The marine clutter, moreover, can affect the data heavily, depending on the sea state, the wind and the ocean currents. In these conditions, provided that the spatial resolution is sufficient, we rely on geometrical features. This is normally difficult for the mentioned distortions but, when accomplished, allows us to estimate the size of a vessel, to make a coarse classification (e.g., small, medium, or large ship), and also to estimate its heading, a first step to evaluate its course and, ultimately, its short-term behaviour.
We propose first to isolate the target by clipping the image outside a mask including the ship and the possible artefacts, then to compute the 2D inertia tensor with respect to the barycentre of the resulting image. The subsequent step is to find the principal inertia axes and to apply a rectangular mask around the barycentre, so as to include the whole target while cutting out part of the artefacts. Iterating this procedure a few times, a progressively refined estimation of the ship length overall (), beam overall () and heading is possible. Indeed, when no artefact is cut out anymore, we take the unit vector of the minimum inertia axis as the estimated heading, and the maximum distances between target boundary points along the principal axes as the estimated and . In the absence of further information, such as a detected wake or possible morphological ship features, the heading is estimated up to a ambiguity.
The key to our idea is that, if a figure has a symmetry axis containing the barycentre, this will necessarily coincide with a principal axis of inertia. Now, in our case, we do not look for a general shape, as a ship has always a pseudo-rectangular shape, the main deck being almost symmetric with respect to its fore-and-aft line, which coincides with the axis of minimum inertia. The port-to-starboard line drawn through the barycentre, conversely, is not a symmetry axis, but corresponds to the axis of maximum inertia, orthogonal to the fore-and-aft line and passing, approximately, through the midship section. The size of a rectangular mask enclosing the target but cutting out part of the artefacts can be set up by exploiting a further observation, valid for the ship but not for the artefacts: the distance from the principal axes of any point on the actual ship boundary is never larger than a fixed multiple of its standard deviation. This allows us to adopt a simple criterion based on the standard deviations to size the rectangular mask, thus avoiding general methods [
5,
6], or methods based on a preliminary detection of the fore-and-aft line in some transform space [
7]. The latter are also based on the peculiarities of vessel-type targets, but must rely on a very efficient artefact suppression. Our experimental results demonstrate the effectiveness of this method.
In
Section 2, we shortly outline our method, whereas in
Section 3 we show some examples of application to real SAR images. Finally, in
Section 4, we draw some conclusions and perspectives.
2. Method
Let us denote by
F a scalar 2D digital image of a ship target, obtained by clipping a SAR image through a binary mask which is a coarse approximation of the ship shape, possibly distorted by artefacts of various origins. The inertia tensor of this image [
8], with respect to the barycentre
, is
where
are the inertia moments. An eigenvalue analysis of matrix
I yields
where the columns of matrix
V,
and
are the unit vectors of the principal axes of inertia, and the elements of the diagonal matrix
,
and
, are the inertia moments with respect to those axes. The inertia matrix computed with respect to
and
features a vanishing mixed moment
. If we assume
, the axes parallel to, respectively,
and
passing through the barycentre are the minimum and maximum inertia axes. For an undistorted ship image, they coincide with the fore-and-aft and the port-to-starboard lines. Their equations are, respectively,
with
and
.
Each point in the image domain has signed distances
and
from the principal axes (
6)–():
For the points in the image shape, we can compute four quantities, referred to here as
,
,
, and
mean-squared distances from the principal axes. For the
heading ambiguity, stern and bow and port and starboard can be interchanged, so the subscripts
s,
p,
f and
a used in the following equations are just suggestive.
where the sets
to
include all the pixels in the target image with
and
assuming, respectively, negative and positive signs, and
to
are their cardinalities. We use the
distances
,
,
and
to build a rectangular mask that includes the whole target and excludes part of the artefacts. When these are removed from the image, refined estimates of the barycentre and the principal axes can be found. Iterating this procedure, we can refine our estimates until nothing falls outside the rectangle.
To establish the size of the mask, we rely again on the pseudo-rectangular shape of a vessel-type target: in our measurements, we found that the distance of the ship boundary from its axes is never larger than 2.07 times the related
distance. Thus, in most cases, a rectangle identified by the
forward line, at a distance
from the maximum-inertia axis, the
aft line, at a distance
from the maximum-inertia axis, the
starboard line, at a distance
from the minimum-inertia axis, and the
port line, at a distance
from the minimum-inertia axis, with
, will enclose the whole ship. This is visualised in the synthetic image of
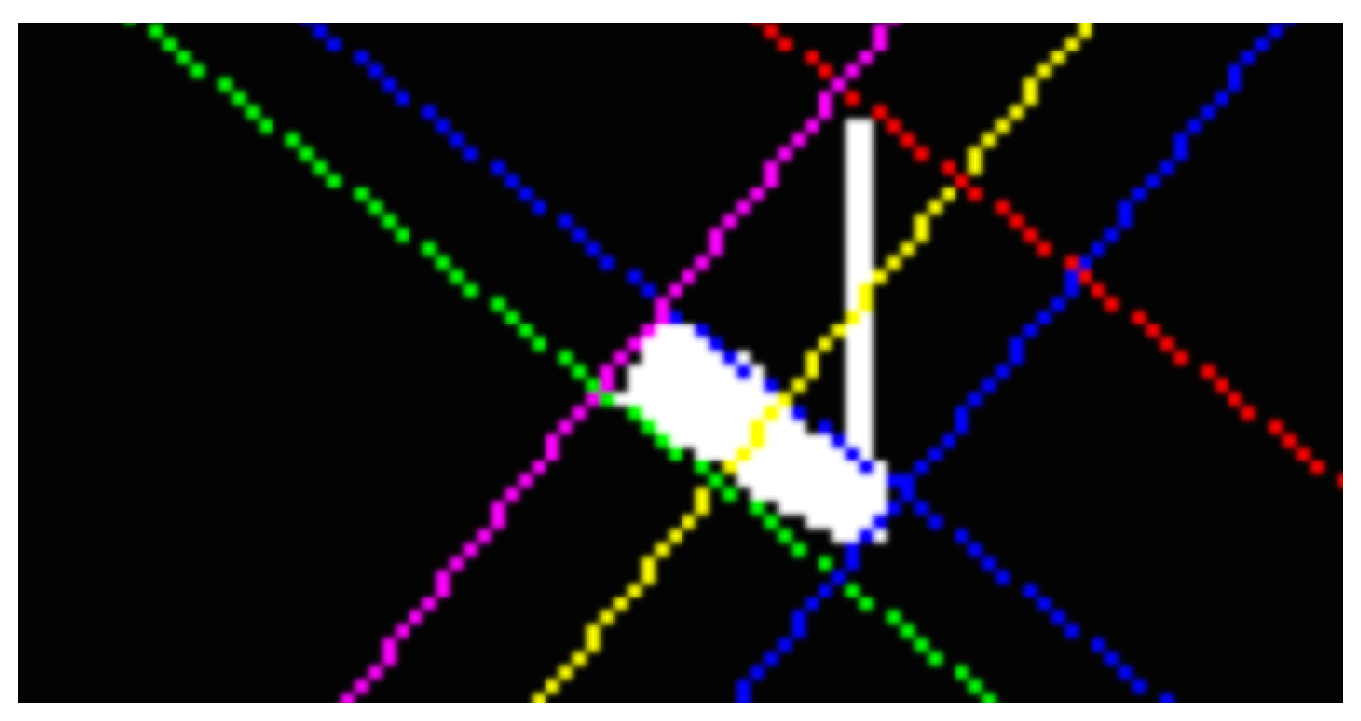
Figure 1, affected by a large artefact that causes a notable displacement of the barycentre and the principal axes.
In this case, the artefact alters so much the
distances that the rectangle encloses completely the detected shape, and the procedure we devised becomes ineffective. We have two ways to check whether such a situation is verified. The first considers the ratio
between the area of the target and the area of the enclosing rectangle: in real cases, this ratio is always larger than 0.85 and, in a number of real SAR images we analysed, is seldom less than 0.7. A small
thus connotes a target+artefact geometry that is not compatible with the shape of a ship. Also, for an artefact-free shape, it is
, and
is not significantly different from
. This shortcoming can be remediated, however. If
is found to be significantly less than one, the first few (normally, one or two) iterations can be performed by only using the
transverse and the
longitudinal root-mean-square distances
and then centring a rectangle of sides
and
on the barycentre. Part of the artefact now falls outside this rectangle and can be erased. When
exceeds a fixed threshold, the iteration can proceed normally.
After a few iterations, the possible residual artefacts do not produce a significant distortion in the estimated axes and enclosing rectangle, so further iterations would leave the image unchanged. An effective stop criterion can thus consider the ratio . When its value remains the same after two consecutive iterations, the algorithm can be stopped. At this point, the minimum-inertia axis approximates the fore-and-aft line of the ship, and can thus be used to estimate its direction. To estimate and , we have two options. The first is to simply put and . This choice could overestimate the measurements, since is chosen to safely enclose the whole target but, depending on its particular shape, can leave some room around it. A second option is to compute the distances between the points where the target boundary intersects the principal axes. The presence of false-negative pixels, however, can produce an underestimation of the ship size. Providing both estimates could set useful bounds on and . A further refinement, important for small targets, should be made taking into account the spatial resolution. This is out of the scope of this paper.
Sometimes, we found artifacts that are almost as strong as the target image and with comparable sizes. In these cases, if no privileged symmetry axis is present, the ratio between the estimated and does not fit the values normally found for ships, and the heading estimate is largely uncertain. A ratio between the maximum and the minimum inertia moments that is too close to 1 is an index of either a heavily distorted image or a target that is not classifiable as a ship. In the next section, we show a few concrete examples.
3. Experiments
The target frames we used to validate the method presented here are cropped from
Sentinel 1 satellite-borne C-band SAR images [
9], in both amplitude and intensity, and a fixed pixel size of 10 m × 10 m. The possible polarisations are VV and VH. No ground truth is available, so our results can only be evaluated on the basis of general
a priori knowledge. A first example is shown in
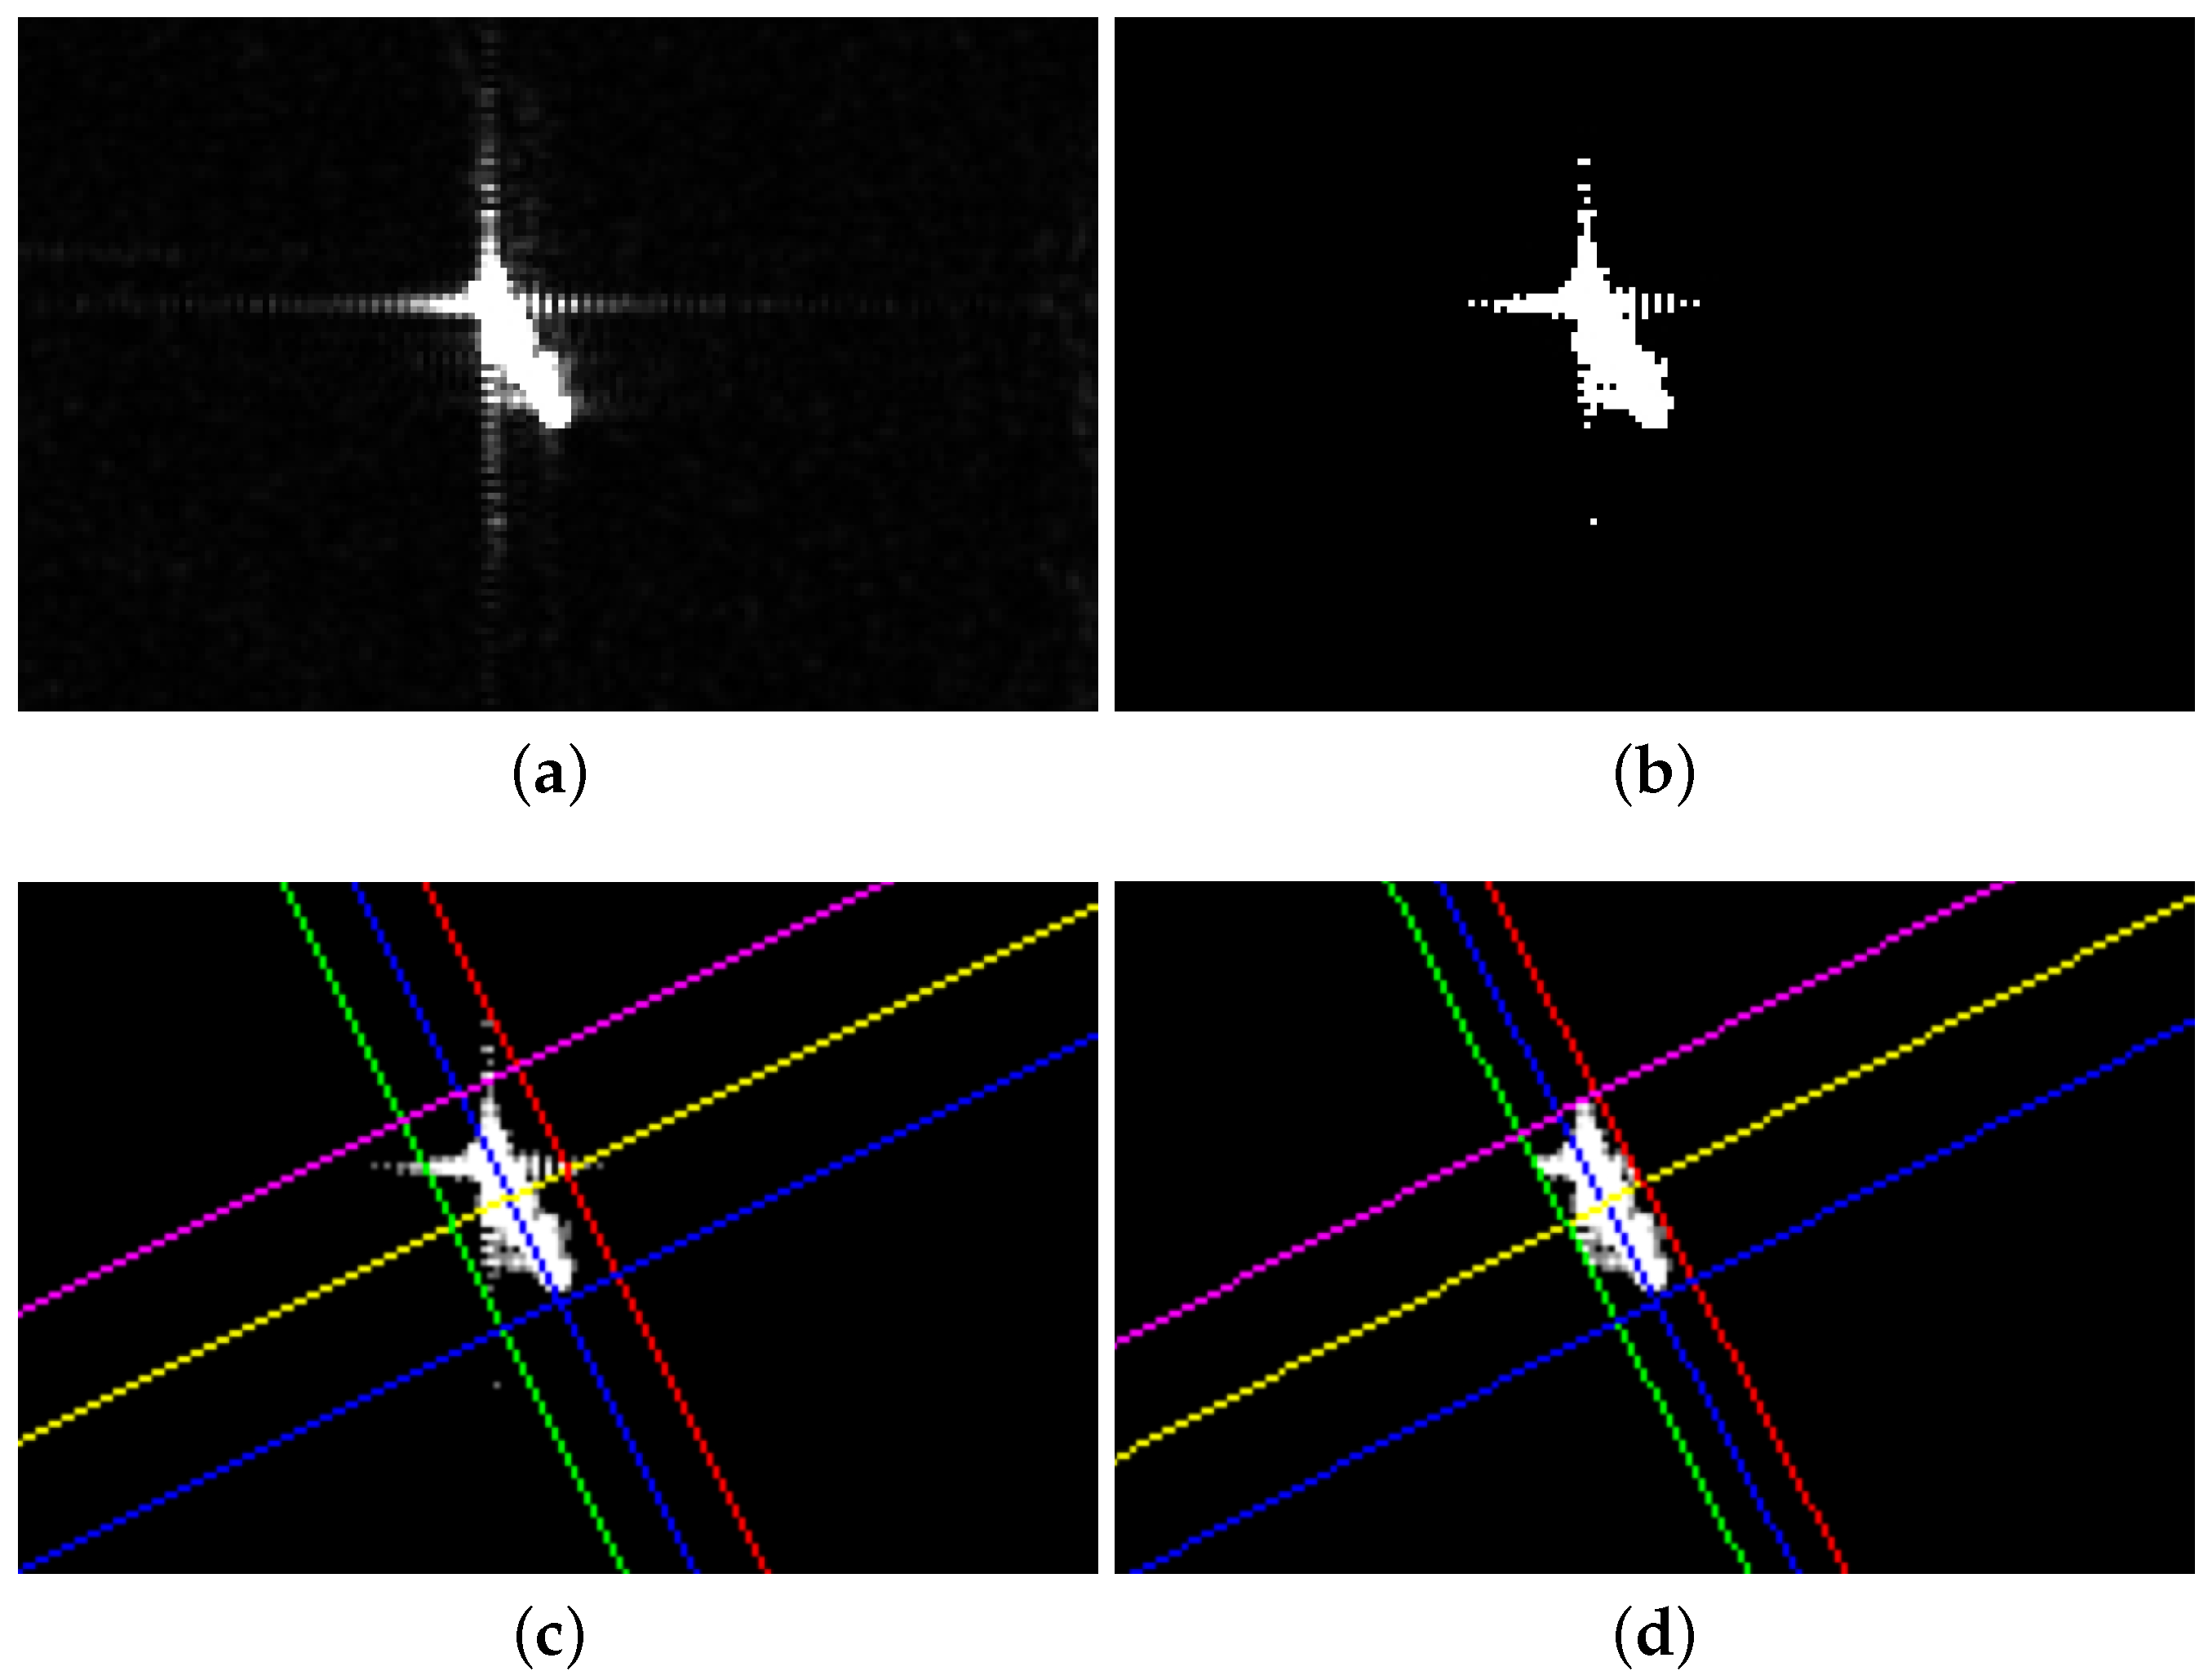
Figure 2a, an intensity image where the presence of a strong, cross-shaped artefact is apparent. The first step of our procedure consists in building a binary shape where the target pixels are set to 1 and the rest is 0. Being a coarse approximation, this can be done by thresholding, for example, by the classical constant false-alarm rate technique for adaptive thresholding (see, e.g., [
10]). The result of a similar procedure is shown in
Figure 2b.
Figure 2c,d shows how, in the first iteration of our procedure, the artefact falls partly outside the rectangle, and just four iterations are able to isolate accurately the artefact-free shape.
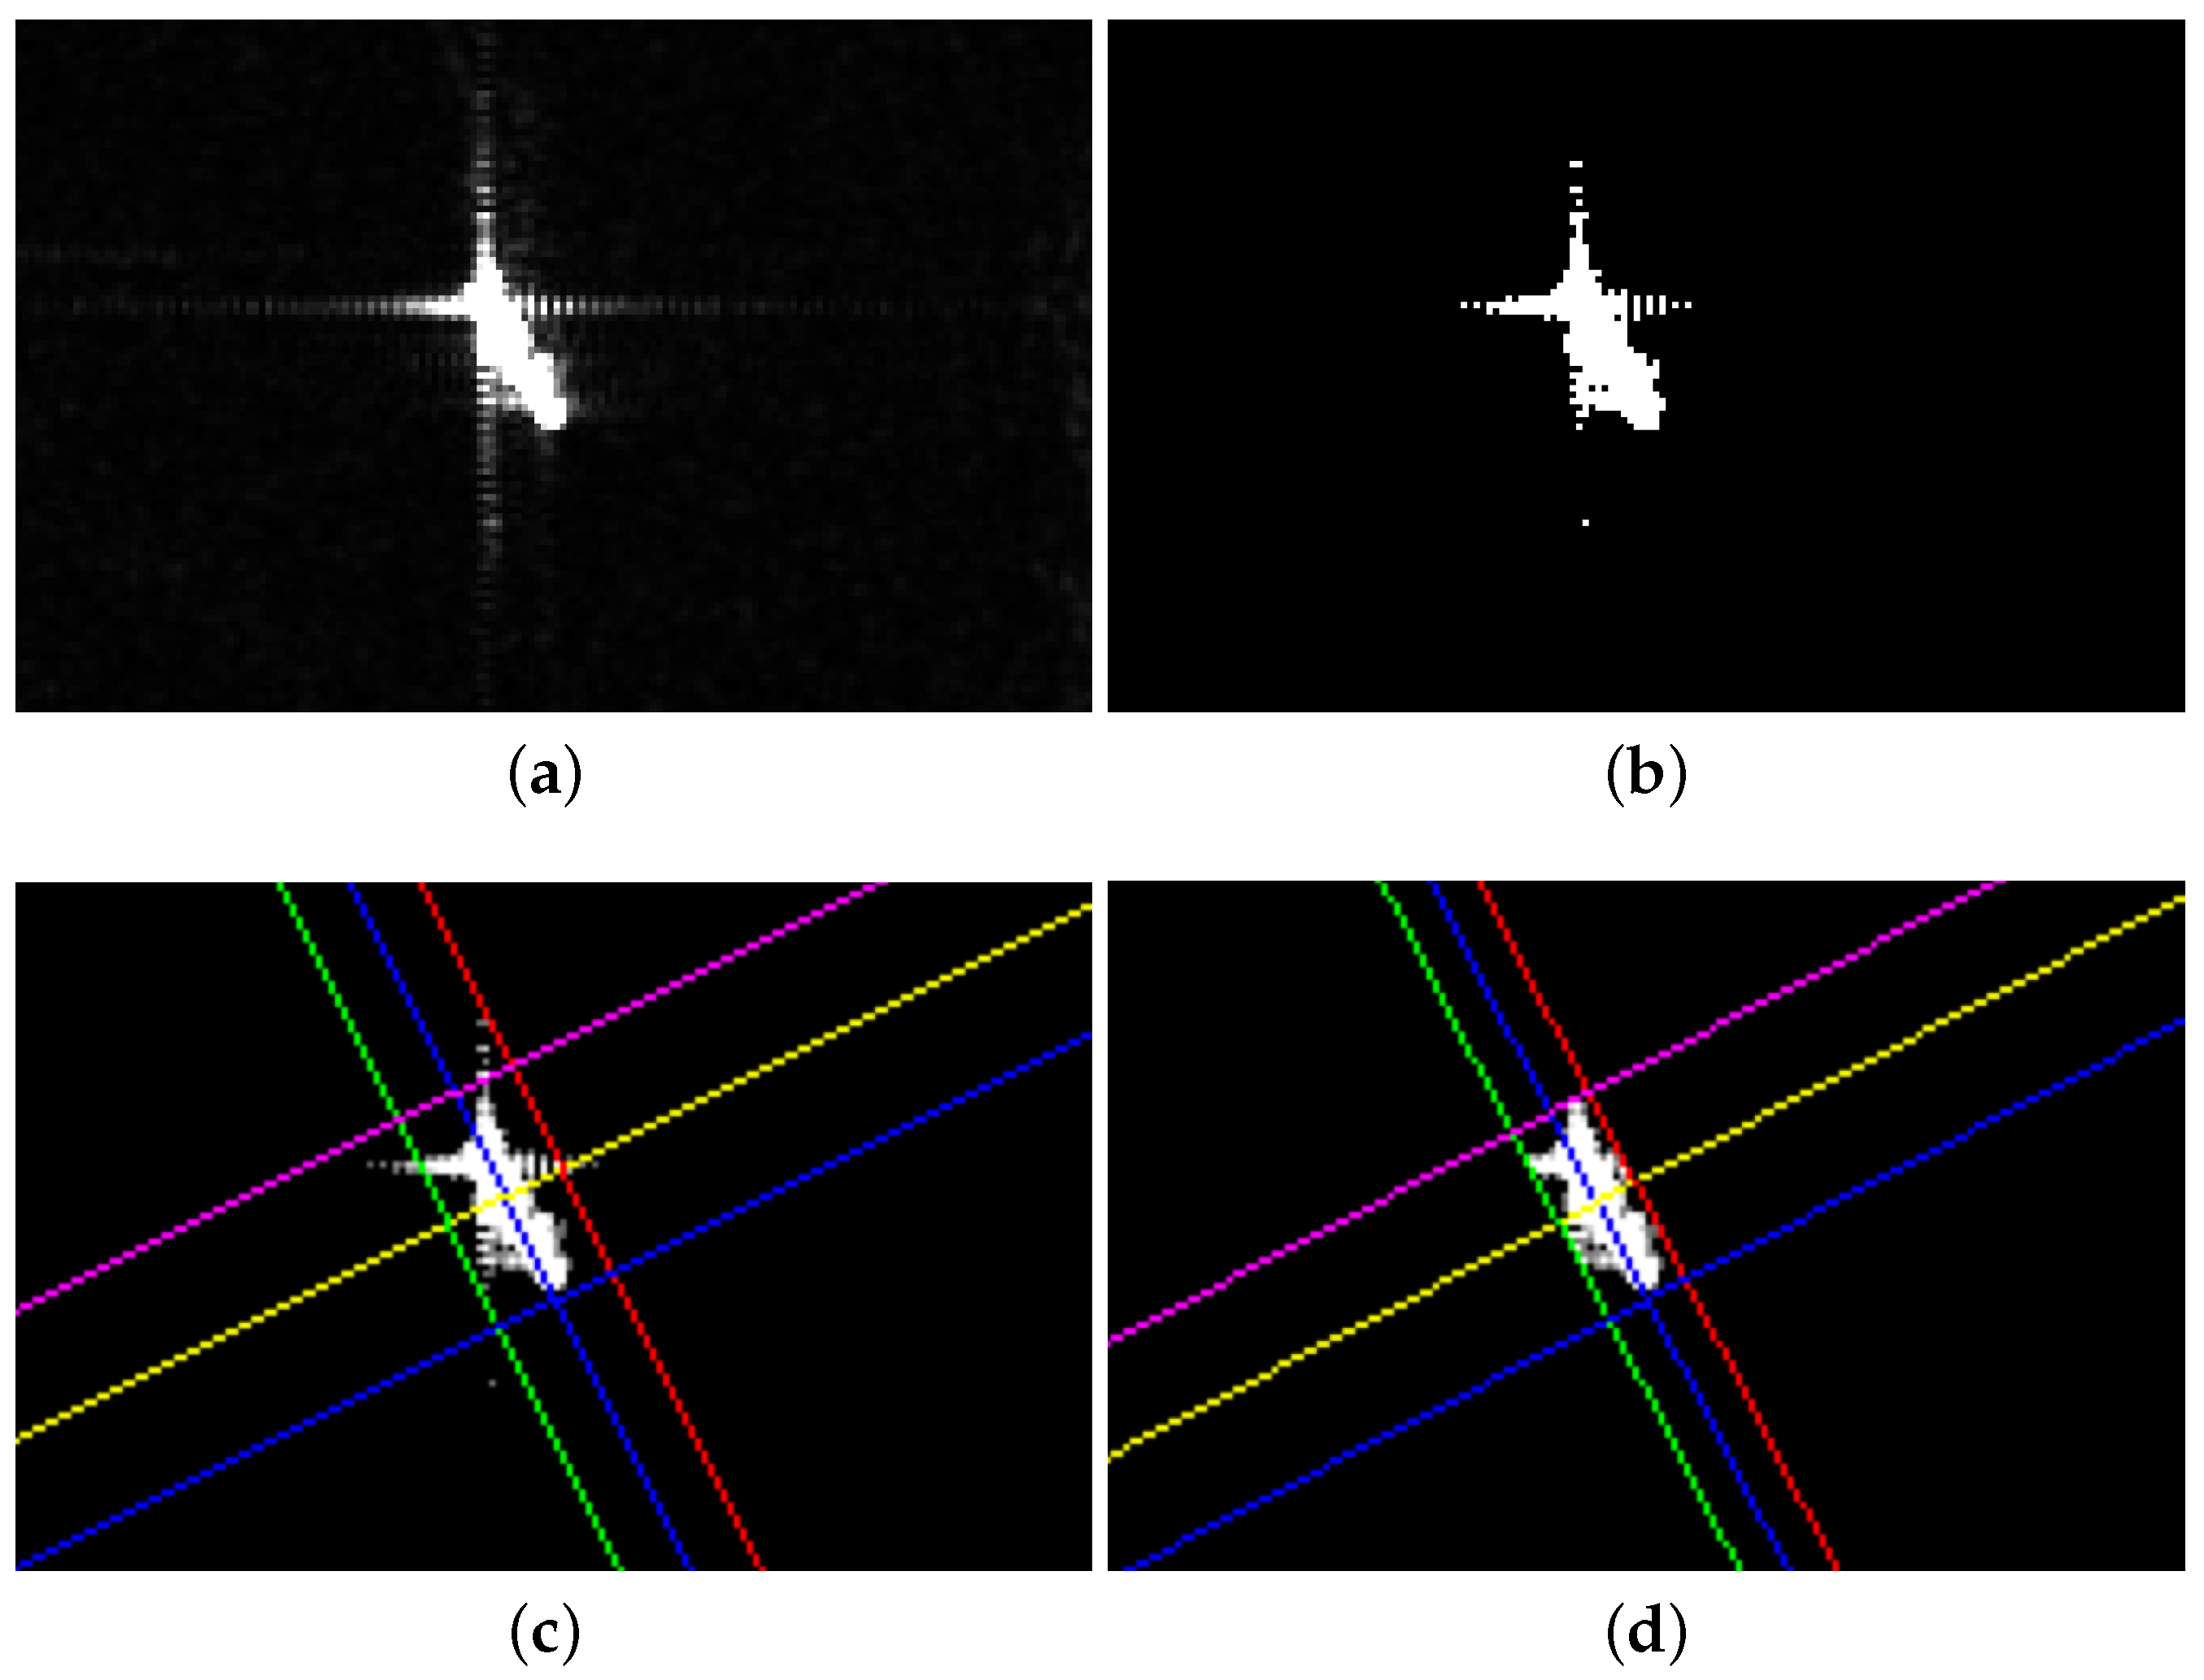
Figure 3 shows an example with an amplitude image, clearly more cluttered than the previous one.
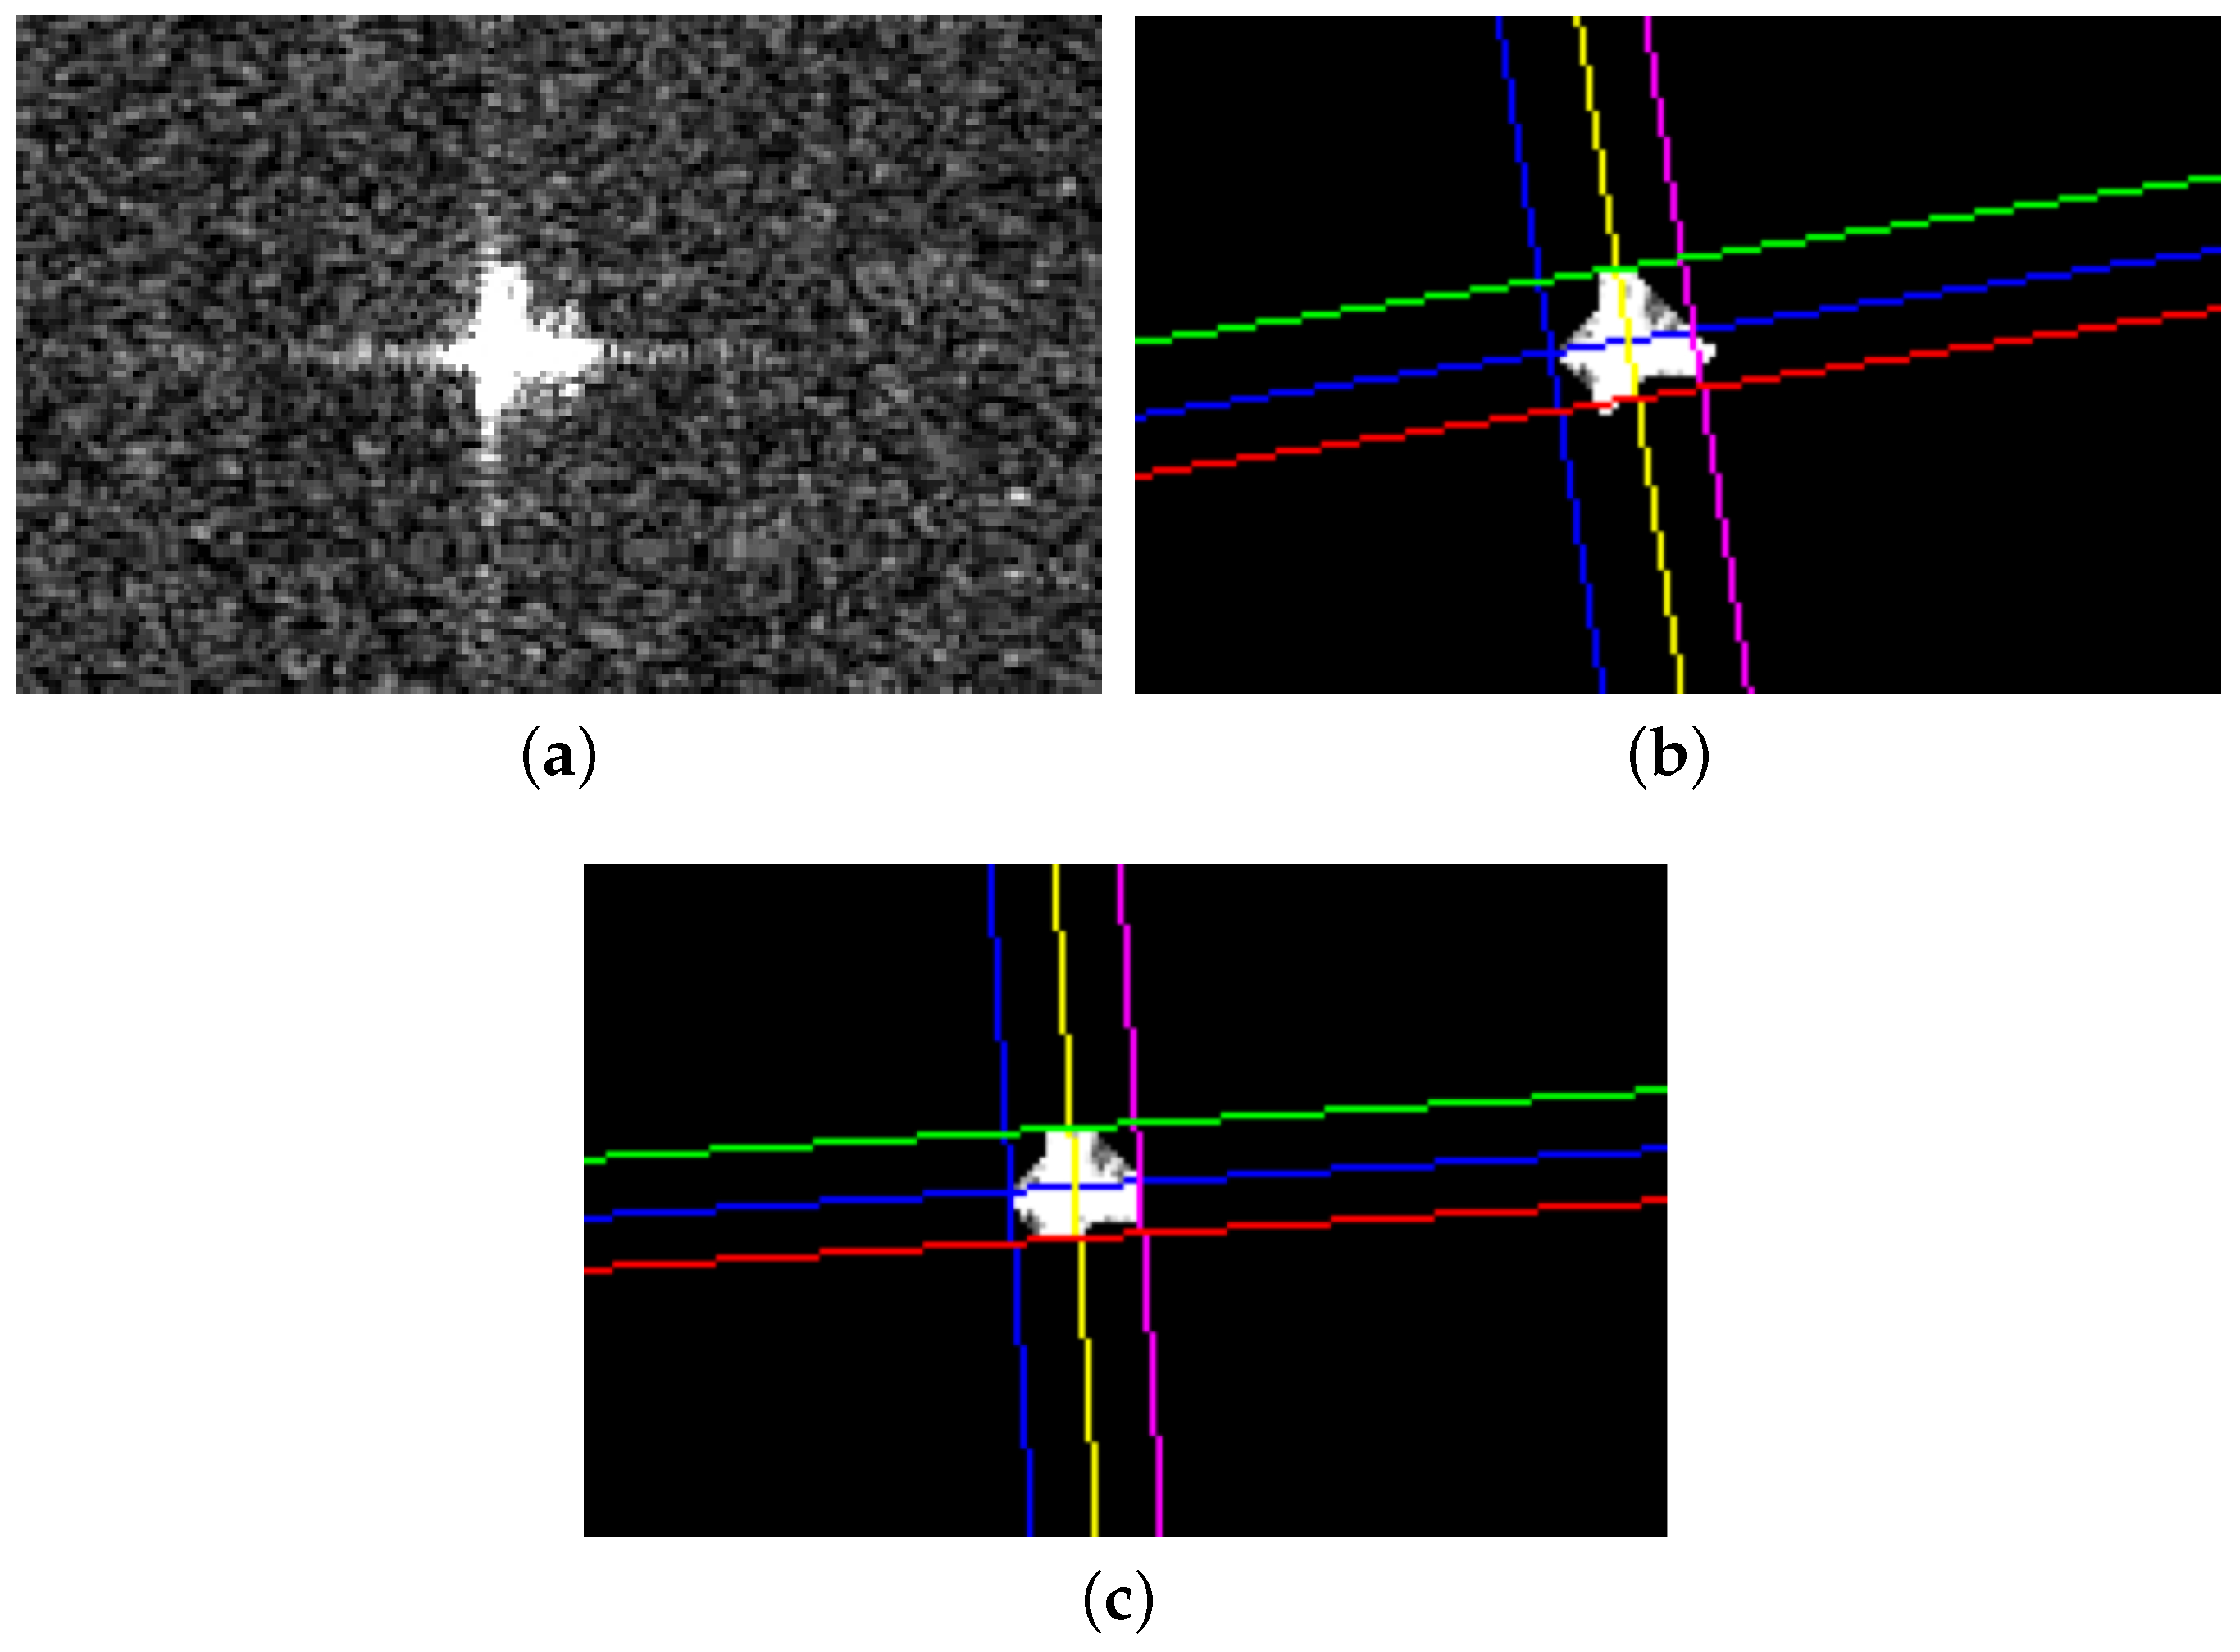
A case where the procedure is unsuccessful is shown in
Figure 4. Besides having an amplitude comparable with that of the detected target, here the artefact is also of comparable size, thus producing significantly uncertain estimates. In this case, the image is largely saturated and it is difficult to distinguish the target from the artefact, even by visual inspection, as the arms of the cross-shaped artefact are almost aligned with the supposed ship axes. The final value obtained for the area ratio
is 0.755, sufficiently large to prevent any automatic system from recognising an anomaly, but the final rectangular mask is almost square, and the principal inertia moments
and
are of the same order of magnitude. This is not compatible with common ship shapes, and could be used as an index of failure, as well as a flag to activate some more sophisticated estimation strategy.


