Abstract
The recent advances in sensing technologies, embedded systems, and wireless communication technologies, make it possible to develop smart systems to monitor human activities continuously. The occupancy of specific areas or rooms in a smart building is an important piece of information, to infer the behavior of people, or to trigger an advanced surveillance module. We propose a method based on computational topology to infer the occupancy of a room monitored for a week by a system of low-cost sensors.
1. Introduction
Improving the energy efficiency of buildings is a lively research topic. Technologies for the monitoring and consequent intervention on the environment not only help saving resources, but also improve the well-being perceived by building occupants [1]. One of the simplest policies to improve energy-efficiency while respecting the well-being of occupants, is the automatic regulation of the usage of energy based on the occupancy of the building spaces [2]. If no users are detected in the monitored space, inactive devices can be disconnected; environmental setpoints for air conditioners, heaters, and humidifiers can be decreased; lights can be lowered or turned off.
The key requisite for implementing occupancy-driven applications is an accurate, inexpensive, and non-intrusive method for monitoring occupancy. Non-intrusive means that the user is not required to have smartphones or RFID identification systems, which provide information about its presence within the space. Usually, such systems are referred to as device-free, and exploit the networks of acoustic, inertial, environmental and power sensors already installed in the buildings [3].
Recently, many authors proposed to analyse data from multiple sensors (electric power meters, accelerometers and noise meters) to identify the user’s presence or absence in a space [4,5]: variations of sensor time series, due to the arrival or exit of a user from a space, are analyzed to infer a classification template for the user’s presence/absence. Conversely, refs. [6,7,8] address the problem of identifying user activities by analyzing the spectral fingerprint of the energy consumption due to the used appliances during their activities. Ref. [9] investigates about the possibility of identifying the user activity by analyzing energy consumption patterns from electrical appliances.
Device-free sensing of building occupancy poses many challenges, as any sensor shows a noisy behavior under certain conditions. For example, inertial sensors can cause spurious detection deriving from pets movements; though CO2 sensors are less sensitive to their placement and to external events, their efficiency is directly related to the ventilation of the building. Therefore, robustness to noise is a key issue for device-free sensor system. In this work, we present an algorithm for extracting topological features from sensor time series, to support the implementation of a device-free detection algorithm of presence/absence. Basing on the theory of Persistent Homology, we evaluate the relevance of topological features as their persistence (a topological event’s lifespan) in the so-called barcodes [10]. The assumption is that persistent features identify important events, while features with a shorter lifespan correspond to noise. The result is a topological fingerprint of the user’s presence, which can be used in an unsupervised approach for state classification. The main advantages brought by Persistent Homology are low computational cost, and high resilience to noisy data.
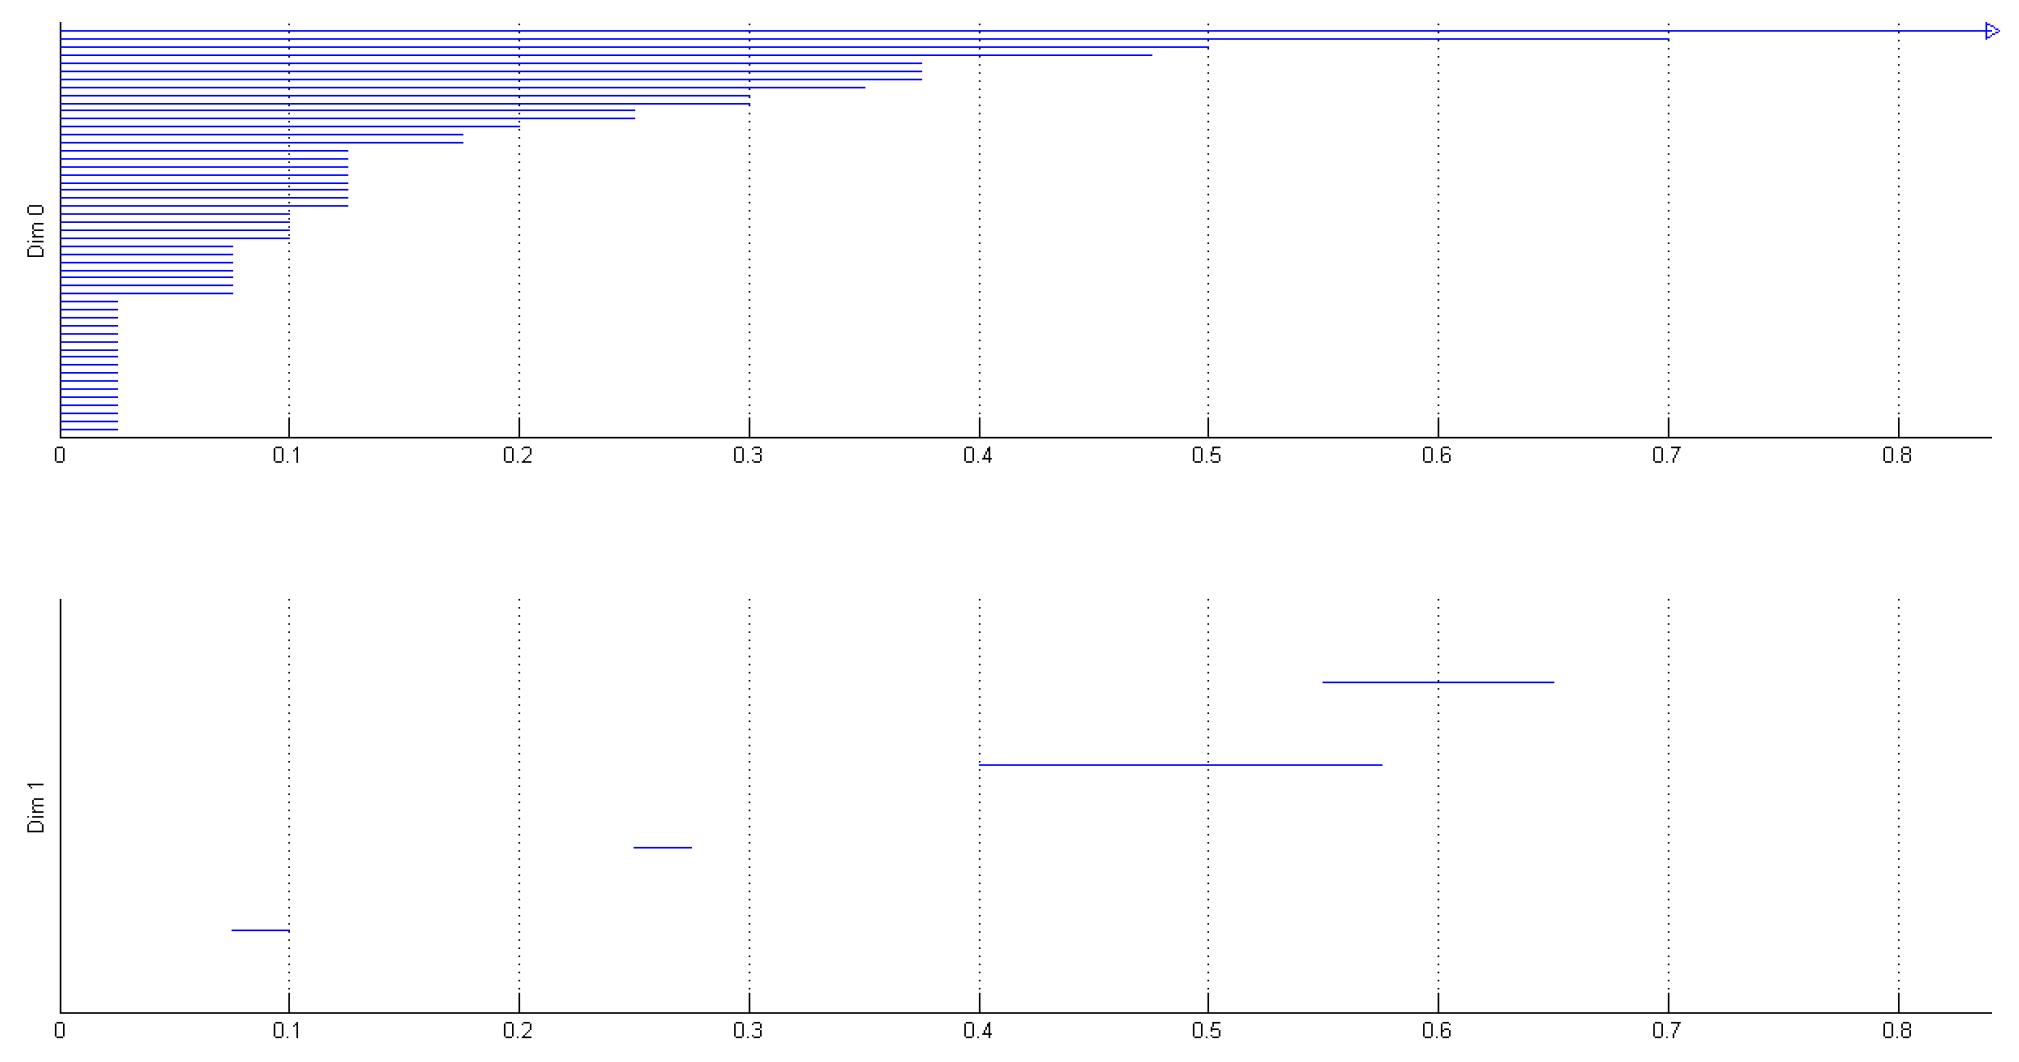
2. Topological Data Analysis
Topology is a branch of mathematics dealing with qualitative information of an object: topology looks at the intrinsic and global properties of an object, such as its shape [11]. Recently, Topological Data Analysis (TDA) methods are increasingly used to investigate and characterize multidimensional datasets. The research on TDA was recently boosted by the introduction of the Persistent Homology (PH) theory [12], along with fast algorithms for its computation [13] and efficient implementations [14]. The application scenarios include shape and texture analysis [15], biological and molecular data analysis [16], sensor networks [17], image and signal processing [18,19,20]. In what follows, we offer a brief intuition on PH; we refer the reader to [21] for a rigorous treatment of the subject.
The core idea of PH is to represent data as filtered simplicial complexes. Given a simplicial complex (for example, a triangle mesh), filtering the complex means defining a rule to build the complex as a sequence of nested sub-complexes. An example of filtered complex is the Vietoris-Rips complex, whose construction is shown in the example of Figure 1: at the first stage of the filtration, only the nodes are included; then, in subsequent steps, the edges in the complex appear ordered by the distance between their endpoints (the filtration parameter). There are many viable choices on how to filter a complex associated to a dataset: this is one of the main strengths of PH-based approaches. Once the dataset is encoded as a filtered simplicial complex, one evaluates the birth and death of topological events (homology classes) while growing the filtration parameter: for example, when connected components appear and when are merged, when holes are created and when are closed off, and so on. The lifespan of these events is stored in a stable invariant: the barcode. A barcode in a given dimension i is a collection of horizontal bars in a plane: the horizontal axis corresponds to the parameter to filter the complex, while the vertical axis represents an arbitrary ordering of homology generators in dim i (see Figure 2 for an example of barcodes in dim 0 and 1). The length of each bar is interpreted as the lifespan or persistence of the corresponding generator: short bars are interpreted as noise, while long bars as important topological features.
Figure 1.
An example of the Rips-Vietoris complex associated to a 2D point could, with the filtration parameter d induced by the Euclidean distance between points. At the complex is made of the 0-points, as shown in (a); increasing d in (b), (c) and (d), edges, faces and tetrahedra enter the simplical complex.
Figure 2.
An example of two barcodes (dim 0 and 1) from the experiment described in Section 3: they are computed from , with .
In this paper, we compute the persistence barcodes on time series from multiple sensors placed in a room, to detect the points in time when the room is occupied. The assumption is that room occupancy is reflected by some topological features in PH. To compute the barcodes, the first step is to discretise the sensor time series and represent them as filtered complexes, as described in the next Section.
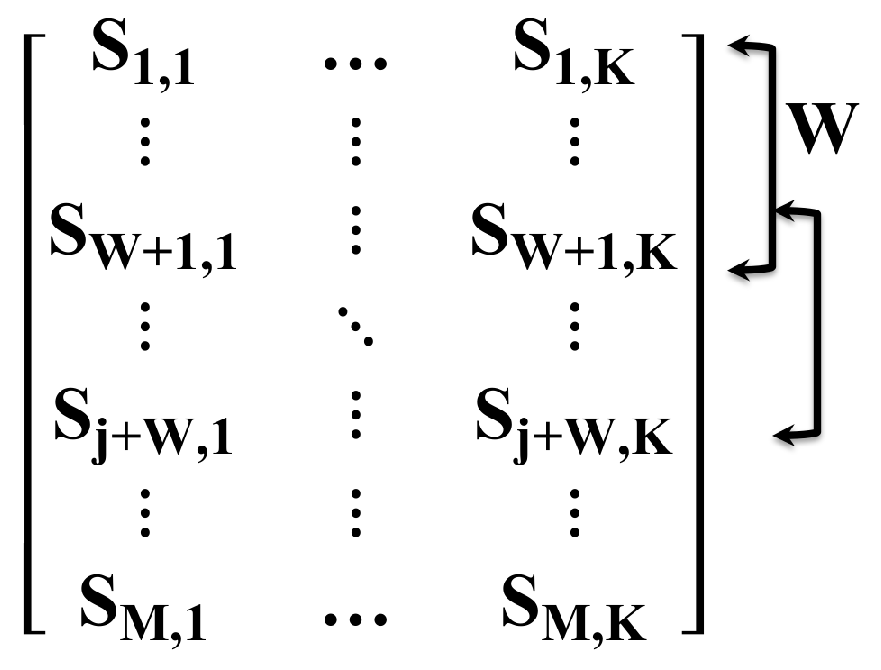
3. Feature Extraction Algorithm
Given K different sensor time series, each of length M, we represent them with a matrix (Figure 3): each column corresponds to the time series of a single sensor, whereas each row corresponds to all sensor values sampled at a given time. Then, we cluster rows into sliding windows [19]: each corresponds to W time samples of all K sensors, with each window sharing samples with the previous one. Therefore, each can be seen as a point cloud, made of W points in the Euclidean space , where the coordinates correspond to the output of the different sensors.
Figure 3.
Matrix Representation of the Data.
For each point cloud associated with a sliding window, we compute the Vietoris-Rips complex filtered by the Euclidean distance between points, and compute the corresponding barcodes. The analysis of the barcodes then gives insights on the likelyhood of a window to correspond to a period when the room is occupied. In particular, we analyse the barcodes through a set of descriptors derived by the topological features summerized in each barcode [20]: the number of and topological events; the number of and topological long events (i.e., events with lifespan greater than a fixed threshold: in dimension 0 and in dimension 1); and the average lifespan in dimension 0 and 1.
The feature extraction algorithm is summarised in Algorithm 1. The computations have been carried out using JavaPlex [22].
| Algorithm 1 PH-based Algorithm for Feature Extraction. |
|
The set of descriptors is evaluated as a predictor of the occupancy of the room. The detection procedure works as follows: (i) the window for which the descriptor reaches its highest values is selected; (ii) this selection is performed over all the descriptors; (iii) the intersection among the set of selected windows is evaluated. The detection of presence occurs in the windows belonging to the intersection; and the absence in the remaining windows.
4. Experiments
The following subsections describe our scenario and the results we got in our preliminary study.
4.1. Experimental Set-Up
The detection of the user’s presence was performed using time series acquired by three sensors: motion, acoustic, and a power meters sensor. Acoustic and motion sensors are characterized by a binary output: they return 1 if motion, or respectively high level of environmental noise, is detected, and 0 otherwise. The output of the power meter is a scalar that ranges from 0 to the level of consumed electric power.
The sensors’ time series were acquired at an average sampling rate of 1 per minute, through a monitoring system installed in an office at the National Research Council of Italy (CNR) in Pisa. The office is 25 m2 and it is used by only one employee. The typical working day at CNR ranges from 9.00 a.m. to 6.00 p.m. (Monday–Friday). Lamps, PCs and other appliances such as printers, kettles or coffee machines, may be present in the room.
The sensors deployed in the office communicate via ZigBee protocol with a gateway based on the Raspberry PI board which runs an integration middleware for sensing information. The data collected by the gateway are stored on a cloud infrastructure hosted at CNR. The cloud is organized as a set of virtual machines based on an VMware ESX Server providing three kinds of services: storage, visualization through an interactive dashboard, and tools for the analysis of data.
The data have been collected for one week asking the occupant to register the ground truth of the room occupancy.
The three time series were temporally aligned: a week of acquisition produced 8840 samples for each time series. So, the data matrix in Figure 3 has rows and columns. Rows have been grouped in sliding windows of size: . For each value of the window size W, we obtain a sequence of point clouds in , with the corresponding Rips-Vietoris complex and persistence barcodes.
The number of long topological features, for each , was counted using different values for both thresholds and . Precisely, we have characterized topological events on a lattice of points , both ranging in the interval with step size .
4.2. Results
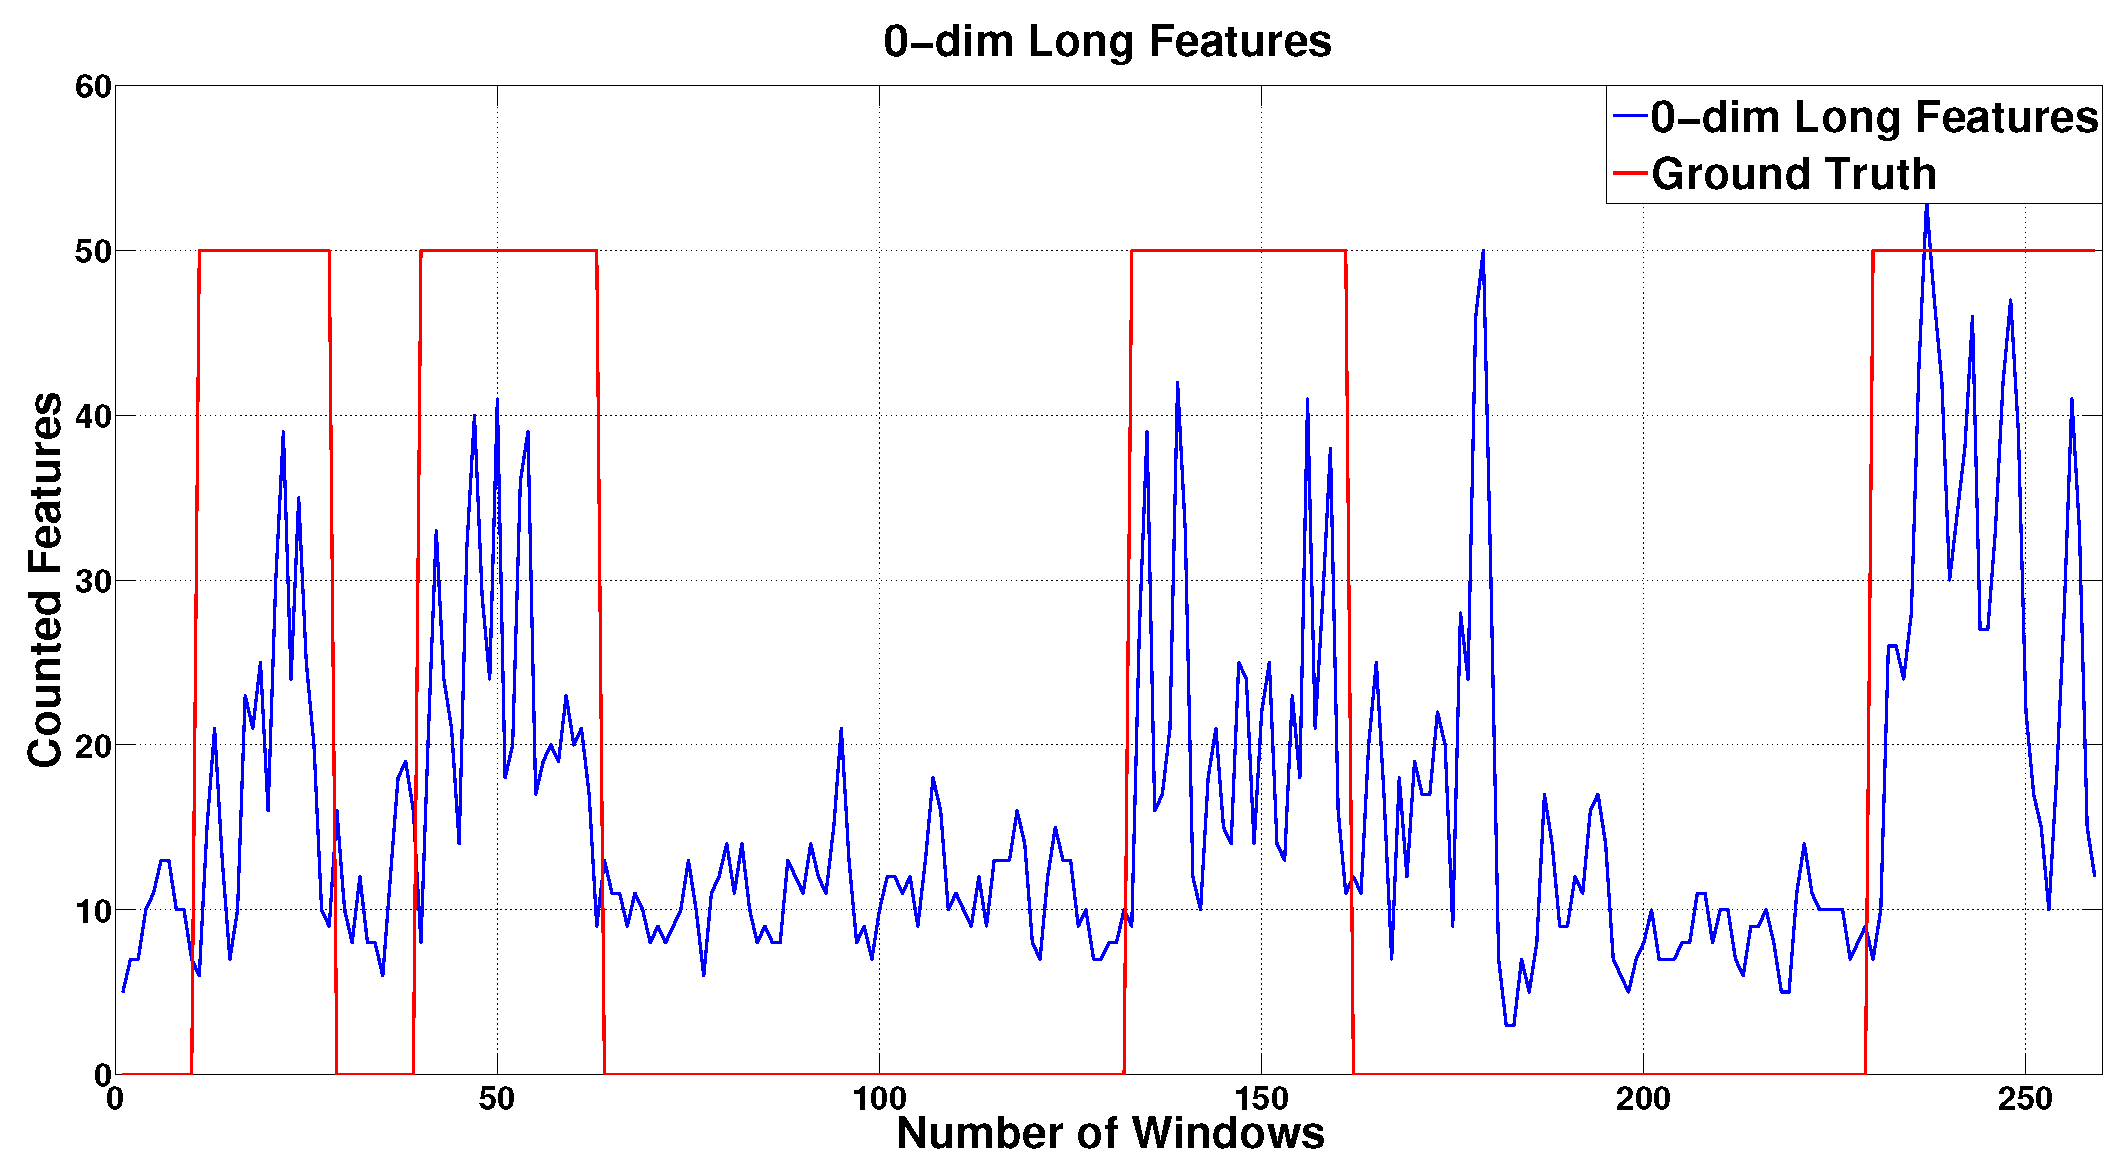
4.2.1. Relation between Descriptors and Room Occupancy
Figure 4 shows the number of counted features for each , with . The comparison of this graph with the ground truth suggests that the greater number of features is obtained for those windows corresponding to the presence of the user in the office. In general, features in dim 0 showed better correlation with room occupancy than features in dimension 1. This is probably due to the fact that 0-dimensional features are linked to the correlation between samples within the windows considered, while features in dim 1 are indicators of possible periodic pattern in the signal time series, which are negligible in our data.
Figure 4.
0-dim Long Features. The graph of the number of features (blue) is shown together with the ground truth graph (red).
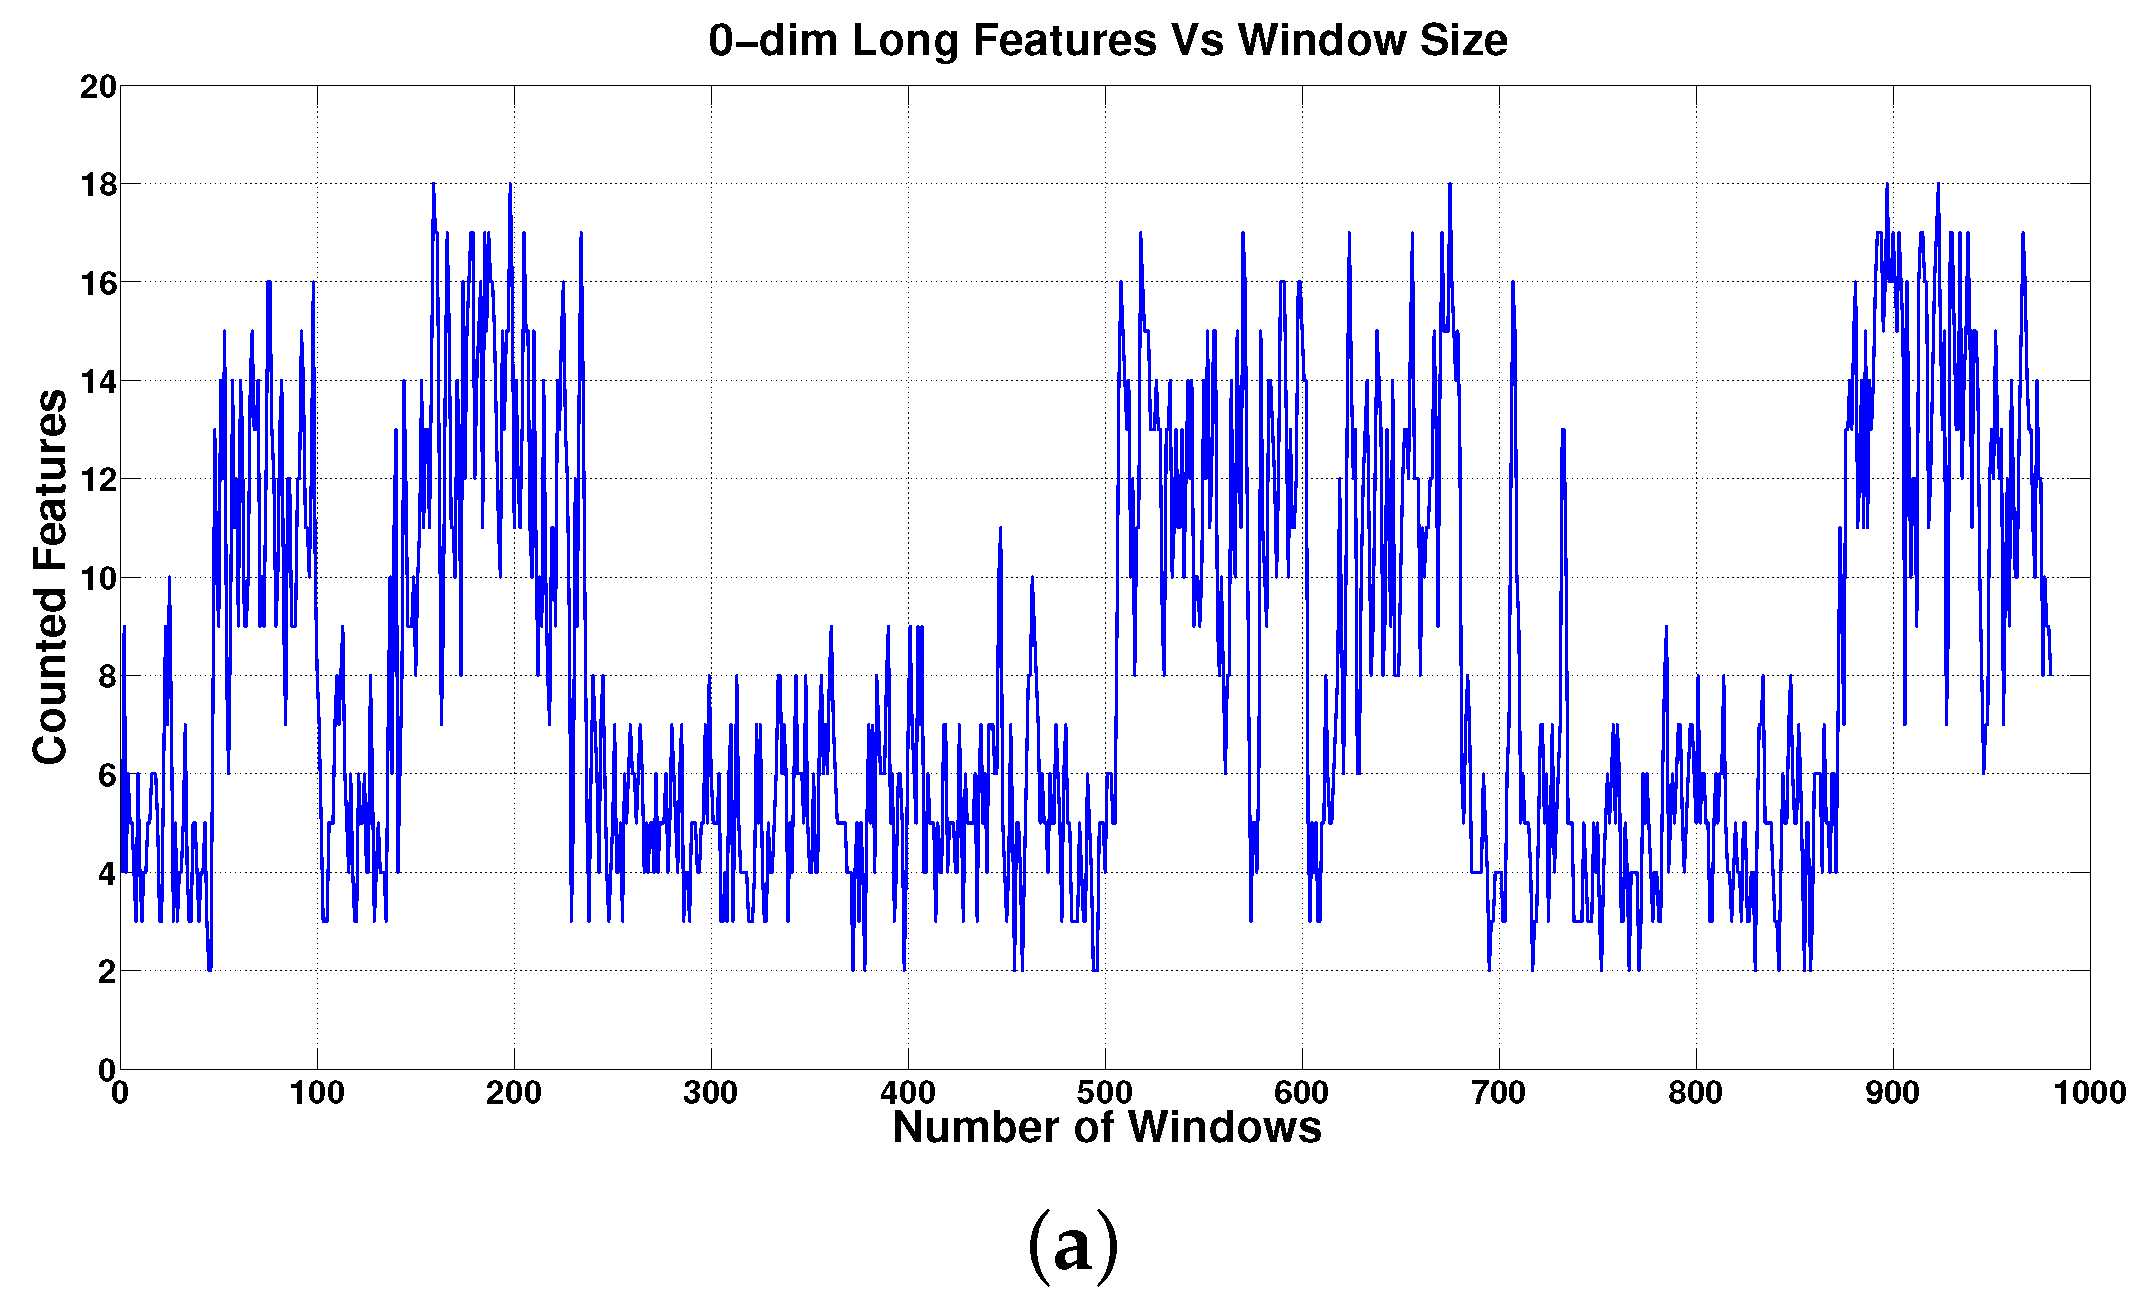
4.2.2. Dependence on the Window Size
Figure 5 shows the dependence of the dim Long Features on the window size W. It shows that the more samples are included within the same window, the more information can be extracted: increasing the window size, the number of features counted in windows corresponding to the user’s presence increases. On the other hand, a smaller window size would imply a lower number of features and may cause the loss of useful information.

Figure 5.
0-dim Long Features vs. Window Size: each graph shows the number of features counted in the corresponding sliding window of size 18 in (a), 34 in (b), and 68 in (c). Note that increasing the window size results in a larger number of features. (a) W = 18; (b) W = 34; (c) W = 68.
4.2.3. Prediction Performance
Figure 6 shows the prediction performance obtained with the descriptor extracted from sensor time series with the values and , which provided the best set of descriptors for the detection procedure. The values ‘Presence’ and ‘no Presence’ in the axes ‘Verified’ are the ground truth, as registered by the room occupant; values ‘Presence’ and ‘no Presence’ in the axes ‘Predicted’ are those obtained by our detection algorithm. Figure 6 shows that the detection algorithm detects a ‘Presence’, which is confirmed by the ground truth. Instead, with a probability of 88% the detection algorithm detects a ‘no Presence’, which is again confirmed by the ground truth. The algorithm performance in our preliminary study is promising compared to the results in [3], considering that their period of experimentation is quite longer (one month vs one week).
Figure 6.
Performance of the prediction algorithm: confusion matrix after one week.
5. Conclusions and Future Work
The results reported in the previous section show that PH-based methods are useful to encode the information from low-cost monitoring systems about human activity. A further analysis may be carried out in order to understand if the proposed set of topological features may characterize more precisely human activity, not limiting to the occupancy of a room. Viable options for developing a topology-based activity detection may be: increasing the number of low-cost sensors used for the data acquisition, increasing the computation of PH to dimensions , and complementing topological data analysis with adaptive detection techniques.
Acknowledgments
For the time series used to validate the results presented in this paper, we give thanks to the framework of the ”Renewable Energy and ICT for Sustainability Energy” project, supported by the Italian Ministry of University and Research (MIUR) through the project ”Active Ageing at Home” (CTN01 00128 297061).
Conflicts of Interest
The authors declare no conflict of interest.
References
- Barsocchi, P.; Ferro, E.; Fortunati, L.; Mavilia, F.; Palumbo, F. EMS@ CNR: An energy monitoring sensor network infrastructure for in-building location-based services. In Proceedings of the 2014 International Conference on High Performance Computing & Simulation (HPCS), Bologna, Italy, 21–25 July 2014; pp. 857–862. [Google Scholar]
- Barsocchi, P.; Cimino, M.G.; Ferro, E.; Lazzeri, A.; Palumbo, F.; Vaglini, G. Monitoring elderly behavior via indoor position-based stigmergy. Pervasive Mob. Comput. 2015, 23, 26–42. [Google Scholar] [CrossRef]
- Barsocchi, P.; Crivello, A.; Girolami, M.; Mavilia, F.; Ferro, E. Are you in or out? Monitoring the human behavior through an occupancy strategy. In Proceedings of the 2016 IEEE Symposium on Computers and Communication (ISCC), Messina, Italy, 27–30 June 2016; pp. 159–162. [Google Scholar]
- Kleiminger, W.; Beckel, C.; Staake, T.; Santini, S. Occupancy detection from electricity consumption data. In Proceedings of the 5th ACM Workshop on Embedded Systems For Energy-Efficient Buildings, Roma, Italy, 11–15 November 2013; pp. 101–108. [Google Scholar]
- Chen, D.; Barker, S.; Subbaswamy, A.; Irwin, D.; Shenoy, P. Nonintrusive occupancy monitoring using smart meters. In Proceedings of the 5th ACM Workshop on Embedded Systems For Energy-Efficient Buildings, Roma, Italy, 11–15 November 2013; pp. 91–98. [Google Scholar]
- Patel, S.N.; Robertson, T.; Kientz, J.A.; Reynolds, M.S.; Abowd, G.D. At the flick of a switch: Detecting and classifying unique electrical events on the residential power line. In UbiComp 2007: Ubiquitous Computing; Springer-Verlag: Berlin, Germany, 2007; pp. 271–288. [Google Scholar]
- Ruzzelli, A.G.; Nicolas, C.; Schoofs, A.; O’Hare, G.M.P. Realtime recognition and profiling of appliances through a single electricity sensor. In Proceedings of the 2010 7th Annual IEEE Communications Society Conference on Sensor Mesh and Ad Hoc Communications and Networks (SECON), Boston, MA, USA, 21–25 June 2010; pp. 1–9. [Google Scholar]
- Rosdi, N.A.M.; Nordin, F.H.; Ramasamy, A.K. Identification of electrical appliances using non-intrusive magnetic field and probabilistic neural network (pnn). In Proceedings of the 2014 IEEE International Conference on Power and Energy (PECon), Kuching, Malaysia, 1–3 December 2014; pp. 47–52. [Google Scholar]
- Klingensmith, N.; Willis, D.; Banerjee, S. Extracting events from spatial time series. In Proceedings of the 11th ACM Conference on Embedded Network Sensor Systems, Roma, Italy, 11–15 November 2013; pp. 5–8. [Google Scholar]
- Ghrist, R. Barcodes: The Persistent Topology of Data. Bull. Am. Math. Soc. 2008, 45, 61–75. [Google Scholar] [CrossRef]
- Hatcher, A. Algebraic Topology; Cornell University: New York, NY, USA, 2001. [Google Scholar]
- Edelsbrunner, H.; Harer, J. Persistent homology—A survey. Contemp. Math. 2008, 453, 257–282. [Google Scholar]
- Zomorodian, A.; Carlsson, G. Computing Persistent Homology. Discret. Comput. Geom. 2005, 33, 249–274. [Google Scholar] [CrossRef]
- Otter, N.; Porter, M.A.; Tillmann, U.; Grindrod, P.; Harrington, H.A. A roadmap for the computation of persistent homology. arXiv 2017, arXiv:1506.08903. [Google Scholar] [CrossRef] [PubMed]
- Biasotti, S.; Falcidieno, B.; Giorgi, D.; Spagnuolo, M. Mathematical Tools for Shape Analysis and Description; Morgan & Claypool: Williston, VT, USA, 2014; Volume 6. [Google Scholar]
- Jonoska, N.; Saito, M. Discrete and Topological Models in Molecular Biology; Natural Computing Series; Springer: Berlin/Heidelberg, Germany, 2014. [Google Scholar]
- Silva, V.D.; Ghrist, R. Coverage in sensor networks via persistent homology. Algebr. Geom. Topol. 2007, 7, 339–358. [Google Scholar] [CrossRef]
- Carlsson, G.; Ishkhanov, T.; de Silva, V.; Zomorodian, A. On the local behaviour of spaces of natural images. Int. J. Comput. Vis. 2008, 76, 1–12. [Google Scholar] [CrossRef]
- Perea, J.A.; Harer, J. Sliding Windows and Persistence: An Application of Topological Methods to Signal Analysis. Found. Comput. Math. 2015, 15, 799–838. [Google Scholar] [CrossRef]
- Pereira, C.M.; de Mello, R.F. Persistent Homology for Time Series and Spatial Data Clustering. Expert Syst. Appl. 2015, 42, 6026–6038. [Google Scholar] [CrossRef]
- Biasotti, S.; De Floriani, L.; Falcidieno, B.; Frosini, P.; Giorgi, D.; Landi, C.; Papaleo, L.; Spagnuolo, M. Describing Shapes by Geometrical-topological Properties of Real Functions. ACM Comput. Surv. 2008, 40, 12:1–12:87. [Google Scholar] [CrossRef]
- Tausz, A.; Vejdemo-Johansson, M.; Adams, H. JavaPlex: A research software package for persistent (co)homology. In Mathematical Software—ICMS 2014; Hong, H., Yap, C., Eds.; Springer: Berlin/Heidelberg, Germany, 2014; pp. 129–136. Available online: http://appliedtopology.github.io/javaplex/ (accessed on 1 March 2017).
Publisher’s Note: MDPI stays neutral with regard to jurisdictional claims in published maps and institutional affiliations. |
© 2018 by the authors. Licensee MDPI, Basel, Switzerland. This article is an open access article distributed under the terms and conditions of the Creative Commons Attribution (CC BY) license (https://creativecommons.org/licenses/by/4.0/).


