UCAmI Cup. Analyzing the UJA Human Activity Recognition Dataset of Activities of Daily Living †


Abstract
:1. Introduction
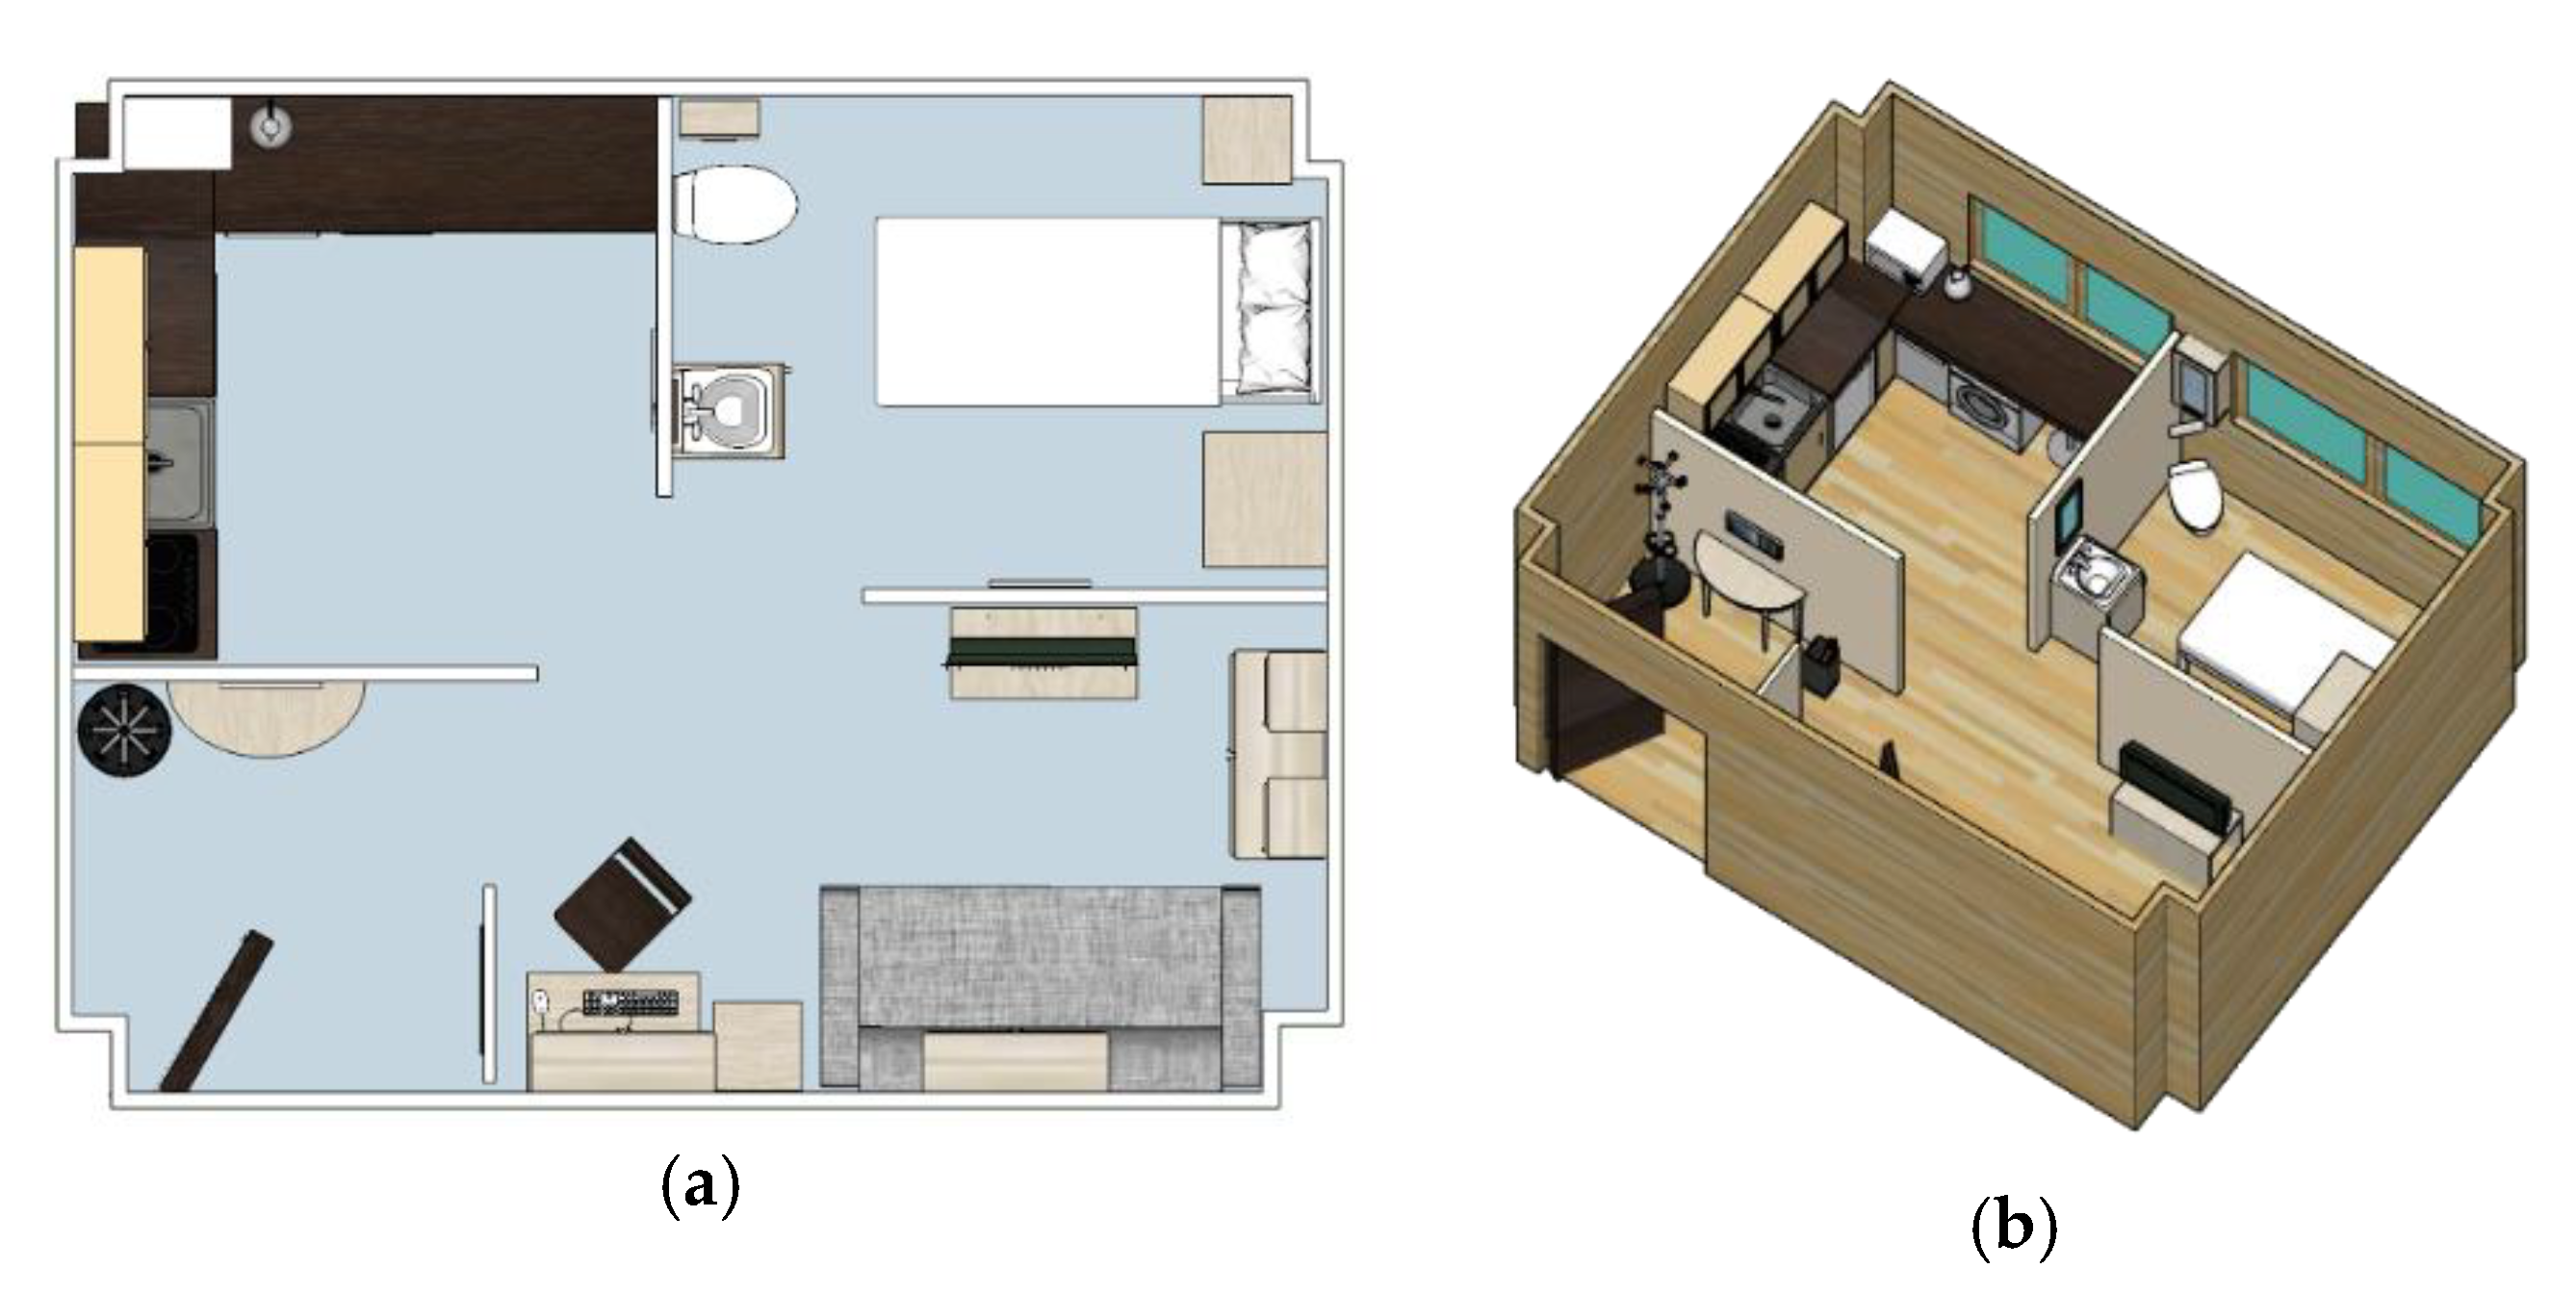
2. UJAmI Smart Lab of the University of Jaén
3. General Description of UJAmI HAR Dataset
- -
- Part 1: Labelled training set with seven days of recordings that contains 169 instances.
- -
- Part 2: Unlabelled test set with three days of recordings that contains 77 instances.
- Event stream generated by 30 binary sensors.
- Proximity information between a smart watch worn by an inhabitant and a set of 15 Bluetooth Low Energy (BLE) beacons deployed in the UJAmI SmartLab.
- Acceleration generated by the smart watch.
- An intelligent floor with 40 modules that provides location data.
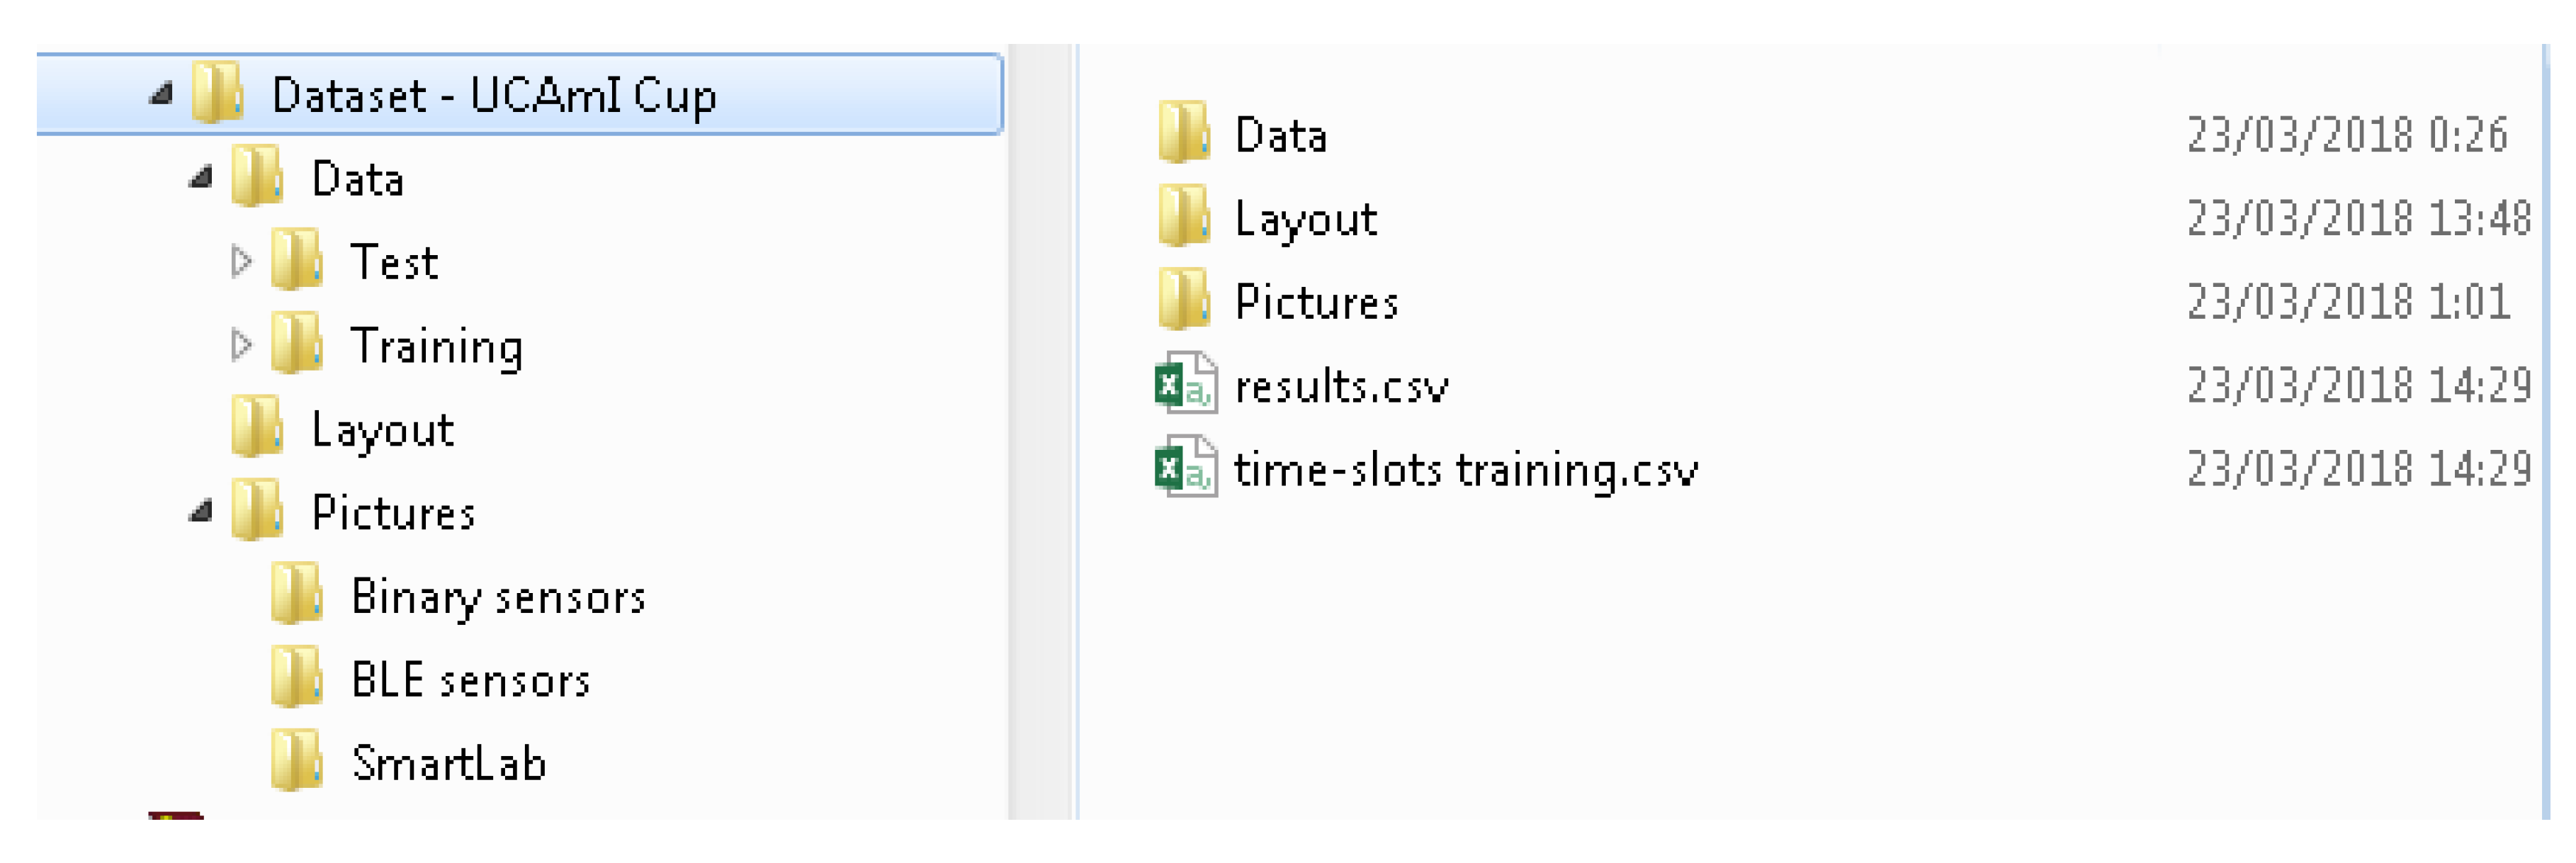
- The Folder named “Pictures” (UCAmI Cup\Pictures\) contains:
- o A folder named “Binary Sensors” with pictures of each binary sensor used for data collection in the UJAmI SmartLab.
- o A folder named “BLE sensor” with pictures of each BLE sensor used in the UJAmI SmartLab during data collection.
- o A folder named “Smart Lab” which contains pictures of each area in the UJAmI SmartLab.
- The Folder named “Layout” (UCAmI Cup\Layout\) contains:
- o A file named “sensors.png” which shows the layout of the UJAmI SmartLab and where each of the binary sensors are located.
- o A file named “proximity.png” which shows the layout of the UJAmI SmartLab and where each of the BLE sensors are located.
- o A file named “Coordinates.docx” which contains a table with the coordinates X and Y of each binary sensor and each BLE sensor in the UJAmI SmartLab.
- o A file named “floor.png” which shows the layout of the smart floor in the UJAmI SmartLab.
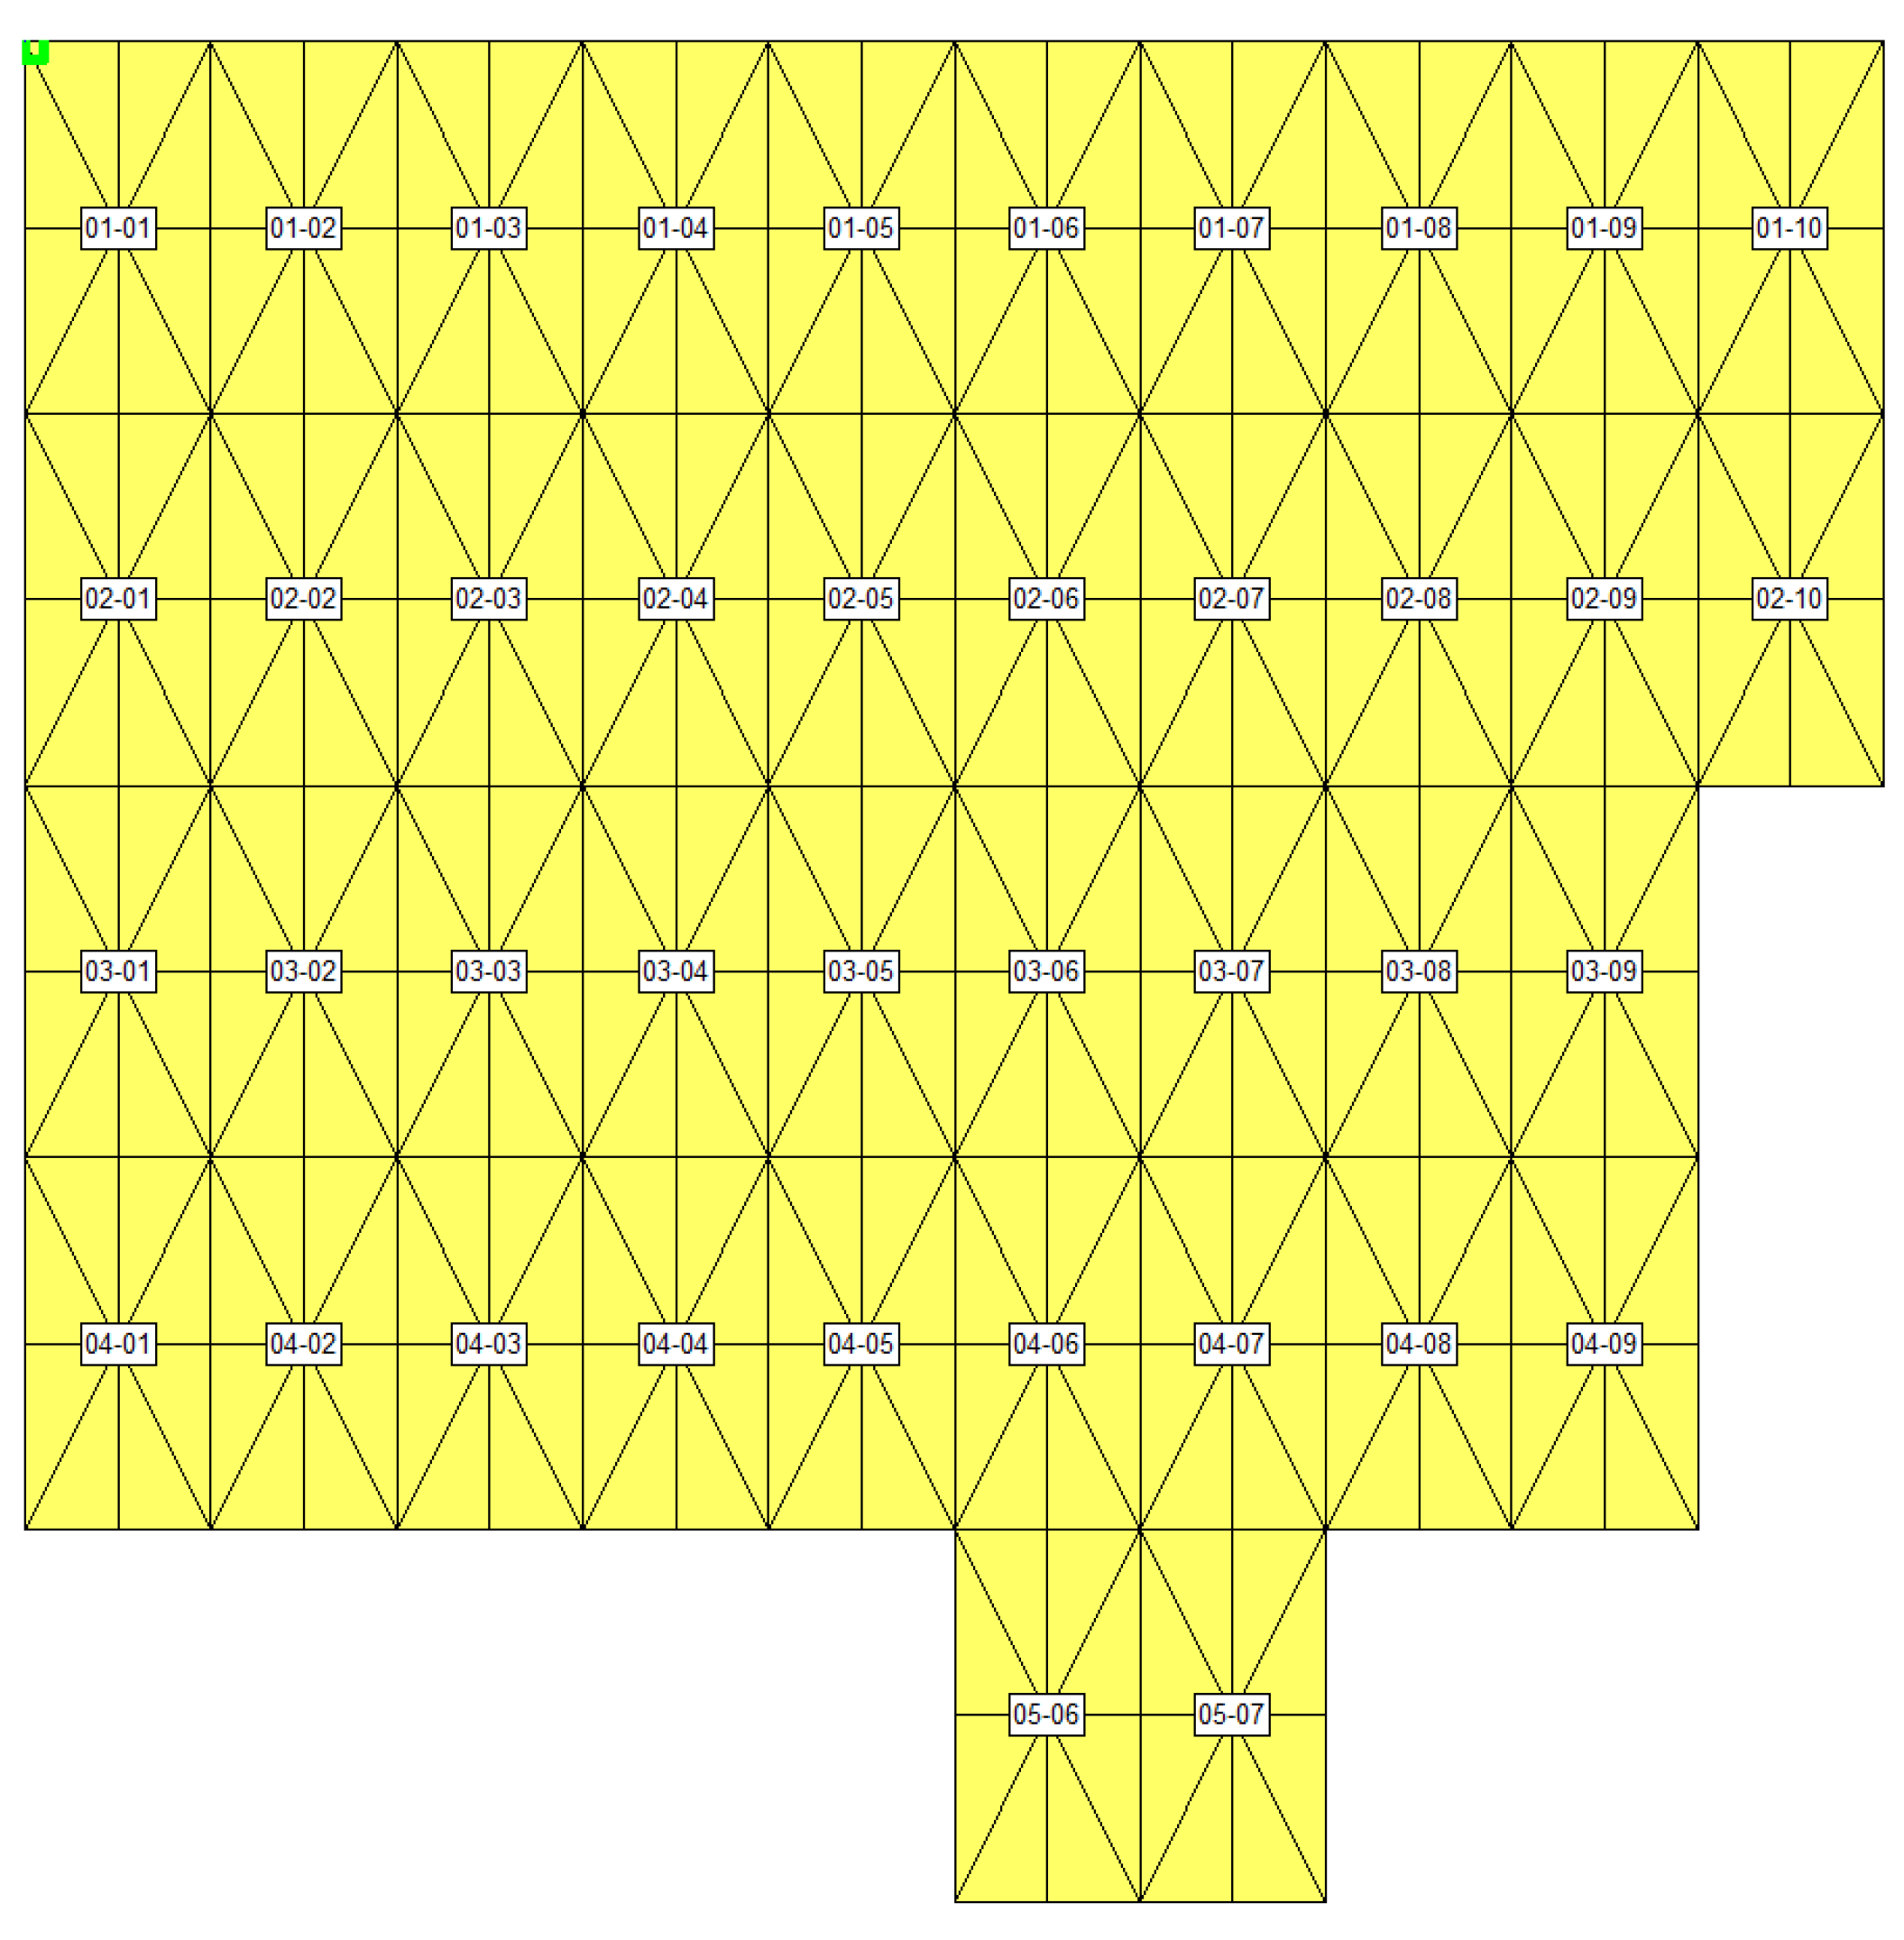
- o A file named “floor-modules.png” which shows the layout of the smart floor in the UJAmI SmartLab with the ID of each module in the layout.
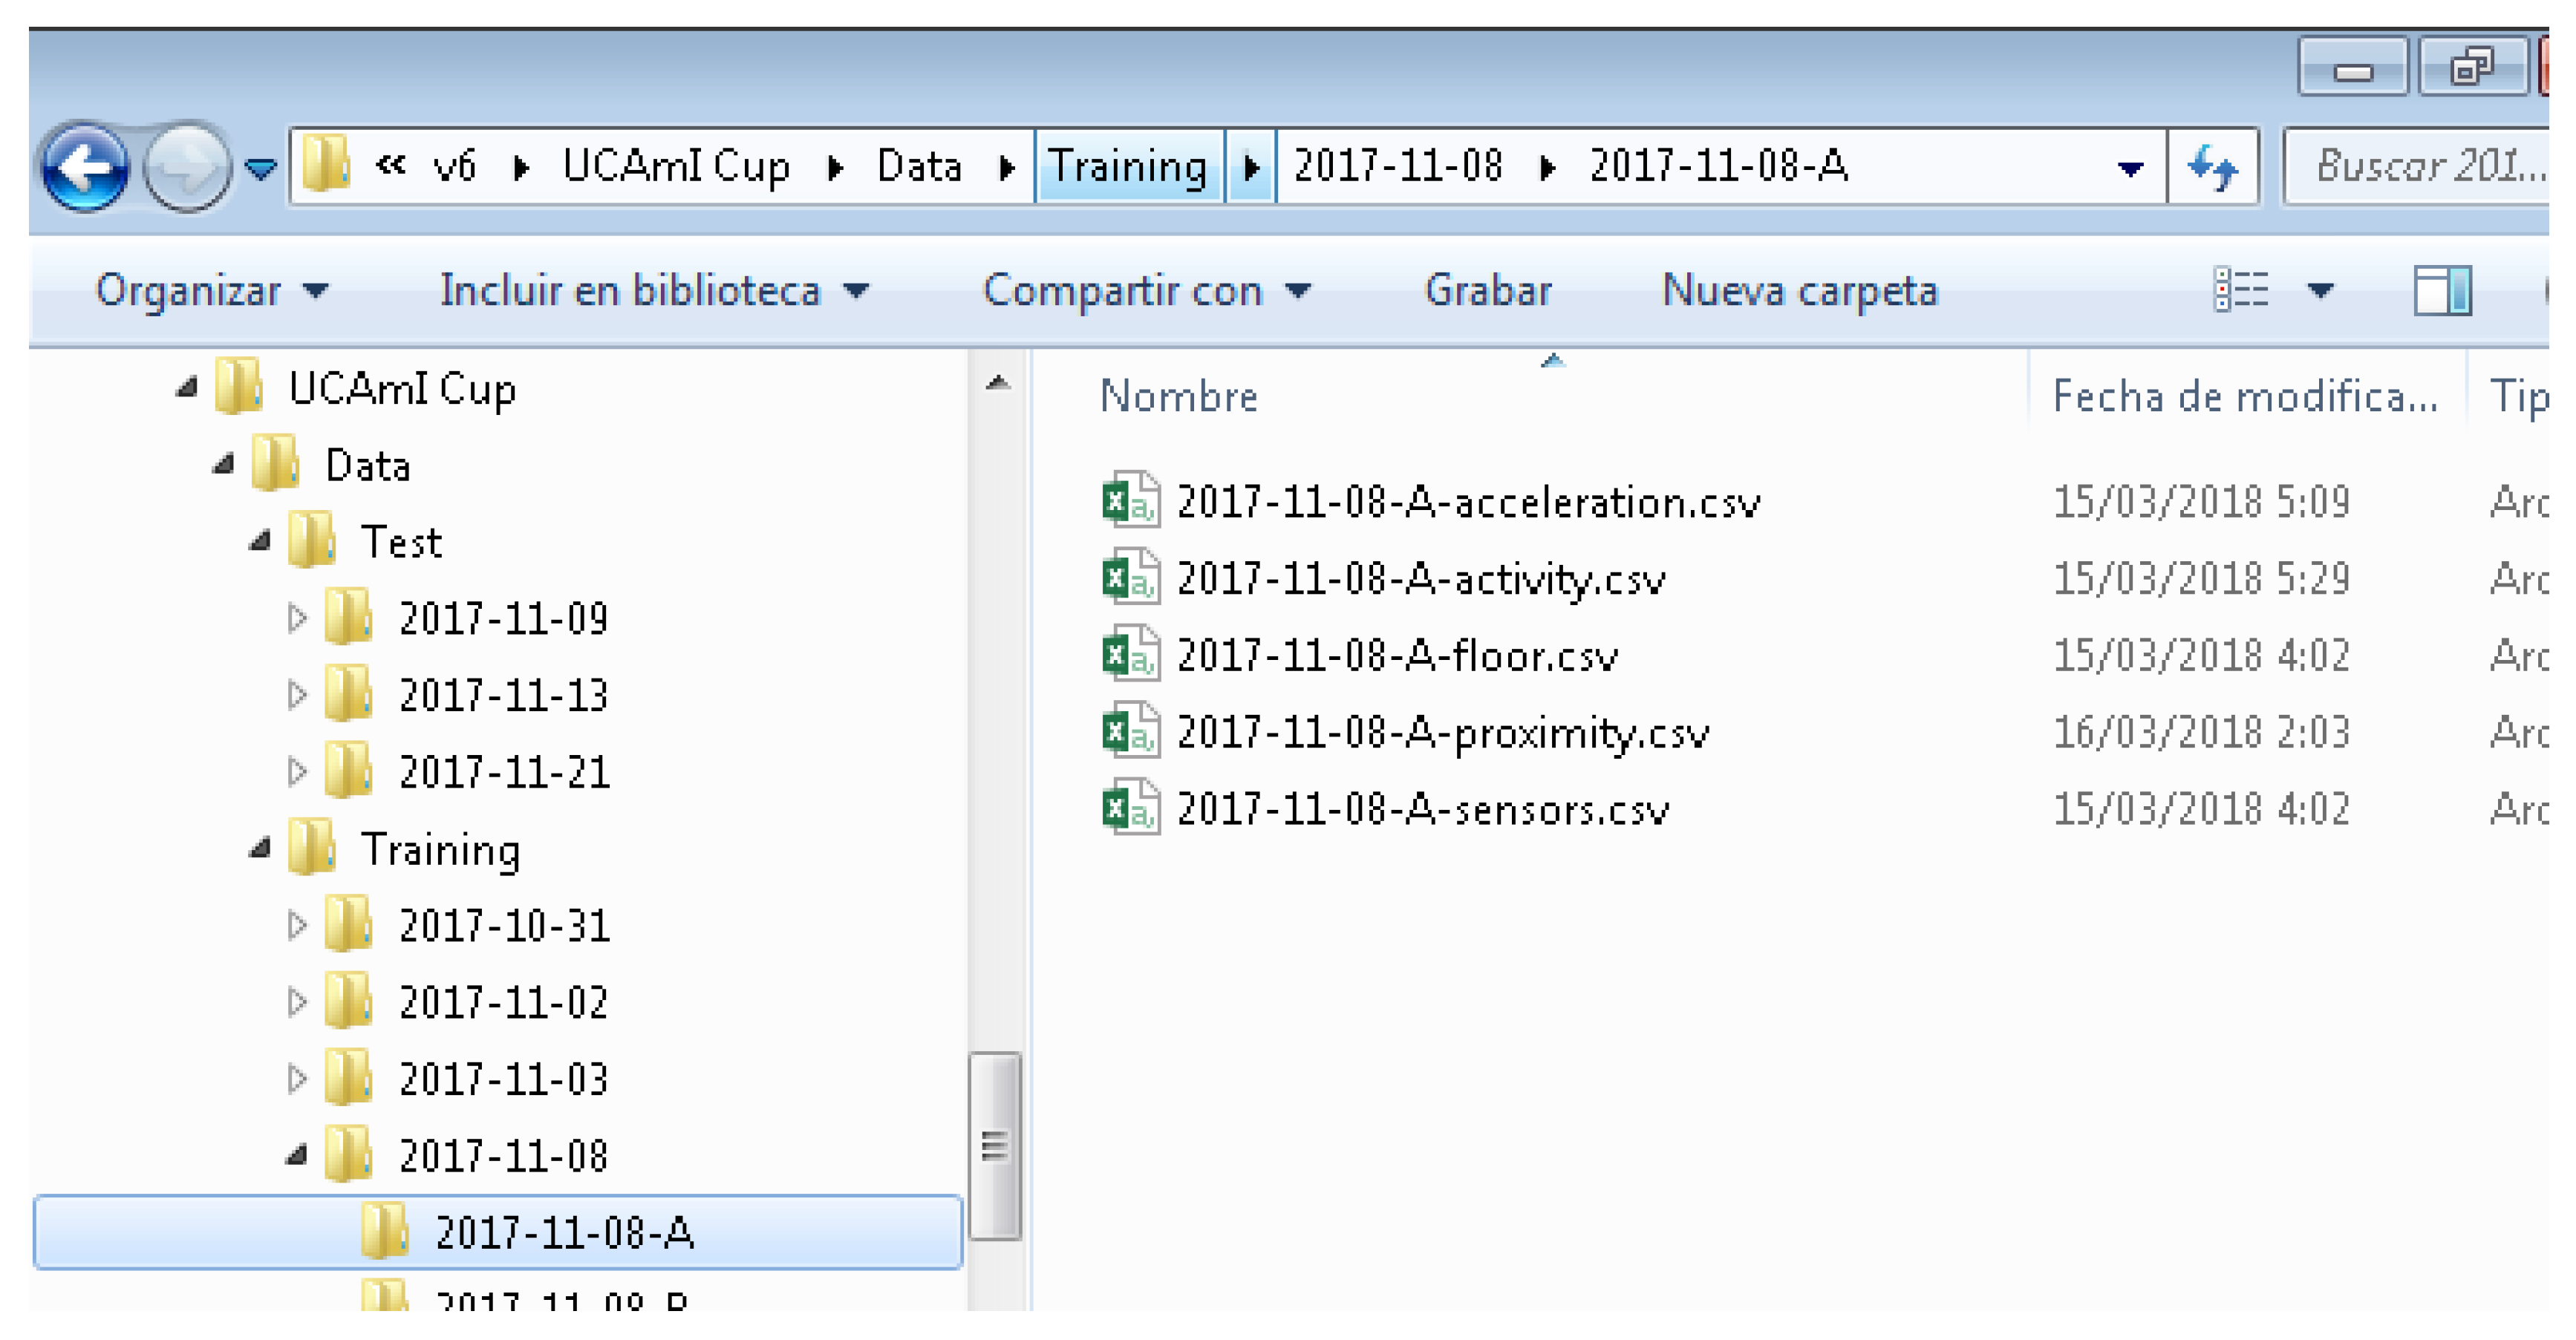
- The Folder named “Data” (UCAmI Cup\Data\) contains 10 days of recordings divided into the following two folders (refer to Figure 3):
- o The Folder named Test contains the data for 3 days and is unlabelled.
- o The Folder named Training contains data for 7 days and is fully labelled.
- DATE BEGIN: Timestamp when the inhabitant starts the activity.
- DATE END: Timestamp when the inhabitant finishes the activity.
- ACTIVITY: Name of the activity carried out by the inhabitant.
- HABITANT: Person that carries out the activity.
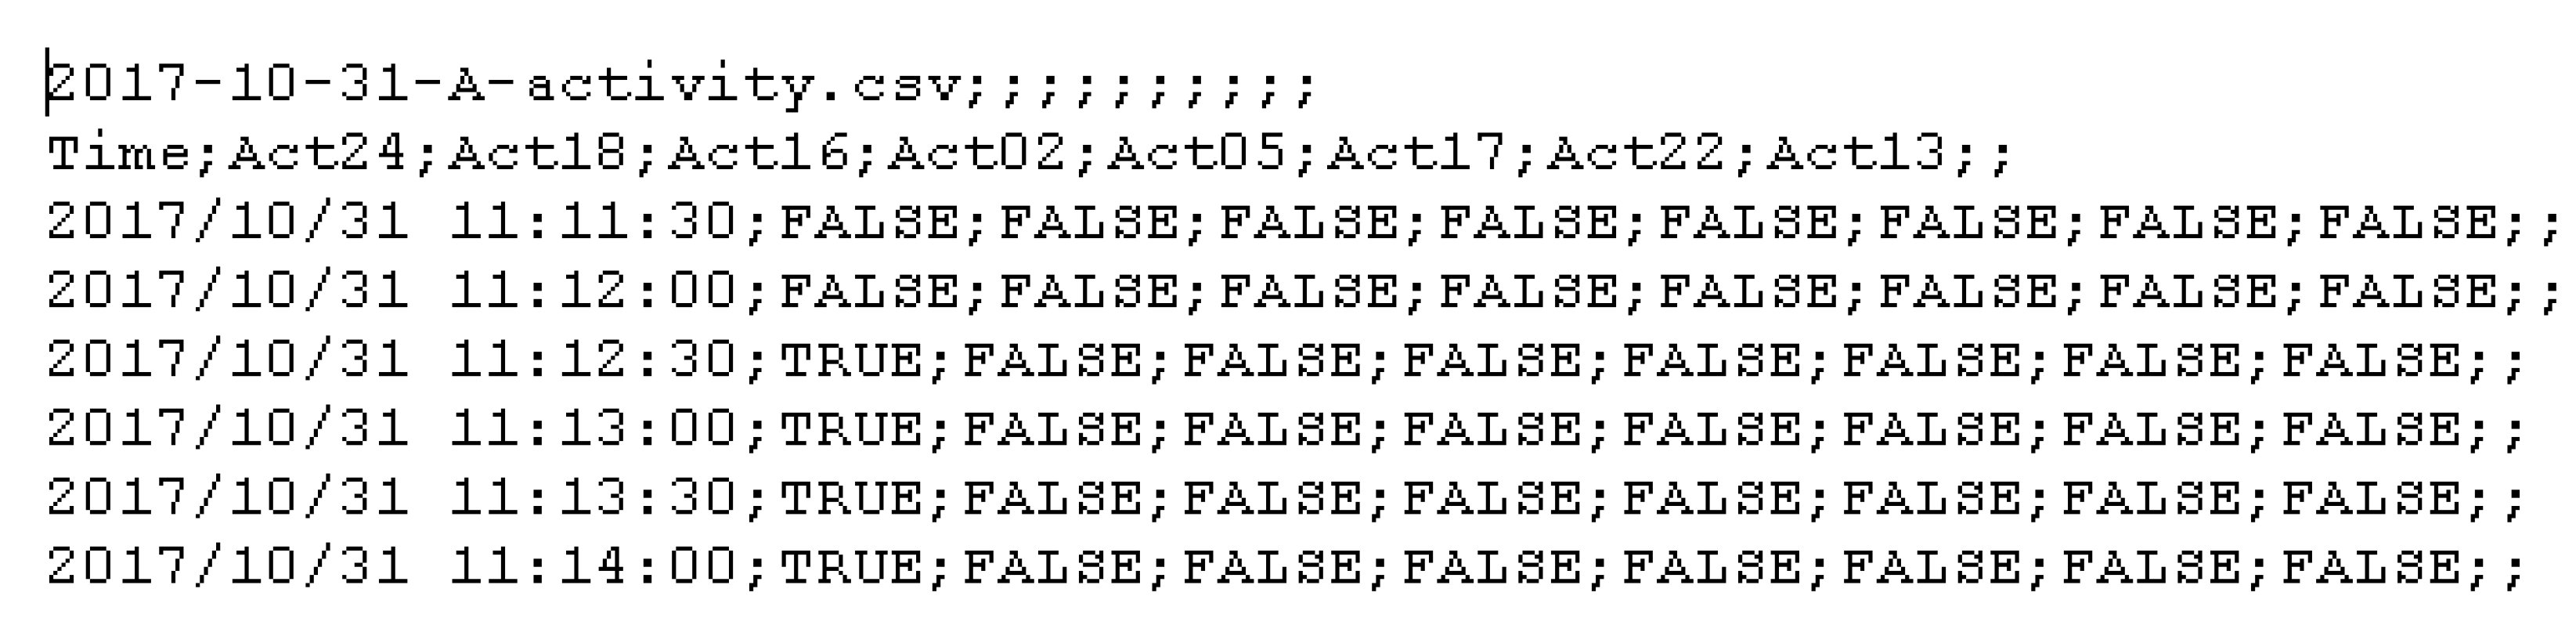
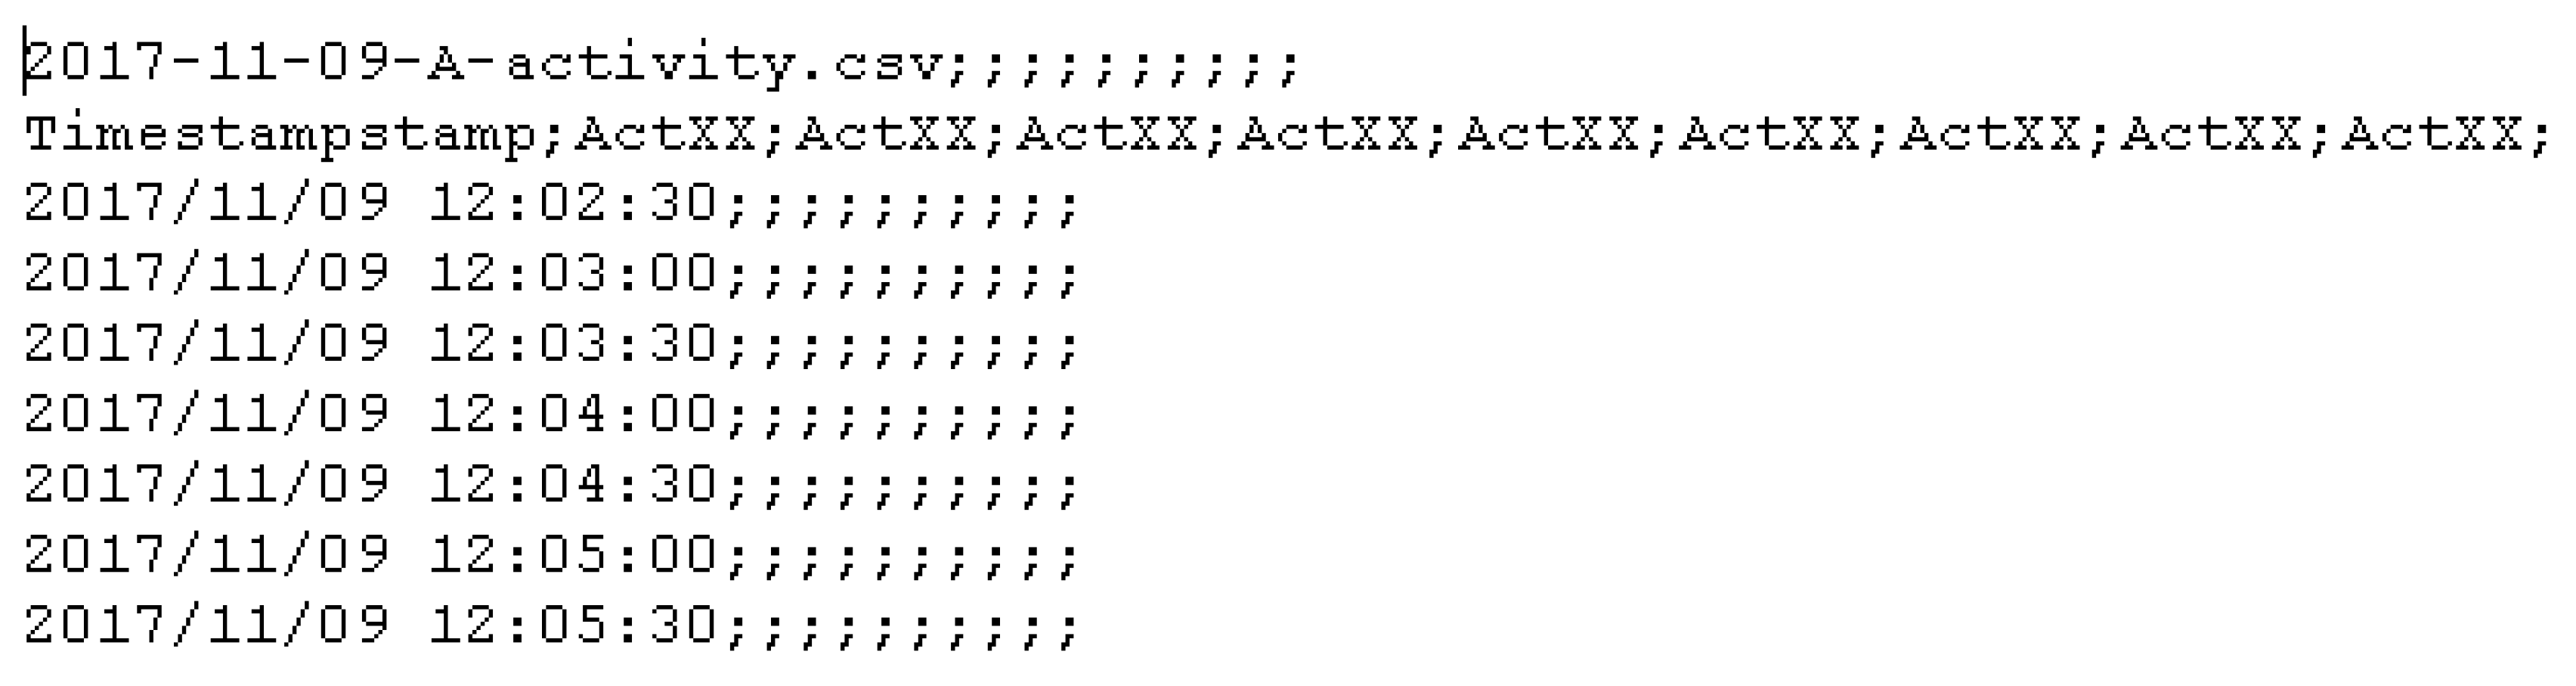
- “time-slots-Training.csv” (UCAmI Cup\time-slots training.csv) contains a csv file which stores the annotations of the activities. This file has 30 s timeslots of the dataset where only the activities that are carried out in this time period are labelled. An excerpt from this file is presented in Figure 7.
- The field named “results.csv” (UCAmI Cup\results.csv) contains a csv file with the timeslots for the test set, however, none of the activities have been labelled. This labelling exercise is to be completed by the participants in the UCAmI Cup. An excerpt from this file is presented in Figure 8.
4. Data Sources of the UJA HAR Dataset
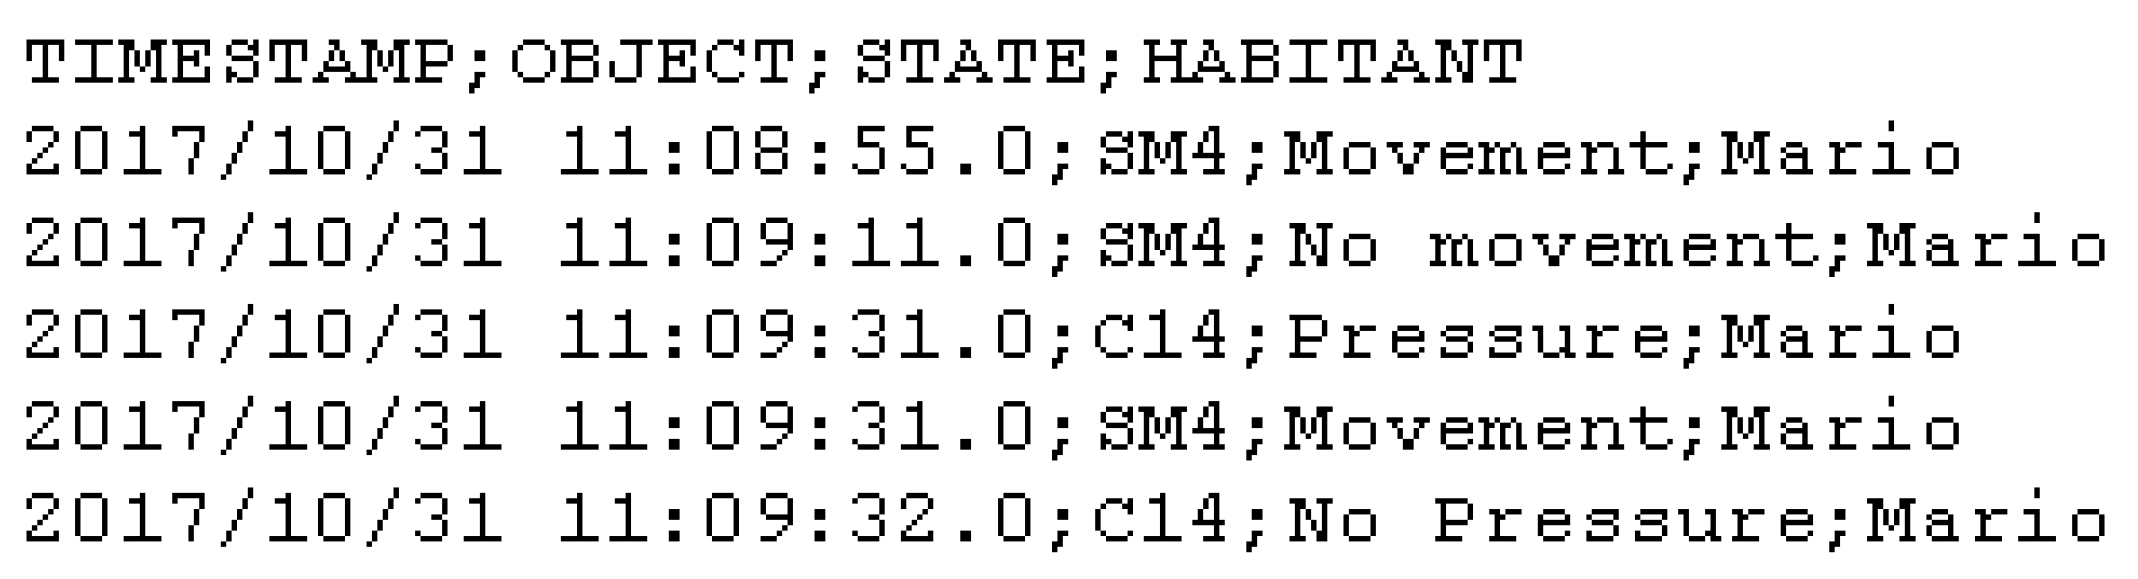
4.1. Binary Sensor Data File
- Magnetic contact. This is a wireless magnetic sensor [21] that works with the Z-Wave protocol. When the sensor detects that the two pieces of the sensor have been separated, the sensor sends an event with a value that represents “open”. When the pieces of the sensor are put back together, the sensor sends an event with a value that represents “close”. In our dataset, this kind of sensor is used for the purposes of tracking the position of doors (open or closed) in addition to placing them in objects that have a fixed place when they are not being used. For example, a TV remote control, medicine box, or bottle of water. In these instances when the value is “close”, it means that the object is not being used, otherwise, when the value is “open”, it means that the object is being used.
- Motion. This is a wireless PIR sensor that works with the ZigBee protocol that is used to detect whether an inhabitant has moved in or out of the sensor’s range. It has a maximum IR detection range of 7 metres with a sample rate of 5 s. When motion is detected the sensor sends a value that represents movement. When the movement ceases, the sensor sends a value that represents no movement.
- Pressure. This is a wireless sensor that works with the Z-Wave protocol that is connected to a textile layer. When pressure is detected in the textile layer the sensor sends a value that represents press. When the pressure ceases, the sensor sends a value that represents no press. Usually, this kind of sensor is used in sofas, chairs or beds.
- TIMESTAMP: This indicates when a sensor sends an event.
- OBJECT: ID of the object associated to the sensor that send the event.
- STATE: Value of the sensor event.
- HABITANT: Person who is performing the activity.
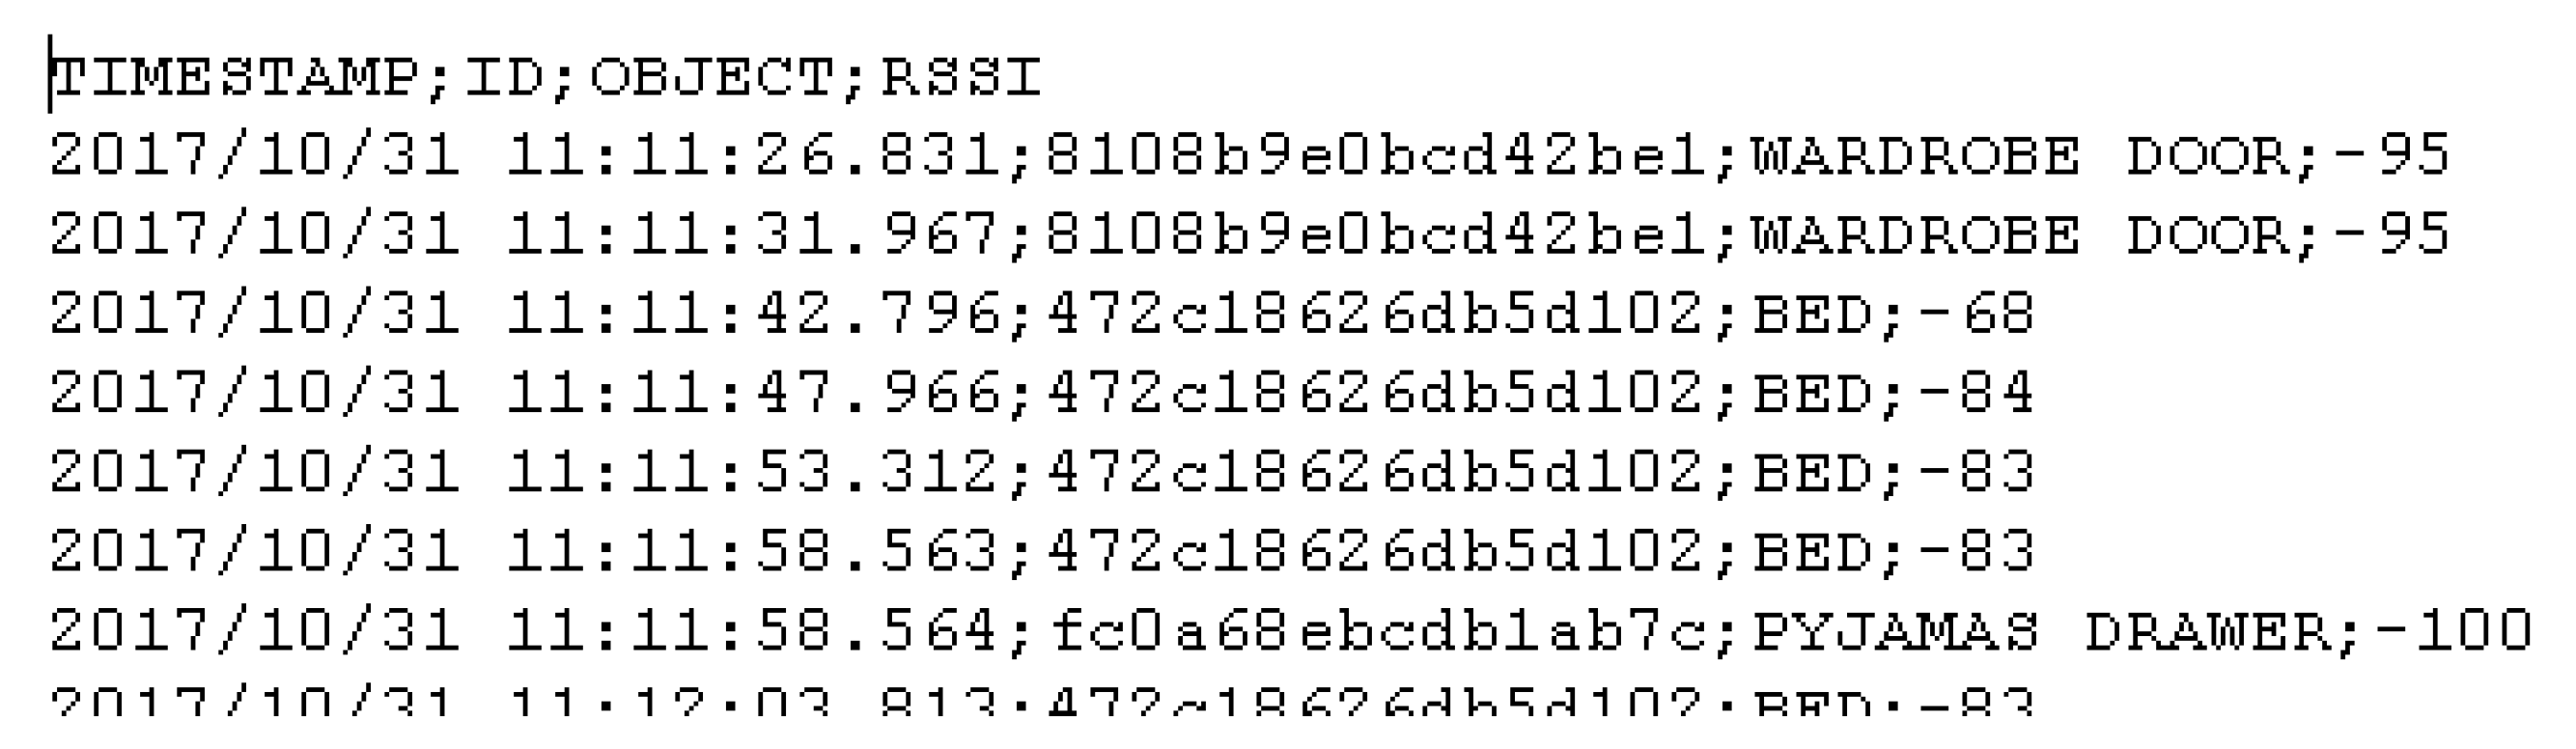
4.2. Proximity Data
- TIMESTAMP: This indicates when the data of a BLE beacon is read.
- ID: Unique identifier of the BLE beacon associated to an object.
- OBJECT: Object where the BLE beacon has been deployed.
- RSSI: RSSI read by the smart watch.
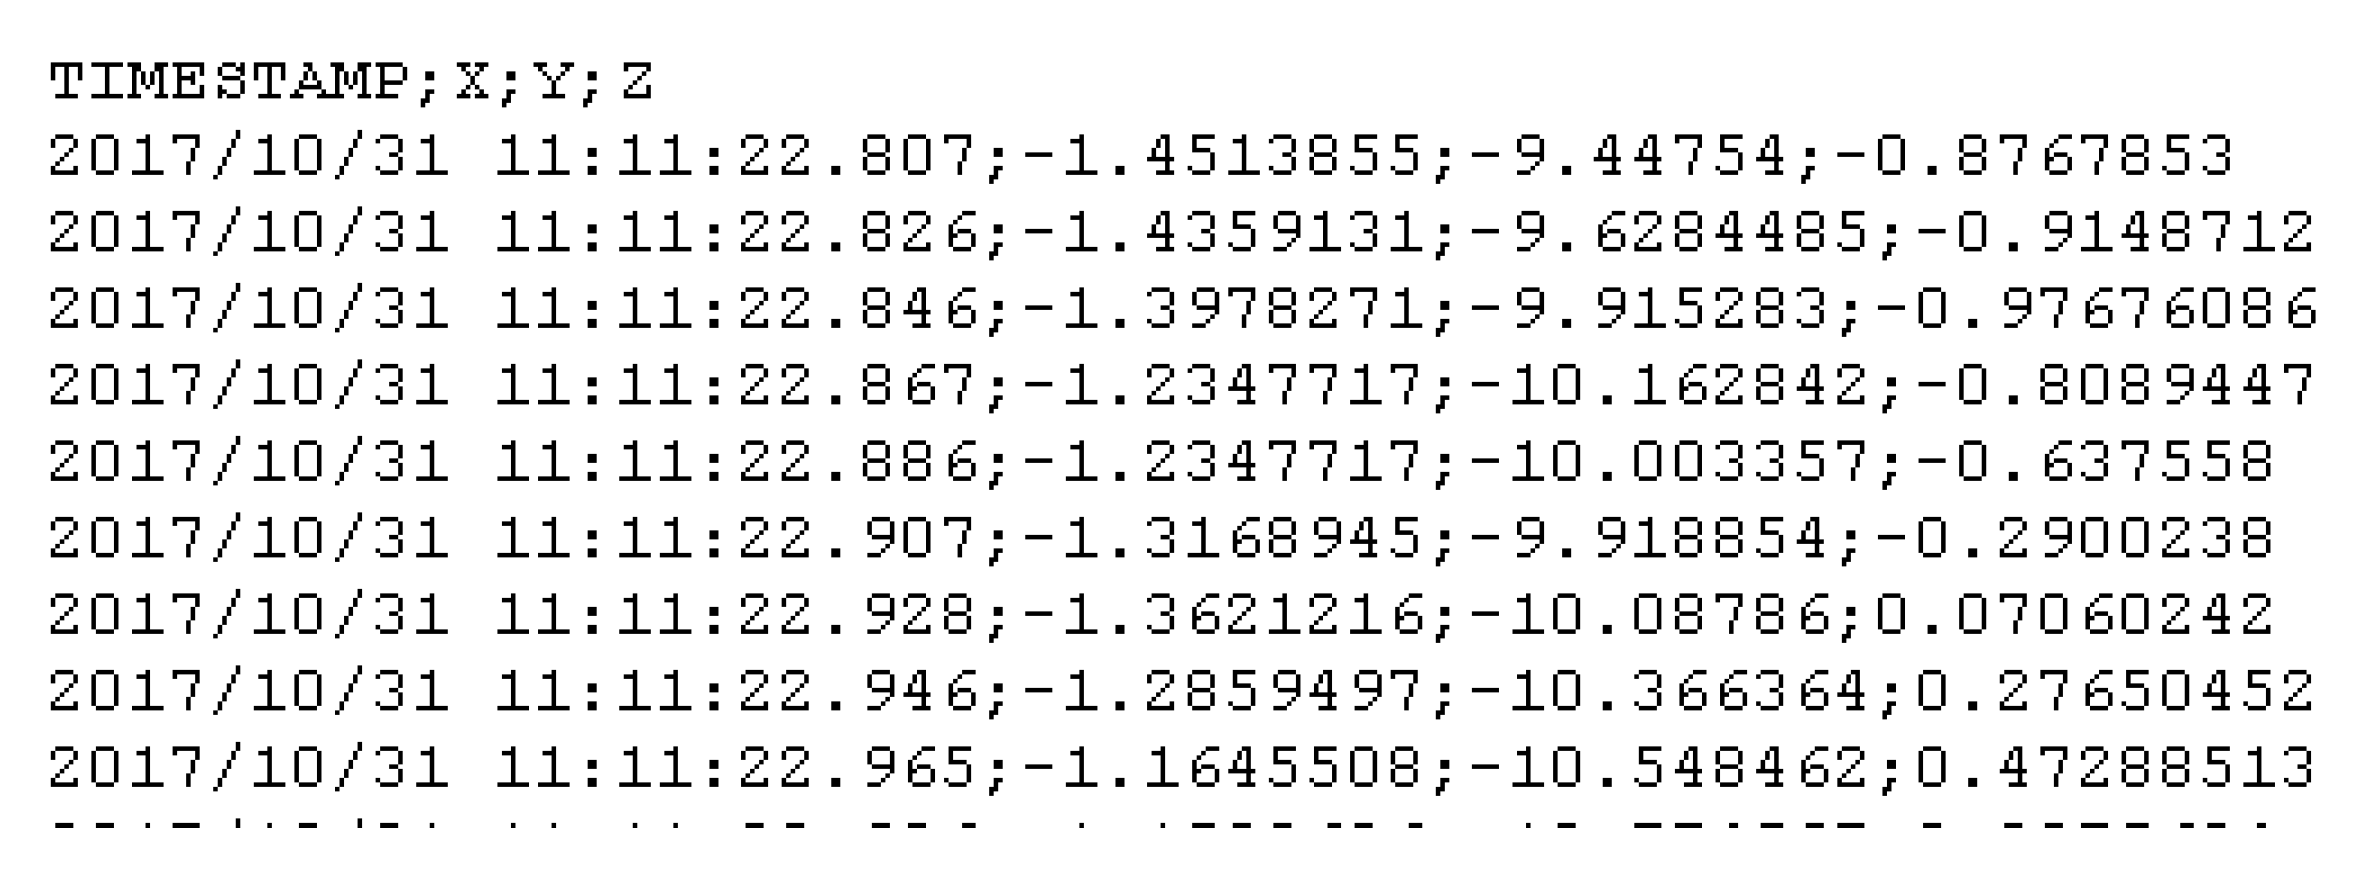
4.3. Acceleration Data
- TIMESTAMP: This indicates when the data is collected.
- X: The acceleration in the x-axis.
- Y: The acceleration in the y-axis.
- Z: The acceleration in the z-axis.
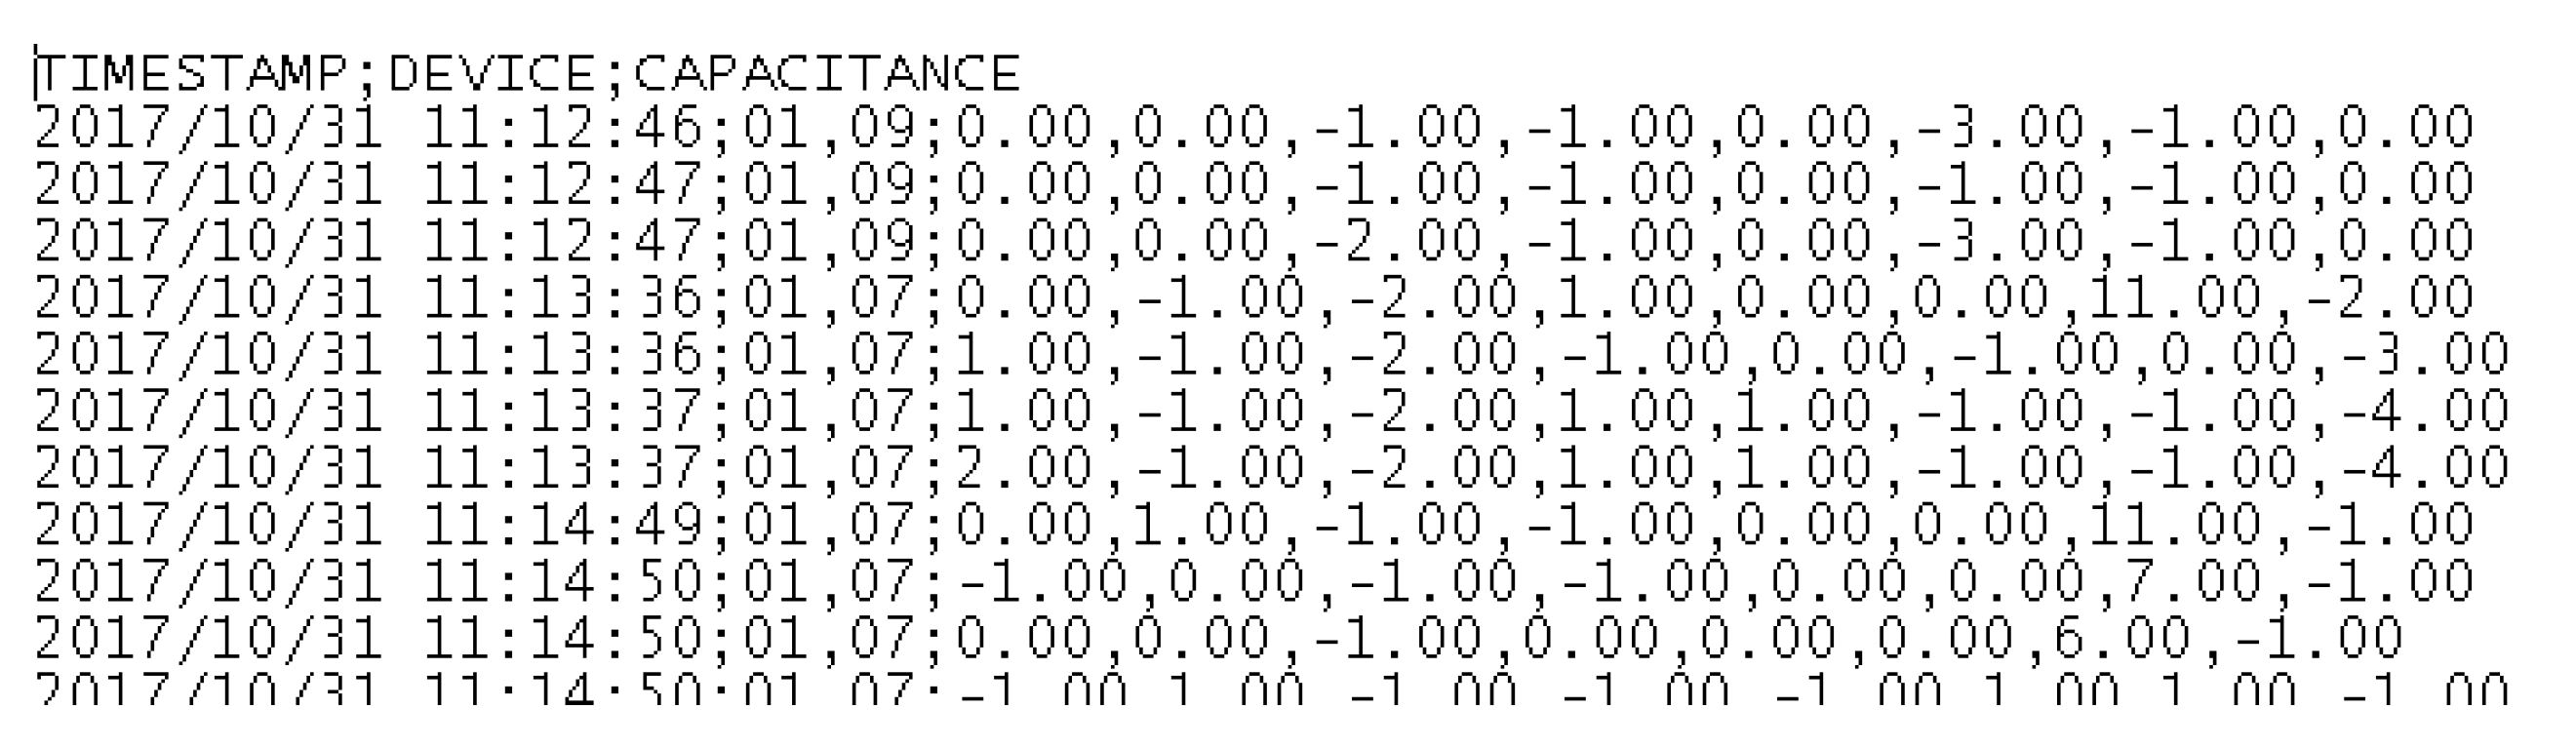
4.4. Floor Capacitance Data
- TIMESTAMP: This indicates when the capacitance data of a module is collected
- DEVICE: Identifies a module, per row and per column of the floor matrix
- CAPACITANCE: Values of the 8 sensors of a module when the capacitances change. The first value is for the sensor with the id-number 1 and the last sensor is with the last sensor with the id-number 8.
5. Competition
6. Conclusions
Supplementary Materials
Author Contributions
Funding
Conflicts of Interest
Abbreviations
| HAR | Human Activity Recognition |
| ADL | Activities of Daily Living |
| UJAmI | University of Jaén Ambient Intelligence |
| UCAmI | Ubiquitous Computing and Ambient Intelligence |
References
- Rashidi, P.; Mihailidis, A. A survey on ambient-assisted living tools for older adults. IEEE J. Biomed. Health Inf. 2013, 17, 579–590. [Google Scholar] [CrossRef] [PubMed]
- Machine Learning Repository. Available online: http://archive.ics.uci.edu/ml/index.php (accessed on 13 August 2018).
- PhysioNet. Available online: https://www.physionet.org/ (accessed on 13 August 2018).
- Chen, L.; Nugent, C.D.; Wang, H. A knowledge-driven approach to activity recognition in smart homes. IEEE Trans. Knowl. Data Eng. 2012, 24, 961–974. [Google Scholar] [CrossRef]
- Sussex-Huawei Locomotion Challenge. Available online: http://www.shl-dataset.org/activity-recognition-challenge/ (accessed on 13 August 2018).
- Indoor Positioning and Indoor Navigation Conference. Available online: http://www.ipin2017.org/ (accessed on 13 August 2018).
- iNaturalist Challenge. Available online: https://www.kaggle.com/c/inaturalist-challenge-at-fgvc-2017 (accessed on 13 August 2018).
- Computing in Cardiology Challenges. Available online: https://www.physionet.org/challenge/ (accessed on 13 August 2018).
- AI Video Competition. Available online: https://ijcai-17.org/competitions.html (accessed on 13 August 2018).
- Data Mining and Knowledge Discovery competition. Available online: http://www.kdd.org/kdd-cup (accessed on 13 August 2018).
- UCAmI Cup. Available online: http://mamilab.esi.uclm.es/ucami2018/UCAmICup.html (accessed on 13 August 2018).
- UJAmI Smart Lab. Available online: http://ceatic.ujaen.es/ujami/en (accessed on 13 August 2018).
- Sagha, H. Benchmarking classification techniques using the opportunity human activity dataset. In Proceedings of the 2011 IEEE International Conference on Systems, Man, and Cybernetics (SMC), Anchorage, AK, USA, 9–12 October 2011; pp. 36–40. [Google Scholar]
- Espinilla, M.; Martínez, L.; Medina, J.; Nugent, C. The Experience of Developing the UJAmI Smart Lab. IEEE Access 2018, 6, 34631–34642. [Google Scholar] [CrossRef]
- Zafra, D.; Medina, J.; Martínez, L.; Nugent, C.; Espinilla, M. A Web System for Managing and Monitoring Smart Environments. In Proceedings of the Bioinformatics and Biomedical Engineering–4th International Conference, IWBBIO, Granada, Spain, 20–22 April 2016; Springer: Berlin, Germany, 2016; Volume 9656, pp. 677–688. [Google Scholar]
- OpenHab. Available online: https://www.openhab.org/ (accessed on 13 August 2018).
- Medina, J.; Martínez, L.; Espinilla, M. Subscribing to fuzzy temporal aggregation of heterogeneous sensor streams in real-time distributed environments. Int. J. Commun. Syst. 2017, 30, 3238. [Google Scholar] [CrossRef]
- Rafferty, J.; Nugent, C.D. A Scalable, Research Oriented, Generic, Sensor Data Platform. IEEE Access 2018. [Google Scholar] [CrossRef]
- McChesney, I.; Nugent, C.; Rafferty, J.; Synnott, J. Exploring an Open Data Initiative ontology for Shareable Smart Environment Experimental Datasets; Lecture Notes in Computer Science (including subseries Lecture Notes in Artificial Intelligence and Lecture Notes in Bioinformatics); 10586 LNCS; Springer: Berlin, Germany, 2017; pp. 400–412. [Google Scholar]
- Wearable Smart Watch Website. Available online: http://www.lg.com/es/wearables/lg-LGW150-g-watch-urbane (accessed on 13 August 2018).
- Everspring Website. Available online: http://www.everspring.com/portfolio-item/sm810-doorwindow-contact-sensor/ (accessed on 13 August 2018).
- Estimote website Available online:. Available online: https://estimote.com/ (accessed on 13 August 2018).
- Android SDK. Available online: https://developer.android.com/reference/android/hardware/SensorManager.html#SENSOR_ACCELEROMETER (accessed on 13 August 2018).
- SensFloor® Available online:. Available online: http://future-shape.com/en/system (accessed on 13 August 2018).
- Dataset 1st UCAmI Cup. Available online: https://drive.google.com/open?id=1Ntu2DfQbHqsCpdHSnXVK6I6eJe7qpffk (accessed on 13 August 2018).


| ID Activity | Name Activity | Freq. | Description |
|---|---|---|---|
| Act01 | Take medication | 7 | This activity involved the inhabitant going to the kitchen, taking some water, removing medication from a box and swallowing the pills. |
| Act02 | Prepare breakfast | 7 | This activity involved the inhabitant going to the kitchen, taking some products for lunch. This activity can involve (i) making a cup of tea with kettle or (ii) making a hot chocolate drink with milk in the microwave. This activity involves placing things to eat in the dining room, but not sitting down to eat. |
| Act03 | Prepare lunch | 6 | This activity involved the inhabitant going to the kitchen, and taking some products from the refrigerator and pantry. This activity can involve (i) preparing a plate of hot food on the fire, for example pasta or (ii) heating a precooked dish in the microwave.This activity also involves placing things to eat in the dining room, but not sitting down to eat. |
| Act04 | Prepare dinner | 7 | This activity involved the inhabitant going to the kitchen, and taking some products from the refrigerator and pantry. This activity can involve (i) preparing a plate of hot food on the fire, for example pasta or (ii) heating a precooked dish in the microwave.This activity also involves placing things to eat in the dining room, but not sitting down to eat. |
| Act05 | Breakfast | 7 | This activity involved the inhabitant going to the dining room in the kitchen in the morning and sitting down to eat. When the inhabitant finishes eating, they place the utensils in the sink or in the dishwasher. |
| Act06 | Lunch | 6 | This activity involved the inhabitant going to the dining room in the kitchen in the afternoon and sitting down to eat. When the inhabitant finishes eating, he places the utensils in the sink or in the dishwasher. |
| Act07 | Dinner | 7 | This activity involved the inhabitant going to the dining room in the kitchen in the evening and sitting down to eat. When the inhabitant finishes eating, they place the utensils in the sink or in the dishwasher. |
| Act08 | Eat a snack | 5 | This activity involved the inhabitant going to the kitchen to take fruit or a snack, and to eat it in the kitchen or in the living room. This activity can imply that the utensils are placed in the sink or in the dishwasher. |
| Act09 | Watch TV | 6 | This activity involved the inhabitant going to the living room, taking the remote control, sitting down on the sofa and when he was finished, the remote control was left close to the TV. |
| Act10 | Enter the SmartLab | 12 | This activity involved the inhabitant entering the SmartLab through the entrance at the main door and putting the keys into a small basket. |
| Act11 | Play a videogame | 1 | This activity involved the inhabitant going to the living room, taking the remote controls of the TV and XBOX, and sitting on the sofa. When the inhabitant finishes playing, he gets up from the sofa and places the controls near the TV. |
| Act12 | Relax on the sofa | 1 | This activity involved the inhabitant going to the living room, sitting on the sofa and after several minutes, getting up off the sofa. |
| Act13 | Leave the SmarLab | 9 | This activity involved the inhabitant going to the entrance, opening the main door and leaving the SmartLab, then closing the main door. |
| Act14 | Visit in the SmartLab | 1 | This activity involved the inhabitant going to the entrance, opening the main door, chatting with someone at the main door, and then closing the door. |
| Act15 | Put waste in the bin | 11 | This activity involved the inhabitant going to the kitchen, picking up the waste, then taking the keys from a small basket in the entrance and exiting the SmartLab. Usually, the inhabitant comes back after around 2 min, leaving the keys back in the small basket. |
| Act16 | Wash hands | 6 | This activity involved the inhabitant going to the bathroom, opening/closing the tap, lathering his hands, and then rinsing and drying them. |
| Act17 | Brush teeth | 21 | This activity involved the inhabitant going to the bathroom and brushing his teeth and opening/closing the tap. |
| Act18 | Use the toilet | 10 | This activity involved the inhabitant going to the bathroom and using the toilet, opening/closing the toilet lid and pulling the cistern. |
| Act19 | Wash dishes | 2 | This activity involved the inhabitant going to the kitchen and placing the dirty dishes in the dishwasher, and then placing the dishes back in the right place. |
| Act20 | Put washing into the washing machine | 6 | This activity involved the inhabitant going to the bedroom, picking up the laundry basket, going to the kitchen, putting clothes in the washing machine, waiting around 20 min and then taking the clothes out of the washing machine and placing them in the bedroom closet. |
| Act21 | Work at the table | 2 | This activity involved the inhabitant going to the workplace, sitting down, doing work, and finally, getting up. |
| Act22 | Dressing | 15 | This activity involved the inhabitant going to the bedroom, putting dirty clothes in the laundry basket, opening the closet, putting on clean clothes and then closing the closet. |
| Act23 | Go to the bed | 7 | This activity involved the inhabitant going to the bedroom, lying in bed and sleeping. This activity is terminated once the inhabitant stays 1 min in bed. |
| Act24 | Wake up | 7 | This activity involved the inhabitant getting up and out of the bed. |
| ID | OBJECT | X | Y | Type | STATE 1 | STATE 2 |
|---|---|---|---|---|---|---|
| M01 | Door | 450 | 460 | Contact | Open | Close |
| TV0 | TV | 119 | 252 | Contact | Open | Close |
| SM1 | Motion sensor–Kitchen | 580 | 260 | Motion | Movement | No movement |
| SM3 | Motion sensor–bathroom | 270 | 128 | Motion | Movement | No movement |
| SM4 | Motion sensor–bedroom | 146 | 0 | Motion | Movement | No movement |
| SM5 | Motion sensor–sofa | 164 | 249 | Motion | Movement | No movement |
| D01 | Refrigerator | 510 | 144 | Contact | Open | Close |
| D02 | Microwave | 480 | 37 | Contact | Open | Close |
| D03 | Wardrobe | 59 | 169 | Contact | Open | Close |
| D04 | Cupboard cups | 546 | 104 | Contact | Open | Close |
| D05 | Dishwasher | 487 | 63 | Contact | Open | Close |
| D07 | Top WC | 254 | 56 | Contact | Open | Close |
| D08 | Closet | 546 | 194 | Contact | Open | Close |
| D09 | Washing machine | 408 | 63 | Contact | Open | Close |
| D10 | Pantry | 546 | 149 | Contact | Open | Close |
| H01 | Kettle | 467 | 24 | Contact | Open | Close |
| C01 | Medication box | 471 | 0 | Contact | Open | Close |
| C02 | Fruit platter | 434 | 0 | Contact | Open | Close |
| C03 | Cutlery | 515 | 116 | Contact | Open | Close |
| C04 | Pots | 515 | 116 | Contact | Open | Close |
| ID | OBJECT | X | Y | Type | STATE 1 | STATE 2 |
| C05 | Water bottle | 567 | 170 | Contact | Open | Close |
| C07 | Remote XBOX | 117 | 252 | Contact | Present | No present |
| C08 | Trash | 489 | 233 | Contact | Open | Close |
| C09 | Tap | 306 | 107 | Contact | Open | Close |
| C10 | Tank | 310 | 44 | Contact | Open | Close |
| C12 | Laundry basket | 461 | 63 | Contact | Present | No present |
| C13 | Pyjamas drawer | 59 | 169 | Contact | Open | Close |
| C14 | Bed | 140 | 94 | Pressure | Pressure | No Pressure |
| C15 | Kitchen faucet | 558 | 98 | Contact | Open | Close |
| S09 | Pressure sofa | 130 | 407 | Pressure | No Pressure | No Pressure |
| Name | Broadcasting Power (dB) |
|---|---|
| 1–TV controller | −12 |
| 2–Book | −12 |
| 3–Entrance door | −12 |
| 4–Medicine box | −16 |
| 5–Food cupboard | −12 |
| 6–Fridge | −12 |
| 7–Pot drawer | −12 |
| 8–Water bottle | −12 |
| 9–Garbage can | −12 |
| 10–Wardrobe door | −12 |
| 11–Pyjama drawer | −12 |
| 12–Bed | −12 |
| 13–Bathroom tap | −12 |
| 14–Toothbrush | −16 |
| 15–Laundry basket | −12 |
Publisher’s Note: MDPI stays neutral with regard to jurisdictional claims in published maps and institutional affiliations. |
© 2018 by the authors. Licensee MDPI, Basel, Switzerland. This article is an open access article distributed under the terms and conditions of the Creative Commons Attribution (CC BY) license (https://creativecommons.org/licenses/by/4.0/).
Share and Cite
Espinilla, M.; Medina, J.; Nugent, C. UCAmI Cup. Analyzing the UJA Human Activity Recognition Dataset of Activities of Daily Living. Proceedings 2018, 2, 1267. https://doi.org/10.3390/proceedings2191267
Espinilla M, Medina J, Nugent C. UCAmI Cup. Analyzing the UJA Human Activity Recognition Dataset of Activities of Daily Living. Proceedings. 2018; 2(19):1267. https://doi.org/10.3390/proceedings2191267
Chicago/Turabian StyleEspinilla, Macarena, Javier Medina, and Chris Nugent. 2018. "UCAmI Cup. Analyzing the UJA Human Activity Recognition Dataset of Activities of Daily Living" Proceedings 2, no. 19: 1267. https://doi.org/10.3390/proceedings2191267
APA StyleEspinilla, M., Medina, J., & Nugent, C. (2018). UCAmI Cup. Analyzing the UJA Human Activity Recognition Dataset of Activities of Daily Living. Proceedings, 2(19), 1267. https://doi.org/10.3390/proceedings2191267