Proceeding Paper

Intelligent Power Management System Using Hybrid Renewable Energy Resources and Decision Tree Approach †

by
Francisco-Javier Ferrández-Pastor
*,
Sergio Gómez-Trillo
,
Mario Nieto-Hidalgo
,
Juan-Manuel García-Chamizo
and
Rafael Valdivieso-Sarabia
Computing Technology and Data Processing Department, University of Alicante, Ctra San Vicente del Raspeig, s/n, San Vicente del Raspeig, 03690 Alicante, Spain
*
Author to whom correspondence should be addressed.
Presented at the 12th International Conference on Ubiquitous Computing and Ambient Intelligence (UCAmI 2018), Punta Cana, Dominican Republic, 4–7 December 2018.
These authors contributed equally to this work.
Proceedings 2018, 2(19), 1239; https://doi.org/10.3390/proceedings2191239
Published: 19 October 2018
(This article belongs to the Proceedings of UCAmI 2018)

Abstract

:
Optimal power usage and consumption require continuous monitoring, forecasting electric energy consumption and renewable generation. To facilitate integration of renewable energies and optimize their resources, new communication and data processing technologies are used in new projects. This article shows the works and results obtained in the eoTICC project. The objective is to design and develop an intelligent energy manager using the Archimedes wind turbine and a solar generation system, both integrated in industrial and residential power facilities. Solutions based on Artificial Intelligence paradigms and Internet of Things protocols allow automatic decision making to optimize energy management. In a facility, the energy demand and weather forecasts can be known by an intelligent energy manager. With these conditions, the energy manager can develop rules based on decision trees to automate control actions aimed at optimizing the use of energy. This article shows the architecture of IoT infrastructure and the first rules designed in the project. The result obtained provides improvements in the use of renewable energy in current facilities that do not use this type of intelligent management. The improvements allow to use the energy at the time of generation, avoiding unnecessary storage.

1. Introduction

The energy sustainability of urban models is currently one of the major challenges. The vast majority of the buildings have been designed under structural, economic criteria or standards of habitability and functionality, leaving aside its ability to produce enough power to meet the demand of users. The current advances in Microgeneration technology and the different techniques for the rationalization of energy consumption, makes it possible to future buildings to reach a proper balance. EoTICC project develops an IoT infrastructure to optimize power management in domestic and industrial facilities that use power supplier, wind and solar generation. Figure 1 shows power consumption and IoT model used in this work.
The Internet Network was originally designed in a client-server model, where the client was always the initiator of the request. Devices initiate the communication whenever they need to push data to the cloud. In IoT applications the server needs to push data to a client without the client first making a request. Software developers have come up with some techniques to overcome this challenge. In this work, adapted protocols are used to optimize communication services [1].
IoT needs protocols adapted to the new requirements. Traditional protocols are extended and new protocols are proposed offering different options on different contexts. IoT has now a wide range of applications. In [2] a review and comparison of different communication protocols in IoT is realised. This comparison aims at presenting guidelines for the researchers to be able to select the right protocol for different applications. Choosing the most appropriate protocol depends on several facts of which most important are: environmental conditions, network characteristics, the amount of data to be transferred, security levels and quality of service requests [3]. MQTT is a machine-to-machine (M2M)/“Internet of Things” connectivity protocol. It was designed as an extremely lightweight publish/subscribe messaging transport. It is useful for connections with remote locations where a small code footprint is required and/or network bandwidth is at a premium.
For example, it has been used in sensors communicating to a broker via satellite link, over occasional dial-up connections with healthcare providers, and in a range of home automation and small device scenarios. It is also ideal for mobile applications because of its small size, low power usage, minimised data packets, and efficient distribution of information to one or many receivers [4]. MQTT is a many-to-many communication protocol for exchanging messages between multiple clients, it is a protocol suitable for this project. In different works [5,6,7] Message Queuing Telemetry Transport (MQTT) protocol is proposed as communication paradigm between sensors, actuators, communication nodes, devices and subsystems. Energy usage prediction plays an important role in building energy management and storage. Building energy prediction contributes significantly in global energy saving as it can help us to evaluate the building energy efficiency.
Artificial Intelligence (AI) based methods are popular owing to its ease of use and high level of accuracy. In [8,9] recent developments in the AI-based approaches for build energy used prediction are discussed. This paper conducts an in-depth review of single AI-based methods such as multiple linear regression, artificial neural networks, and support vector regression, and ensemble prediction method that, by combining multiple single AI-based prediction models improves the prediction accuracy. In [10] energy consumption in houses is discussed and an AI solution is proposed to provide robust energy allocation. Robust linear programming is implemented. A scenario-based approach is implemented to face this robust optimization problem.
Pattern recognition paradigm is used in [11] to obtain disaggregated power consumption interpreting human activity. Non-intrusive load monitoring, design based on Wavelet Transform (WT) processing and Field Programmable Gate Arrays hardware (FPGA). Human activity is classified using Hidden Markov models (HMM). In [12] proposed a system that can automatically achieve energy management by controlling electric appliances.
Other work [13] presents a system that has the capability to deduce human activities from appliances being used and the variation of their states using IoT paradigm. Finally in [14] a study of power management techniques for Internet of Things.

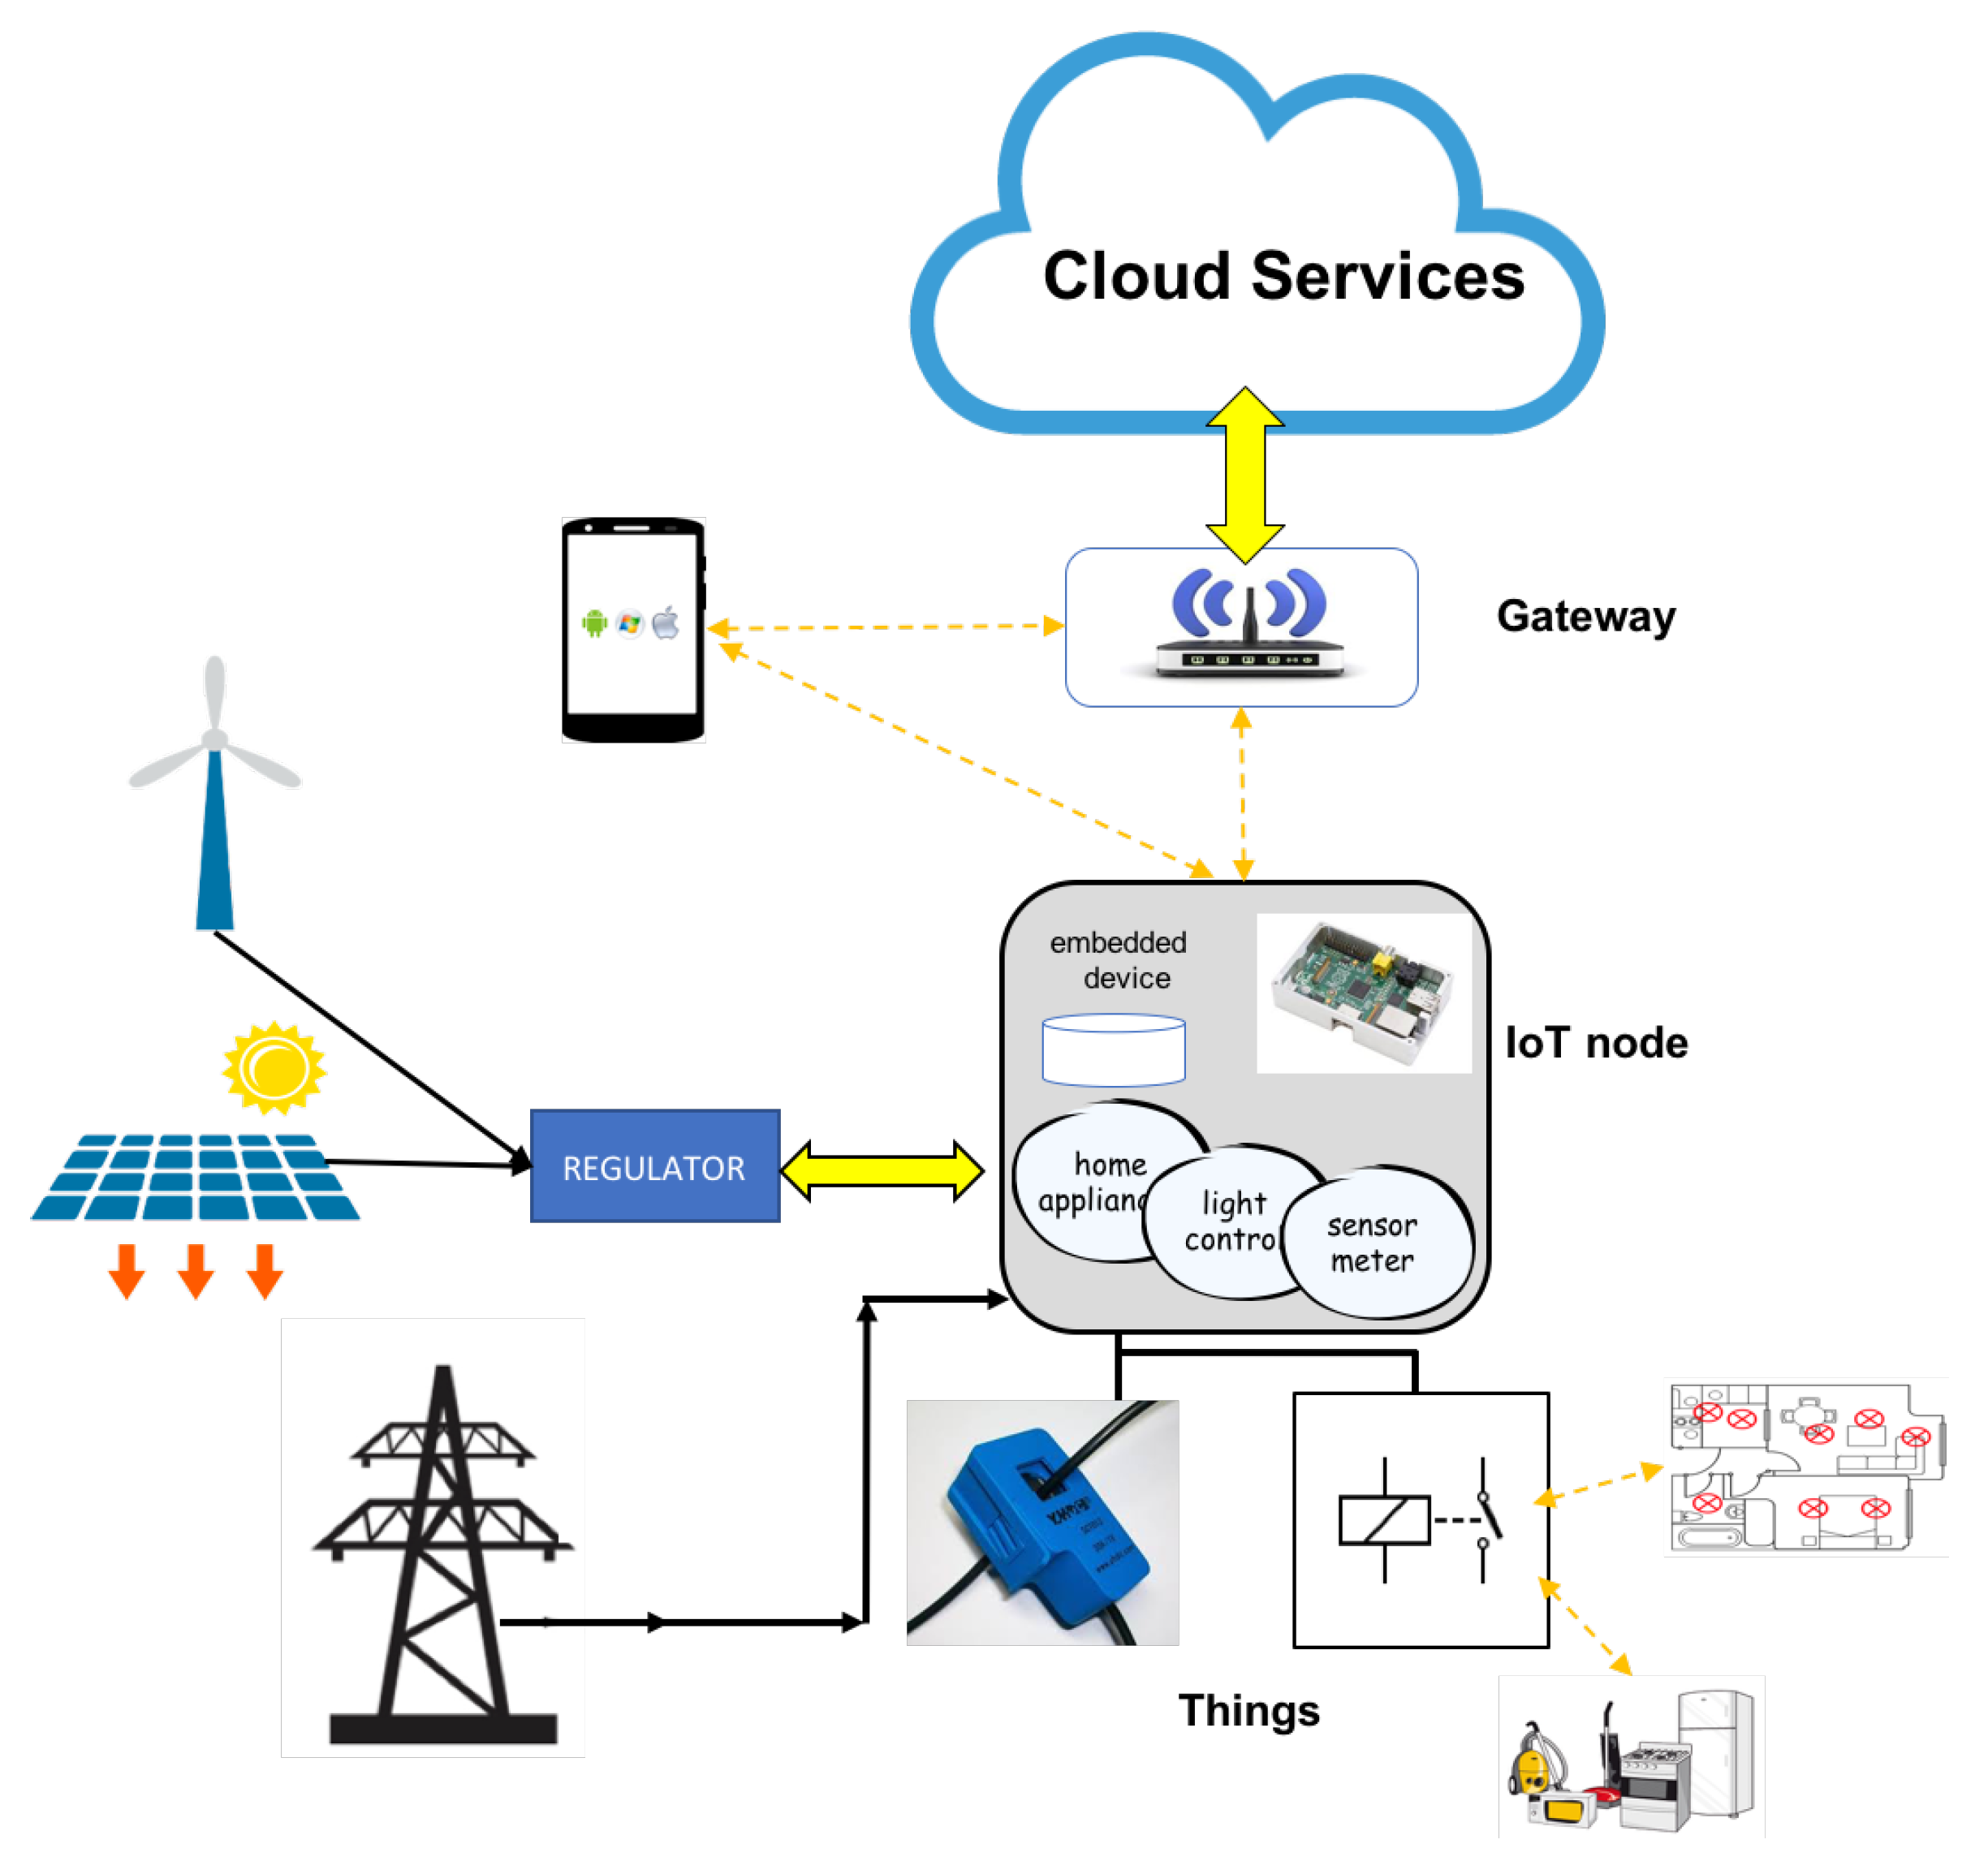
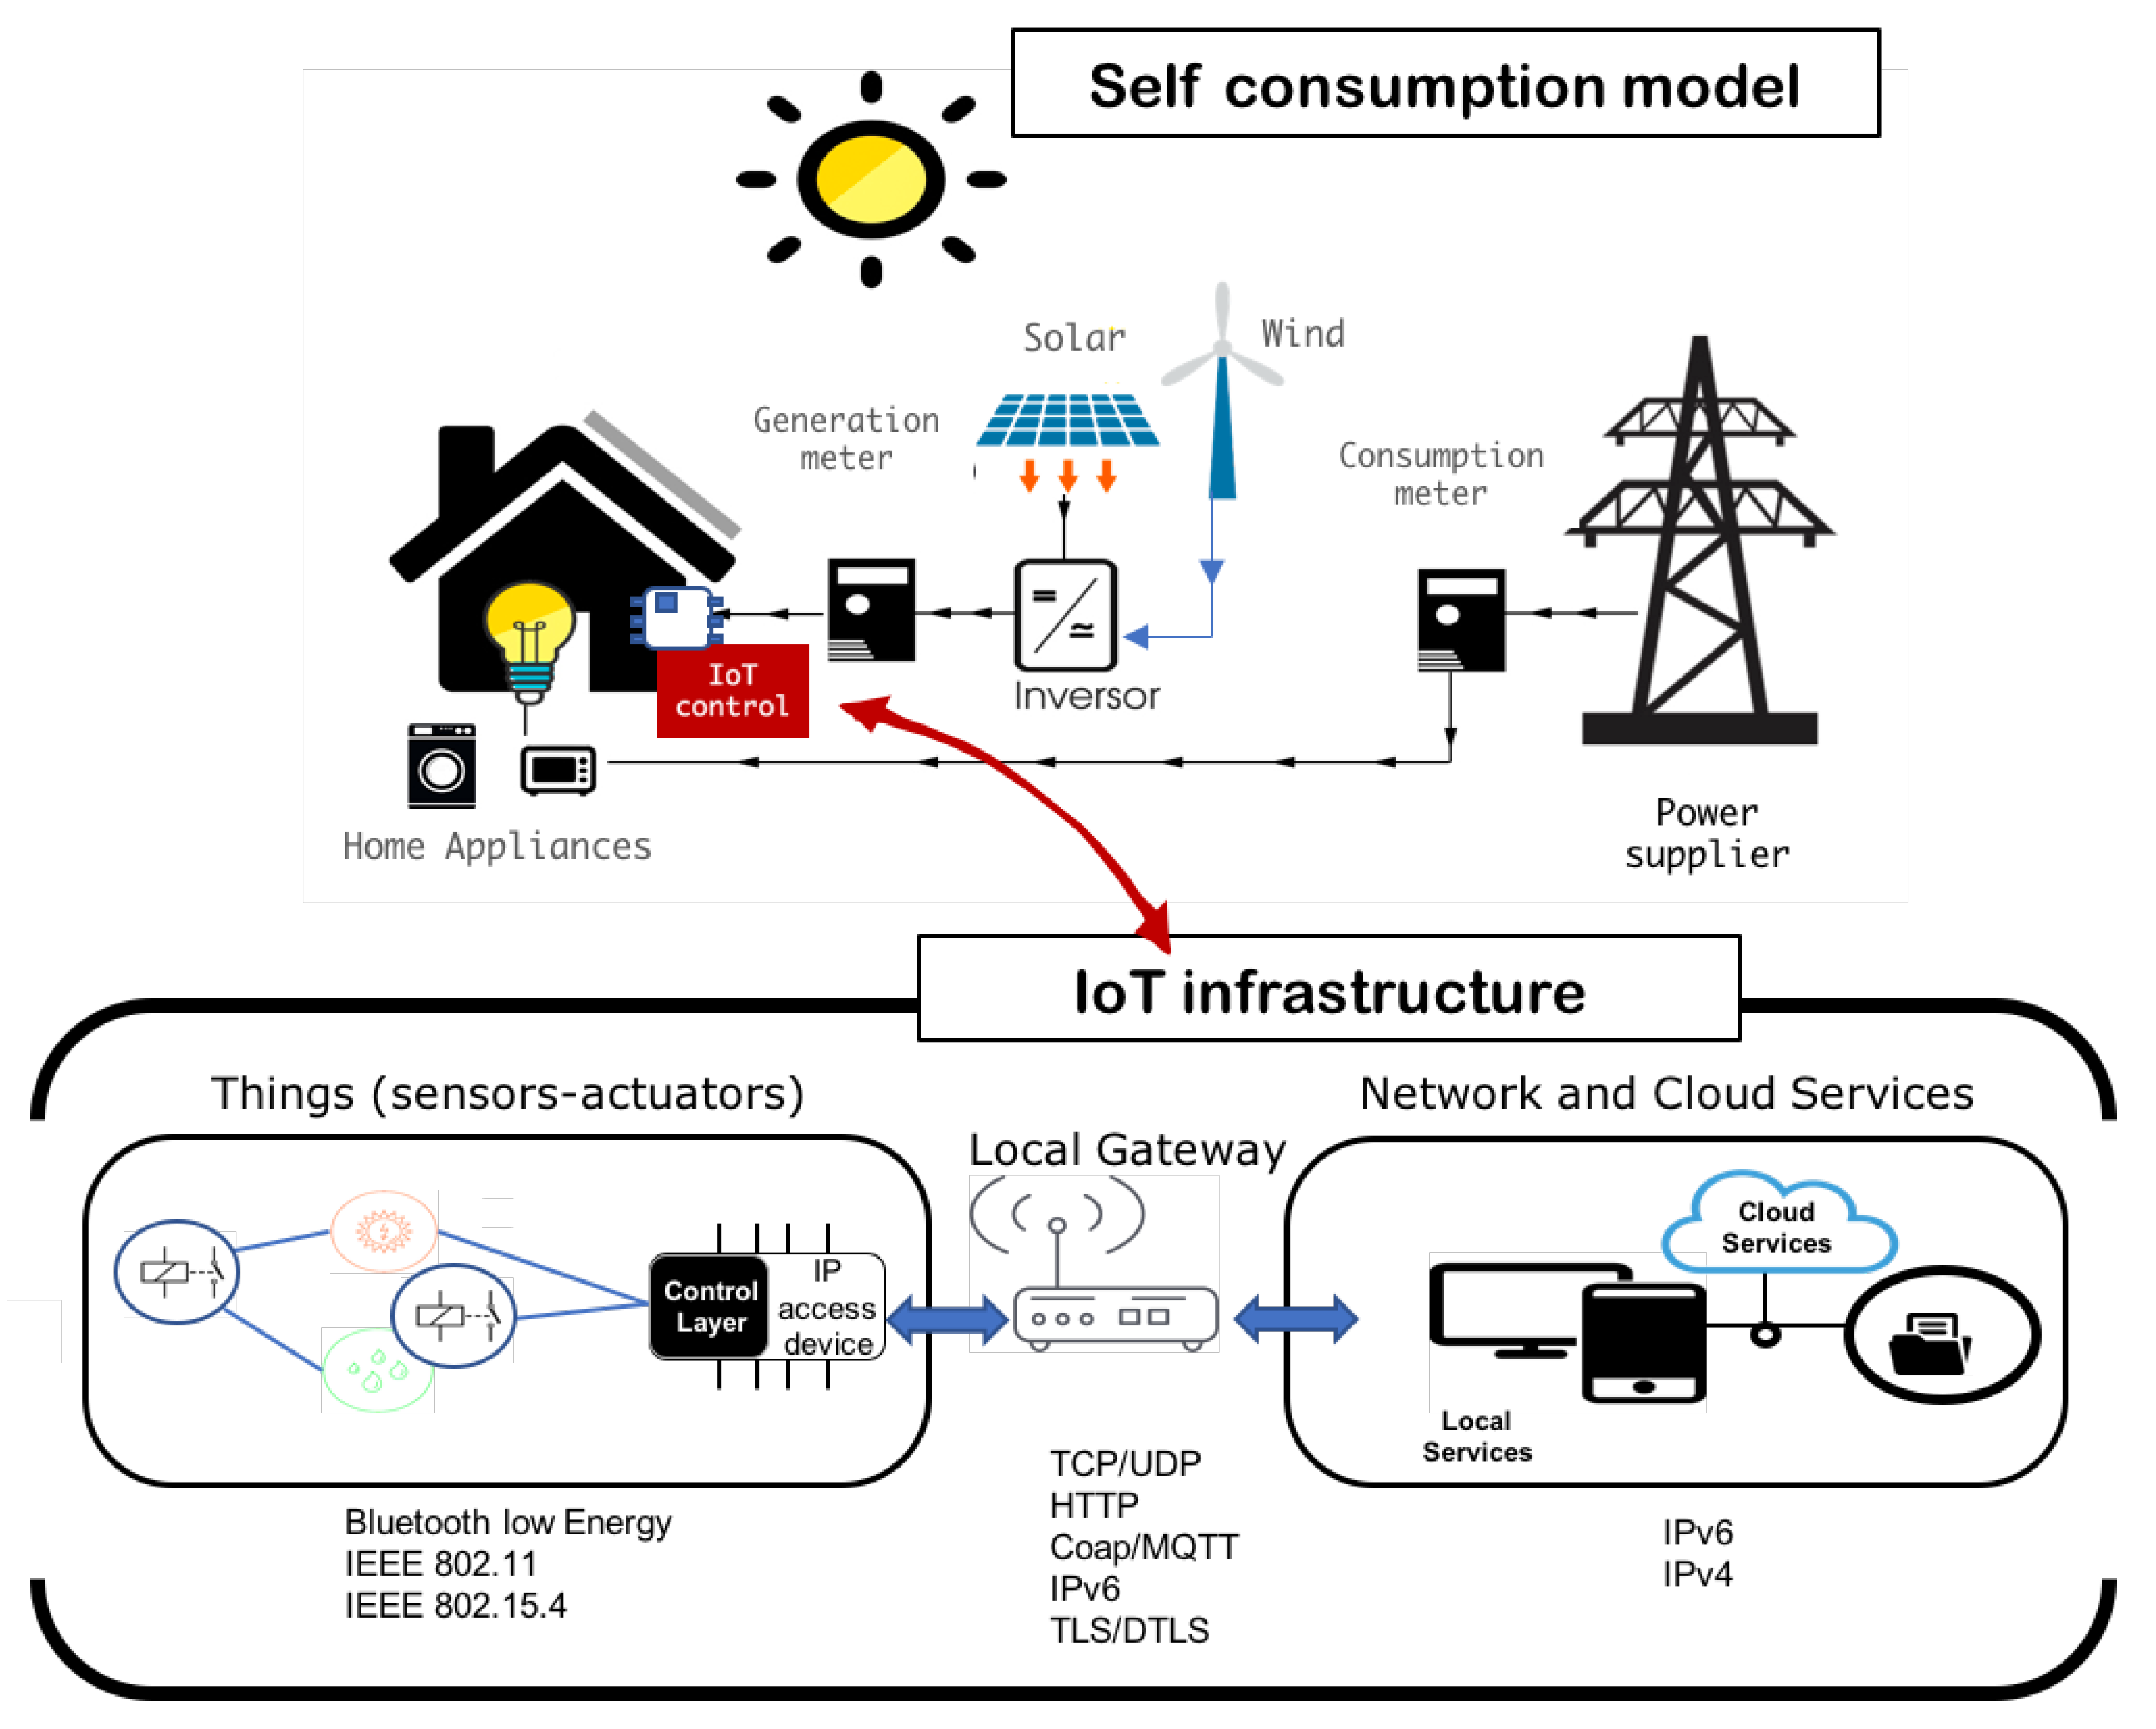
2. Internet of Things and Artificial Intelligence Infrastructure on eoTICC Project

This work proposes an infrastructure based on the Internet of Things communication protocols used for energy management in residential housing with wind, solar and power supplier facilities. The objective is to develop decision tree algorithms capable of managing the energy resource available depending on power consumption curve detected to optimize self consumption and avoid energy storage. This is the first experimental work of eoTICC project. The platform communication follows a pattern based on an IoT model: Device-to-gateway (RFC7452 [15]). Over this pattern, edge layer computing is developed. The platform is based on three elements (shown in Figure 3):
  • Things. Today there are millions of things (sensors/actuators and devices found in commercial and industrial settings) connected directly through wireless networks and accessing the Internet. Usually, the IoT solutions have things filtered and managed using data locally and/or connected to gateways that provide extended functionality. Basic devices are tagged like things. Each thing has data that can be shared in the Internet.
  • Local Gateway. Most of existing things were not designed to connect to the Internet and cannot share data with the cloud. To resolve this difficulty gateways act as intermediaries between things and the cloud, providing the needed connectivity, security, and manageability.
  • Network and Cloud. Cloud infrastructure contains large pools of virtualized servers and storage that are networked together. IoT solutions run applications that analyse and manage data from devices and sensors in order to generate services that produce information used in decision making.
The solution will be analyzed for the energy management of a residential housing with a power consumption of 9 KWh/day. The installation of micro generation includes an Archimedes wind turbine and 3 photovoltaic panels with a 180 W peak power.

3. Materials and Methods

This work uses an electrical consumption curve in a house with 110 m 2 of useful area, with a distribution of 3 bedrooms, living room, kitchen, gallery, 2 bathrooms and 4 inhabitants. Figure 2 shows power consumption daily in residential house captured by IoT node processing (learning phase).
Device architecture model is shown in Figure 3. An embedded device (Raspberrypi) used as an IoT node and Python language to develop control algorithms are deployed in the first prototype. There are three processes implemented on IoT node:
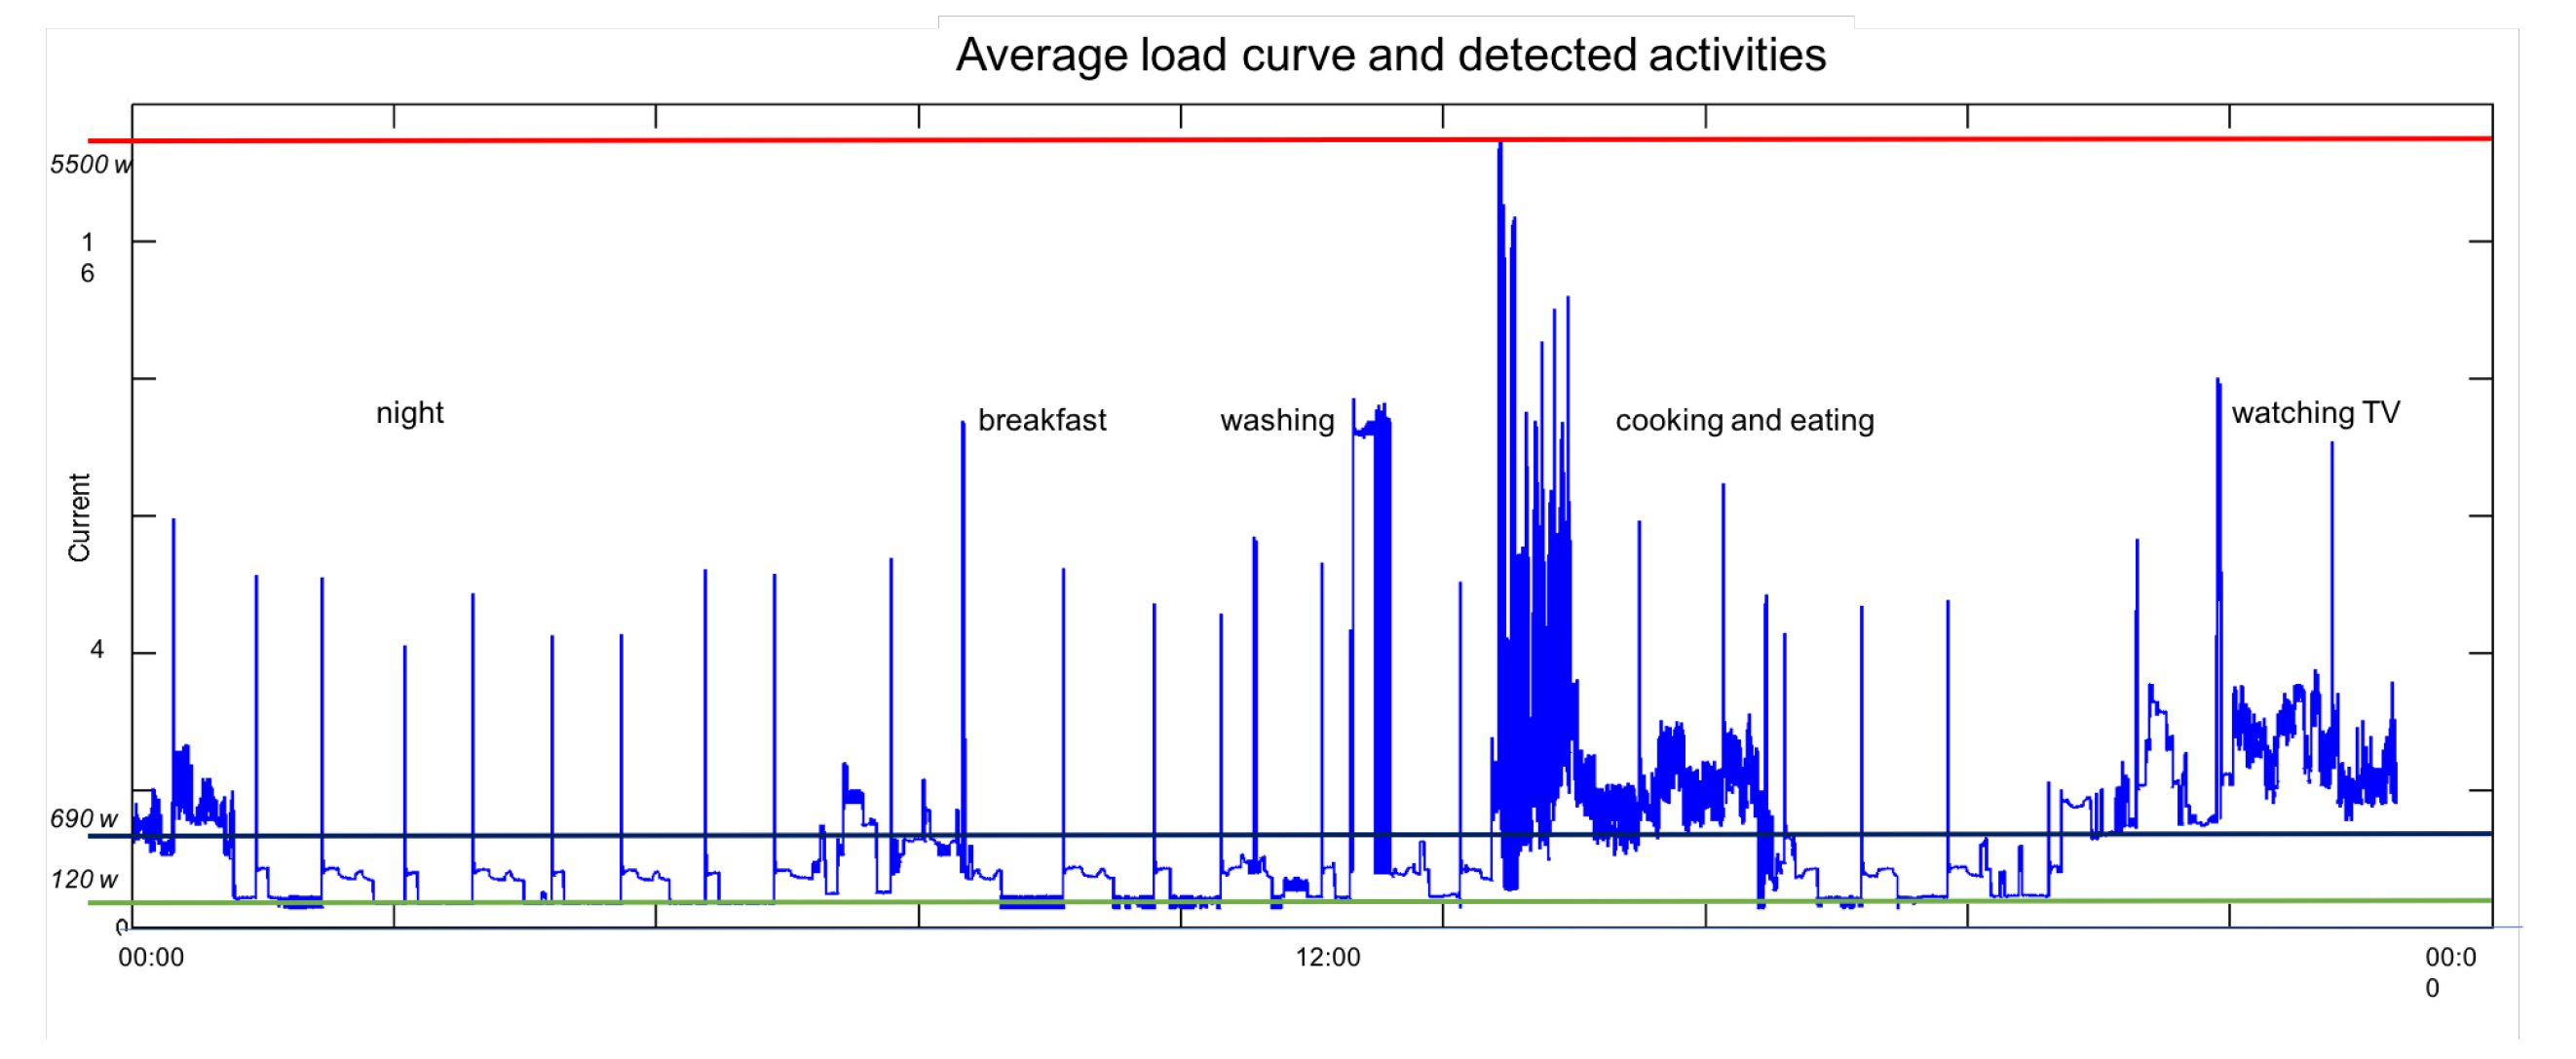
  • Learning power consumption patterns
  • Forecast power consumption and forecast power generation.
  • Home appliances control using forecast data and decision trees.
Critical applications and basic control processes should be installed in IoT node. Web services, HMI interfaces or analytic applications could be installed on internet/intranet cloud. Other extended services and applications are developed using Internet. Things (sensor meters and actuators) and Cloud services are distributed, communication and IoT node provide the resources to integrate and to make them interoperable. In this work MQTT protocol is proposed as communication paradigm between devices and nodes. Algorithms in python language capture, processes and communique data. Power consumption analysed with power meter connected to IoT node determines three levels of power consumption and different patterns depending on the time of day (Figure 2).
Installation of microgeneration is composed of 3 photovoltaics panels model Damia Solar 180 w 24 V monocrystalline. This turbine is designed by Ecopower Solutions company and is characterized by the unique design of its blades rotation based on the spiral of Archimedes. This geometry originates an aesthetic visually pleasant, very different from the conventional turbines.
To understand the relationship between power and wind speed to determine the required control type, optimization, or limitation. Figure 4 contains an ideal wind turbine power curve. The power curve specifies how much power you can extract from the incoming wind. The Archinmedes wind turbine has a diameter of 1.4 m and a maximum of 1.8 kW peak power Figure 5. The power curve is split into three distinct regions [16,17]. Because Region I consists of low wind speeds and is below the rated turbine power, the turbine is run at the maximum efficiency to extract all power. In other words, the turbine controls with optimization in mind. On the other hand, Region III consists of high wind speeds and is at the rated turbine power. The turbine then controls with limitation of the generated power in mind when operating in this region. Finally, Region II is a transition region mainly concerned with keeping rotor torque and noise low.
Kyung Chun Kim et al. [18] highlighted its operation at low speeds, its ability to passively orient themselves using the drag force, and the low level noise generated. The architecture of this wind turbine takes advantage of the drag and lift forces to generate rotation. The most important features of the curve of power provided by the manufacturer are summarized in the Table 1.

4. Results

Photovoltaic Geographical Information System software (PVGIS) is used to estimate production through solar resource, which calculated the radiation from images by satellite. In our case, the location is just outside of the town of Crevillente, in the province of Alicante (Spain). The optimum angle for our location in the month of May is 13 degrees, however the annual optimum angle is 34 degrees. Therefore, this last value is used by default for the calculation. Monthly radiation with this tilt is 6650 Wh/m 2 /day. The production estimate is 6.43 kWh/day using a operating factor of 0.9.
In the case of wind power, data come from an anemometer station near to the designated location. Data taken at 10 m high with a 2 min interval. Surface breezes have a turbulent nature, low energy density, intermittent and reduced speed. The average speed of the wind during the day May 20th was 4.53 m/s. (Figure 6).
The Table 2 shows the estimation of electricity generated hourly depending on the energy resource and the total produced. In this table power consumption is compared with power generation. These data are analysed by IoT node to develop decision trees that optimize power management. The method proposed is:
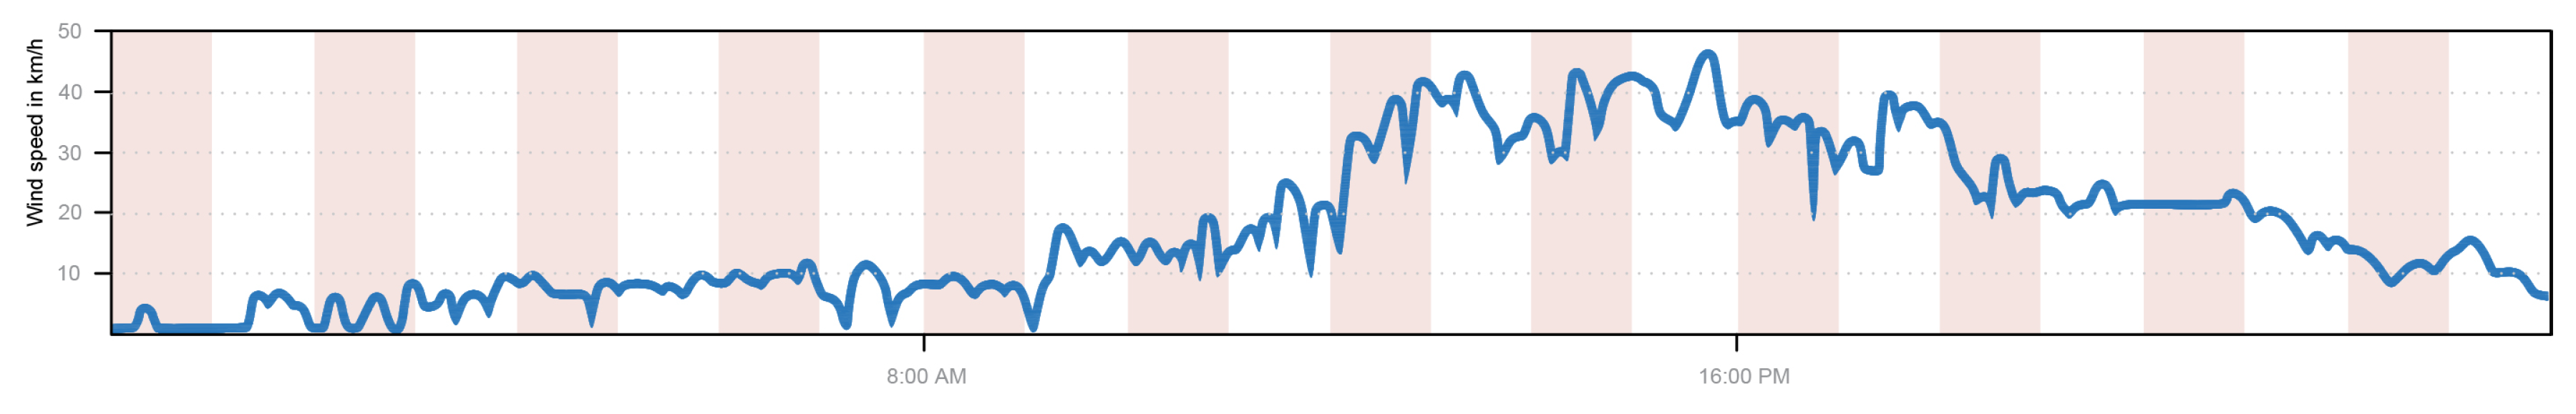
  • Iot node connects to open weather services to obtain hourly weather forecast.
  • Solar and wind data are analysed.
  • Power generation is estimated.
  • Power consumption is calculated and an algorithm with decision trees decides control actions.
Figure 7 shows graphic generation data on Table 2 and consumption data. There are three characteristic zones analysed. If the consumption is higher than the production the system monitors. If consumption is less than production, generation must be used in selected loads to take advantage of and optimize. If there are two previous conditions in the same processing, the system uses shorter response times to reduce the time.
The IoT node implements different modules (processes based on language Pyhton libraries and Linux OS) that use data (Things) hourly and each minute using communication protocols (MQTT, HTTP) in local and cloud services (Figure 8):
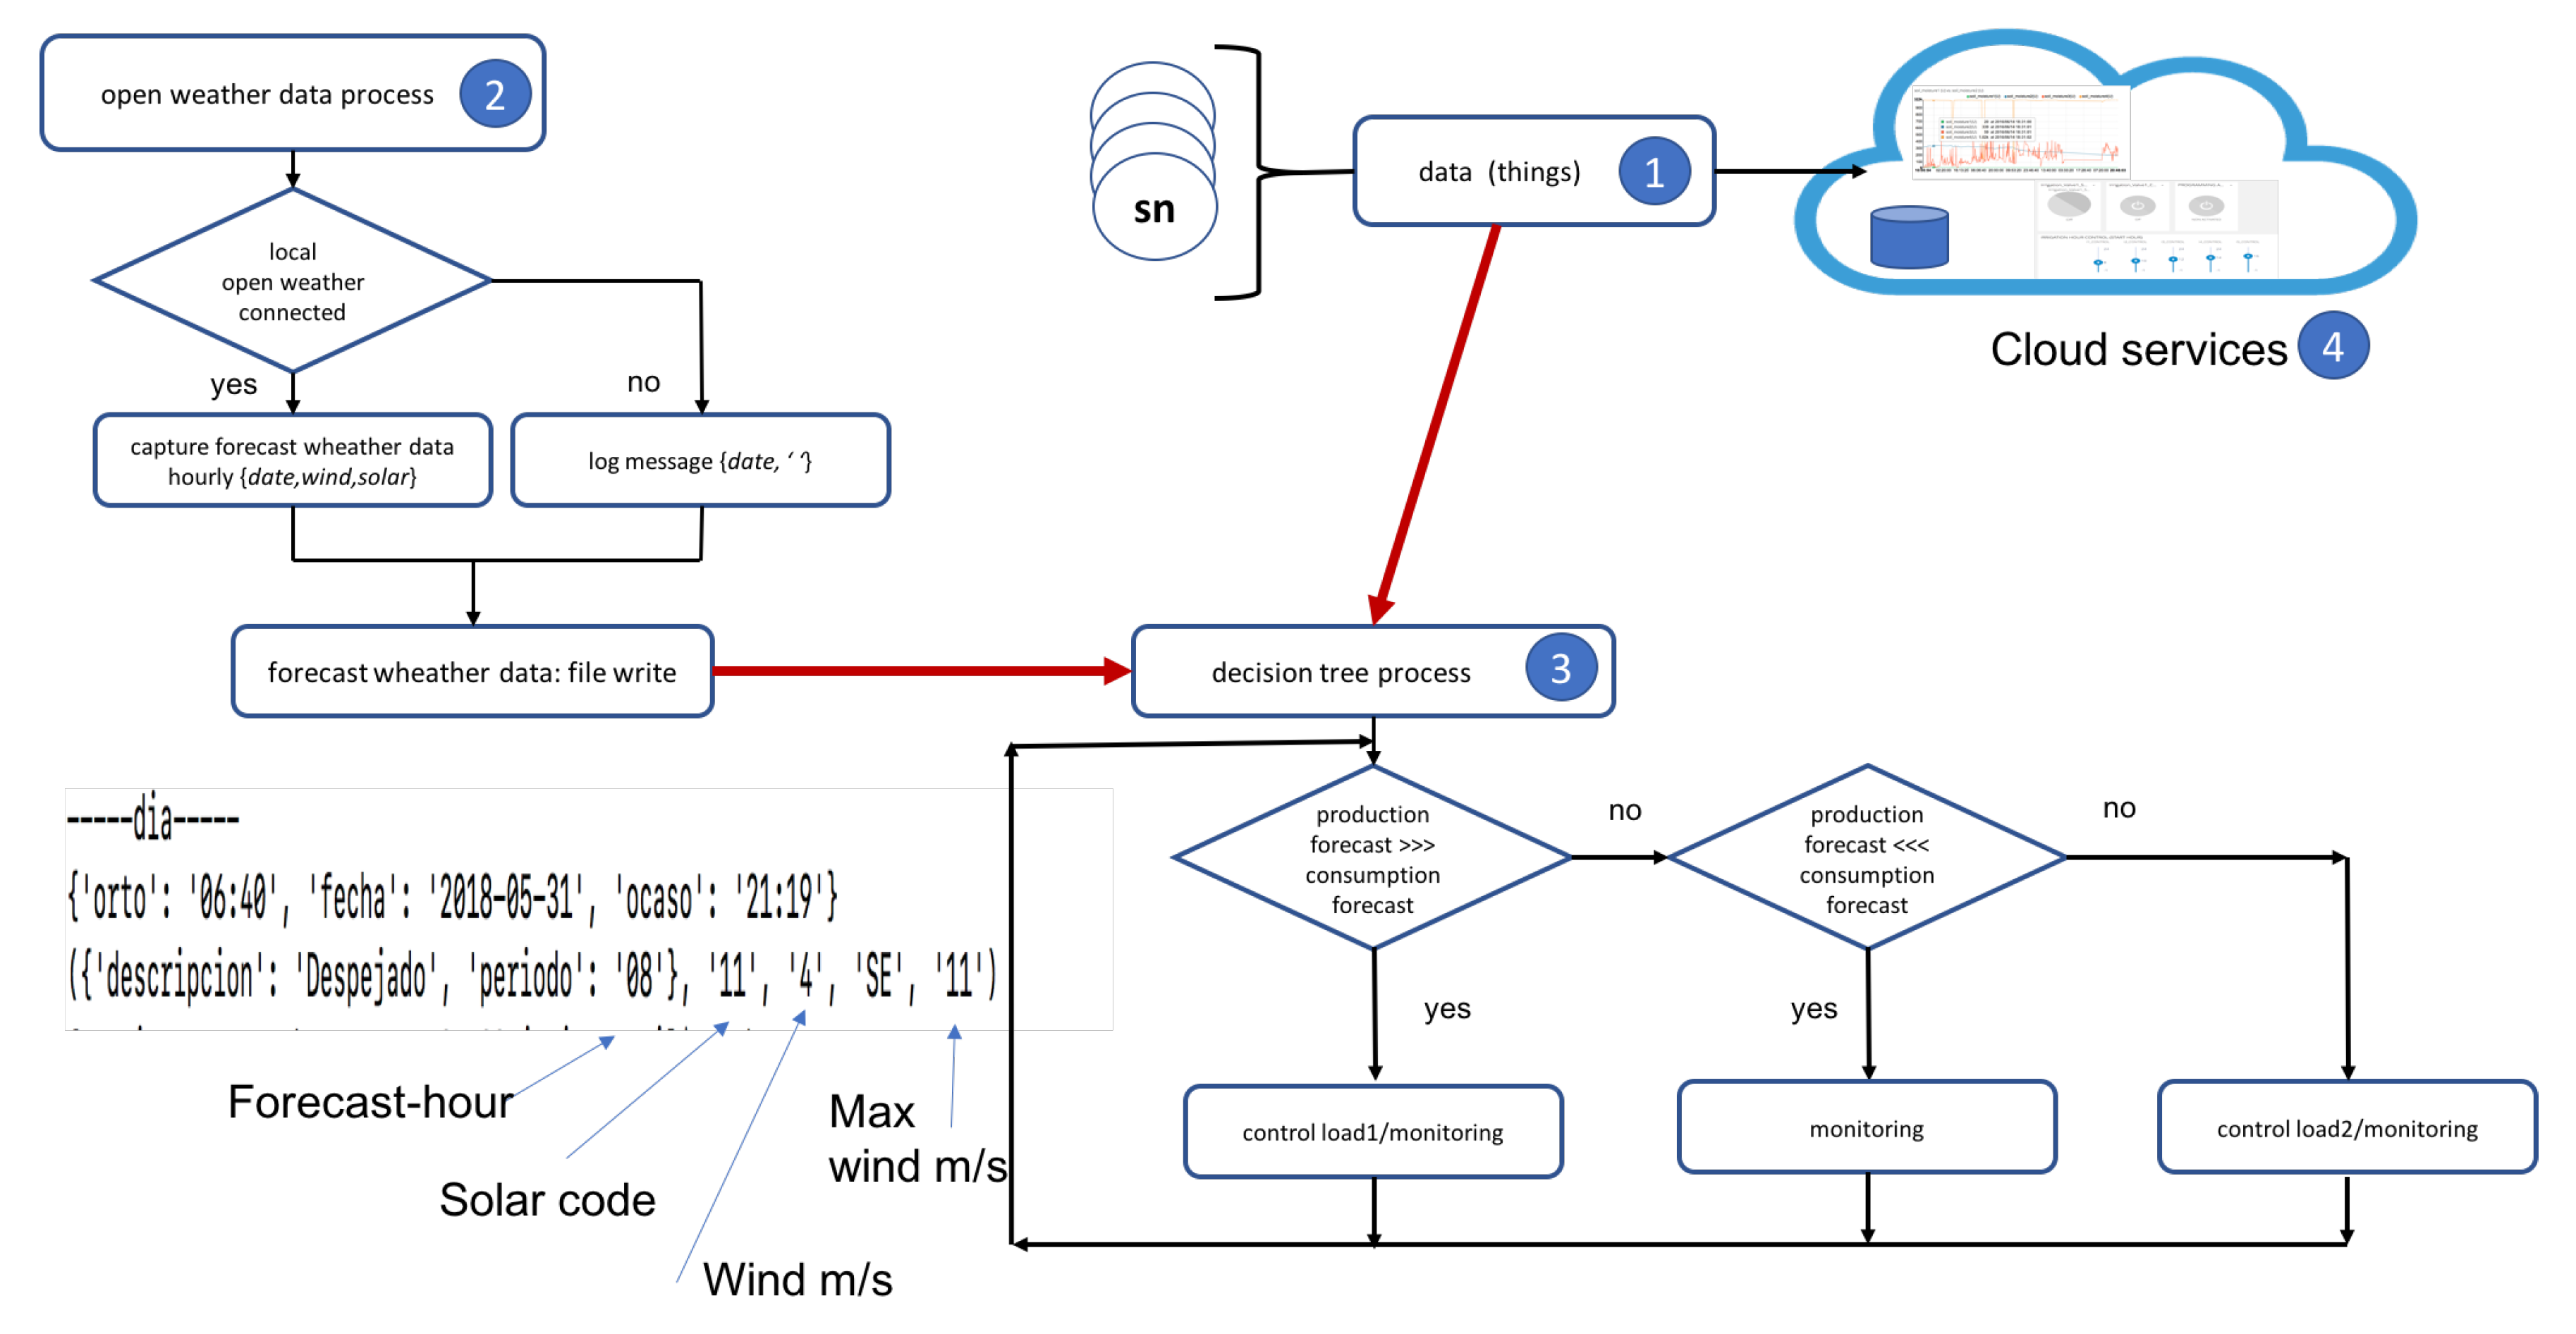
  • Process 1: Data capture. An algorithm captures system data: rpm wind turbine, wind and solar energy generated, power consumption, ambient data, controllers and other. This algorithm communicates these data to cloud and other control processes.
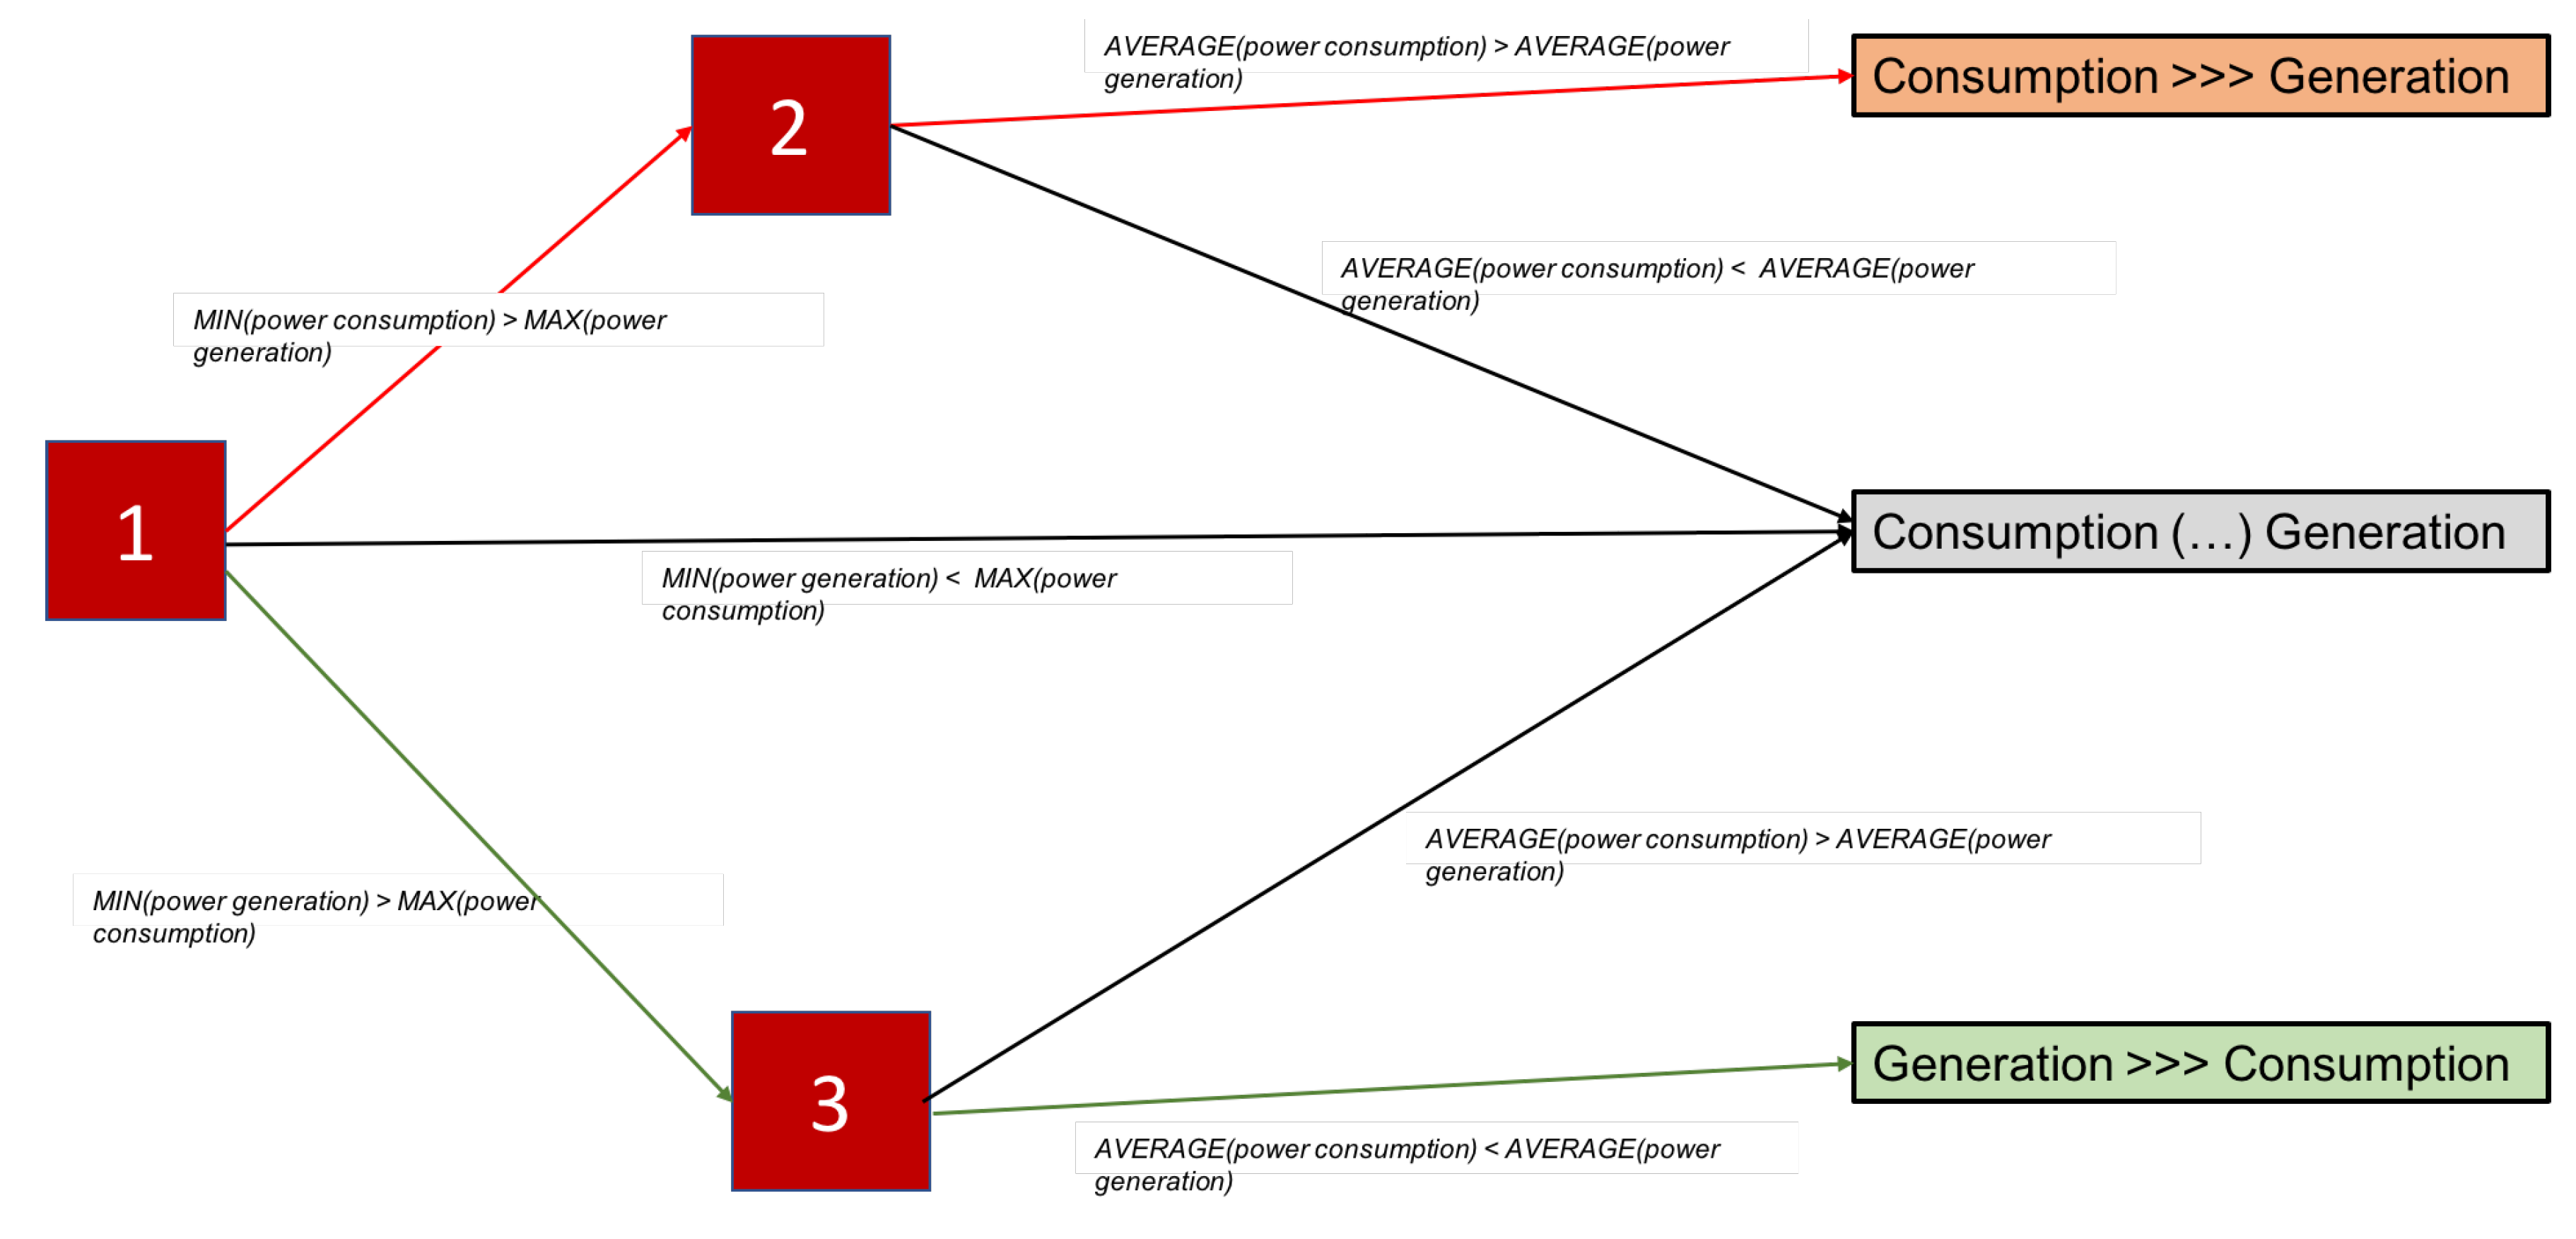
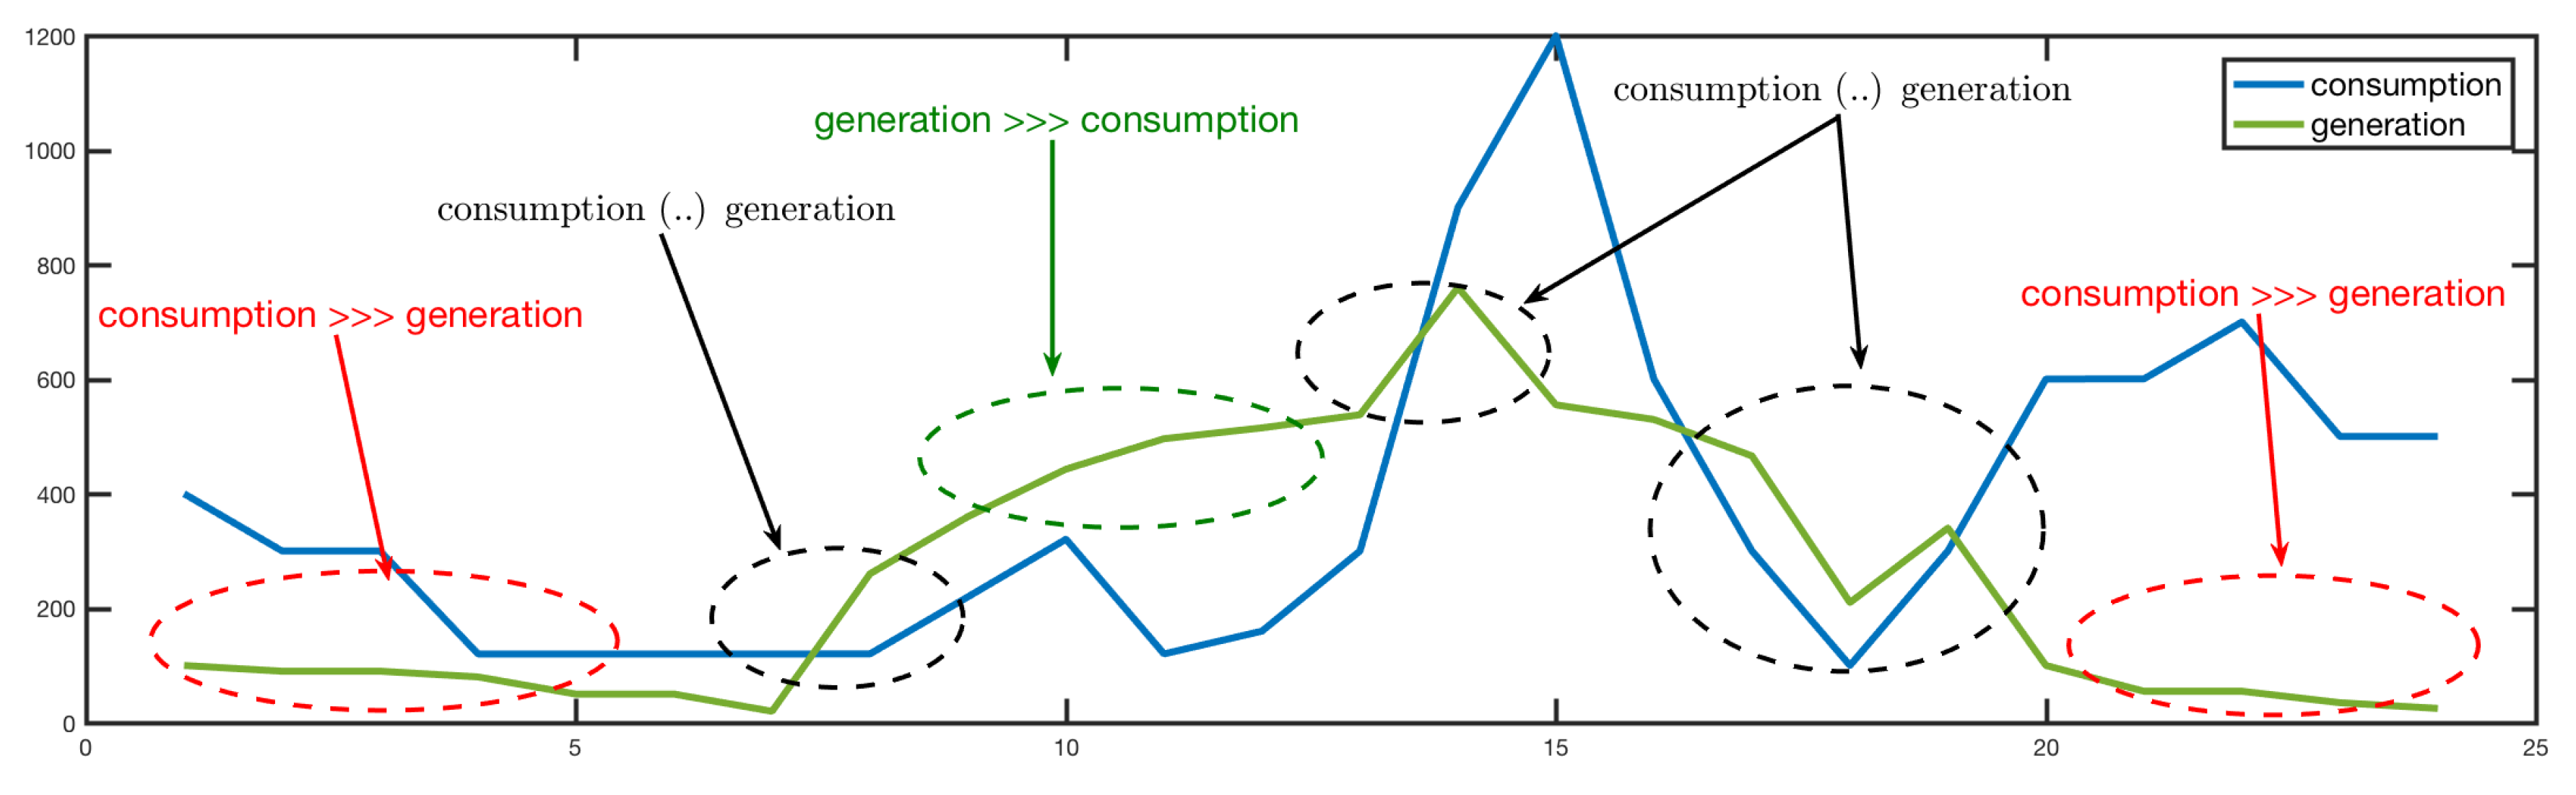
  • Process 2: Forecast. Hourly algorithm that is connected to open internet weather data. This algorithm calculates the power generation and consumption forecasts. It uses rules based on decision trees. The first decision tree is shown in Figure 9.
  • Process 3. Decision tree and control. This algorithm controls the installation: start/stop, security and others. Decision tree data allows processing different control strategies.
  • Process 4. Cloud services. A cloud platform is used to implement dashboard monitoring, storage and control.
An OS multi thread like Linux must be used to implement different algorithms on different times of processing. Sensors and actuators are standard devices integrated and inter-operatives. Standard communications protocols ensure capture, processing and data storage.

5. Conclusions

In this work a new method to optimize power generation use (wind and solar) on self-consumption infrastructures is proposed. A residential installation is implemented using standard solar panels and Archimedes wind turbine. It is a first experimental work developed on eoTICC project. This experimental work allows to show that using IoT and AI paradigms the power generated can be managed optimizing its use. In future work new decision trees will be designed and implemented. A feedback of this first prototype will be analysed and new design requirements will be identified.

Author Contributions

F.-J.F.-P., S.G.-T. and J.-M.G.-C. performed the analysis and design requirement. Sensor network, algorithms implementation and cloud services were implemented by F.-J.F.-P. and R.V.-S. The validation was performed by M.N.-H. All authors have read and agreed to the published version of the manuscript.

Acknowledgments

This research was supported by Industrial Computers and Computer Networks program (I2RC) (2017/2018) funded by the University of Alicante, Wak9 Holding BV company under eo-TICC project and the Valencian Innovation Agency under scientific innovation unit (UCIE Ars Innovatio) of the University of Alicante.

References

  1. Ferrández-Pastor, F.J.; García-Chamizo, J.M.; Nieto-Hidalgo, M.; Mora-Pascual, J.; Mora-Martínez, J. Developing Ubiquitous Sensor Network Platform Using Internet of Things: Application in Precision Agriculture. Sensors 2016, 16, 1141. [Google Scholar] [CrossRef] [PubMed]
  2. Al-Sarawi, S.; Anbar, M.; Alieyan, K.; Alzubaidi, M. Internet of Things (IoT) communication protocols: Review. In Proceedings of the 2017 8th International Conference on Information Technology (ICIT), Singapore, 27–29 December 2017; pp. 685–690. [Google Scholar]
  3. Heđi, I.; Špeh, I.; Šarabok, A. IoT network protocols comparison for the purpose of IoT constrained networks. In Proceedings of the 2017 40th International Convention on Information and Communication Technology, Electronics and Microelectronics (MIPRO), Opatija, Croatia, 22–26 May 2017; pp. 501–505. [Google Scholar]
  4. MQTT org. Available online: http://mqtt.org (accessed on 26 May 2018).
  5. Davis, E.G.; Calveras, A.; Demirkol, I. Improving Packet Delivery Performance of Publish/Subscribe Protocols in Wireless Sensor Networks. Sensors 2013, 13, 648–680. [Google Scholar] [CrossRef] [PubMed]
  6. Alvarez-Campana, M.; López, G.; Vázquez, E.; Villagrá, V.A.; Berrocal, J. Smart CEI Moncloa: An IoT-based Platform for People Flow and Environmental Monitoring on a Smart University Campus. Sensors 2017, 17, 2856. [Google Scholar] [CrossRef] [PubMed]
  7. Atmoko, R.A.; Riantini, R.; Hasin, M.K. IoT real time data acquisition using MQTT protocol. J. Phys. Conf. Ser. 2017, 853, 012003. [Google Scholar] [CrossRef]
  8. Wang, Z.; Srinivasan, R.S. A review of artificial intelligence based building energy use prediction: Contrasting the capabilities of single and ensemble prediction models. Renew. Sustain. Energy Rev. 2017, 75, 796–808. [Google Scholar] [CrossRef]
  9. Le, M.-H.; Ploix, S. Robust anticipative energy management system: Application of a smart building platform. Build. Serv. Eng. Res. Technol. 2017, 38, 226–248. [Google Scholar] [CrossRef]
  10. Fong, S.; Li, J.; Song, W.; Tian, Y.; Wong, R.K.; Dey, N. Predicting unusual energy consumption events from smart home sensor network by data stream mining with misclassified recall. J. Ambient Intell. Humanized Comput. 2018, 9, 1–25. [Google Scholar] [CrossRef]
  11. Ferrández-Pastor, F.J.; Mora-Mora, H.; Sánchez-Romero, J.L. Interpreting human activity from electrical consumption data using reconfigurable hardware and hidden Markov models. J. Ambient Intell. Hum. Comput. 2017, 8, 469–483. [Google Scholar] [CrossRef]
  12. Lai, C.-F.; Yang, Y.-H.; Chao, L.; Chao, H.-C. Integration of IoT Energy Management System with Appliance and Activity Recognition. In Proceedings of the 2012 IEEE International Conference on Green Computing and Communications, Besancon, France, 20–23 November 2012; pp. 66–71. [Google Scholar] [CrossRef]
  13. Cho, W.-T.; Lai, Y.-X.; Lai, C.-F.; Huang, Y.-M. Appliance-Aware Activity Recognition Mechanism for IoT Energy Management System. Comput. J. 2013, 56, 1020–1033. [Google Scholar] [CrossRef]
  14. Kaur, K.; Kaur, K. A study of power management techniques for Internet of Things (IoT). In Proceedings of the 2016 International Conference on Electrical, Electronics, and Optimization Techniques (ICEEOT), Chennai, India, 3–5 March 2016; pp. 1781–1785. [Google Scholar] [CrossRef]
  15. Tschofenig, H.; Arkko, J.; Thaler, D.; McPherson, D.; Internet Architecture Board (IAB). Architectural Considerations in Smart Object Networking. 2015. Available online: https://tools.ietf.org/html/rfc7452 (accessed on 26 May 2018).
  16. National Instruments. Wind Turbine Control Methods. 2008. Available online: http://www.ni.com/white-paper/8189/en/ (accessed on 26 May 2018).
  17. Lydia, M.; Suresh Kumar, S.; Immanuel Selvakumar, A.; Edwin Prem Kumar, G. A comprehensive review on wind turbine power curve modeling techniques. Renew. Sustain. Energy Rev. 2014, 30, 452–460. [Google Scholar] [CrossRef]
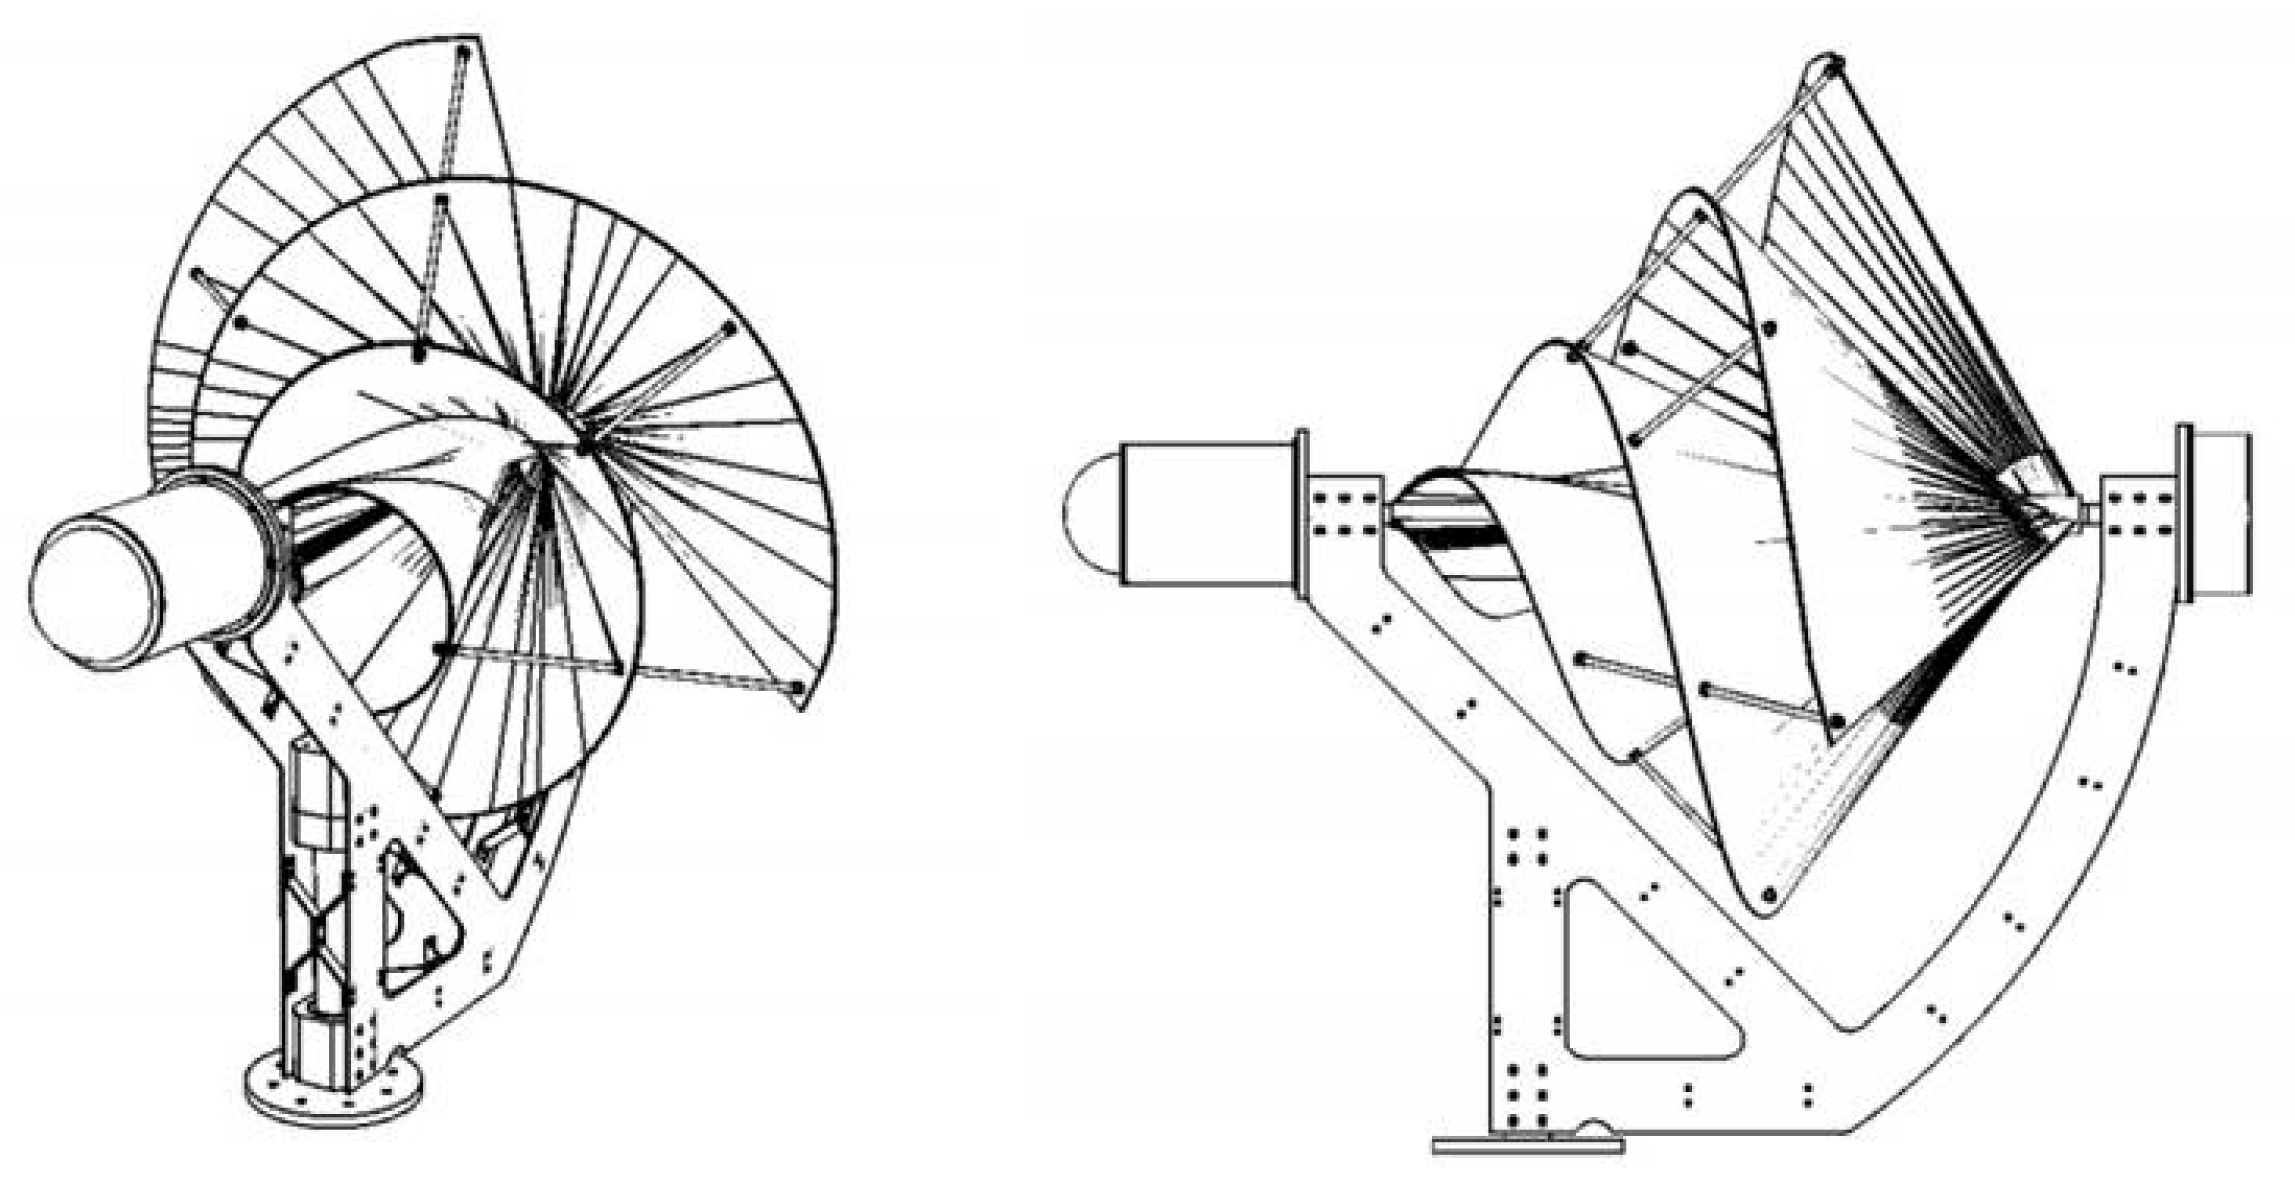
  18. Lu, Q.; Li, Q.; Kim, Y.K.; Kim, K.C. A study on design and aerodynamic characteristics of a spiral-type wind turbine blade. J. Korean Soc. Visual. 2012, 10, 27–33. [Google Scholar] [CrossRef]
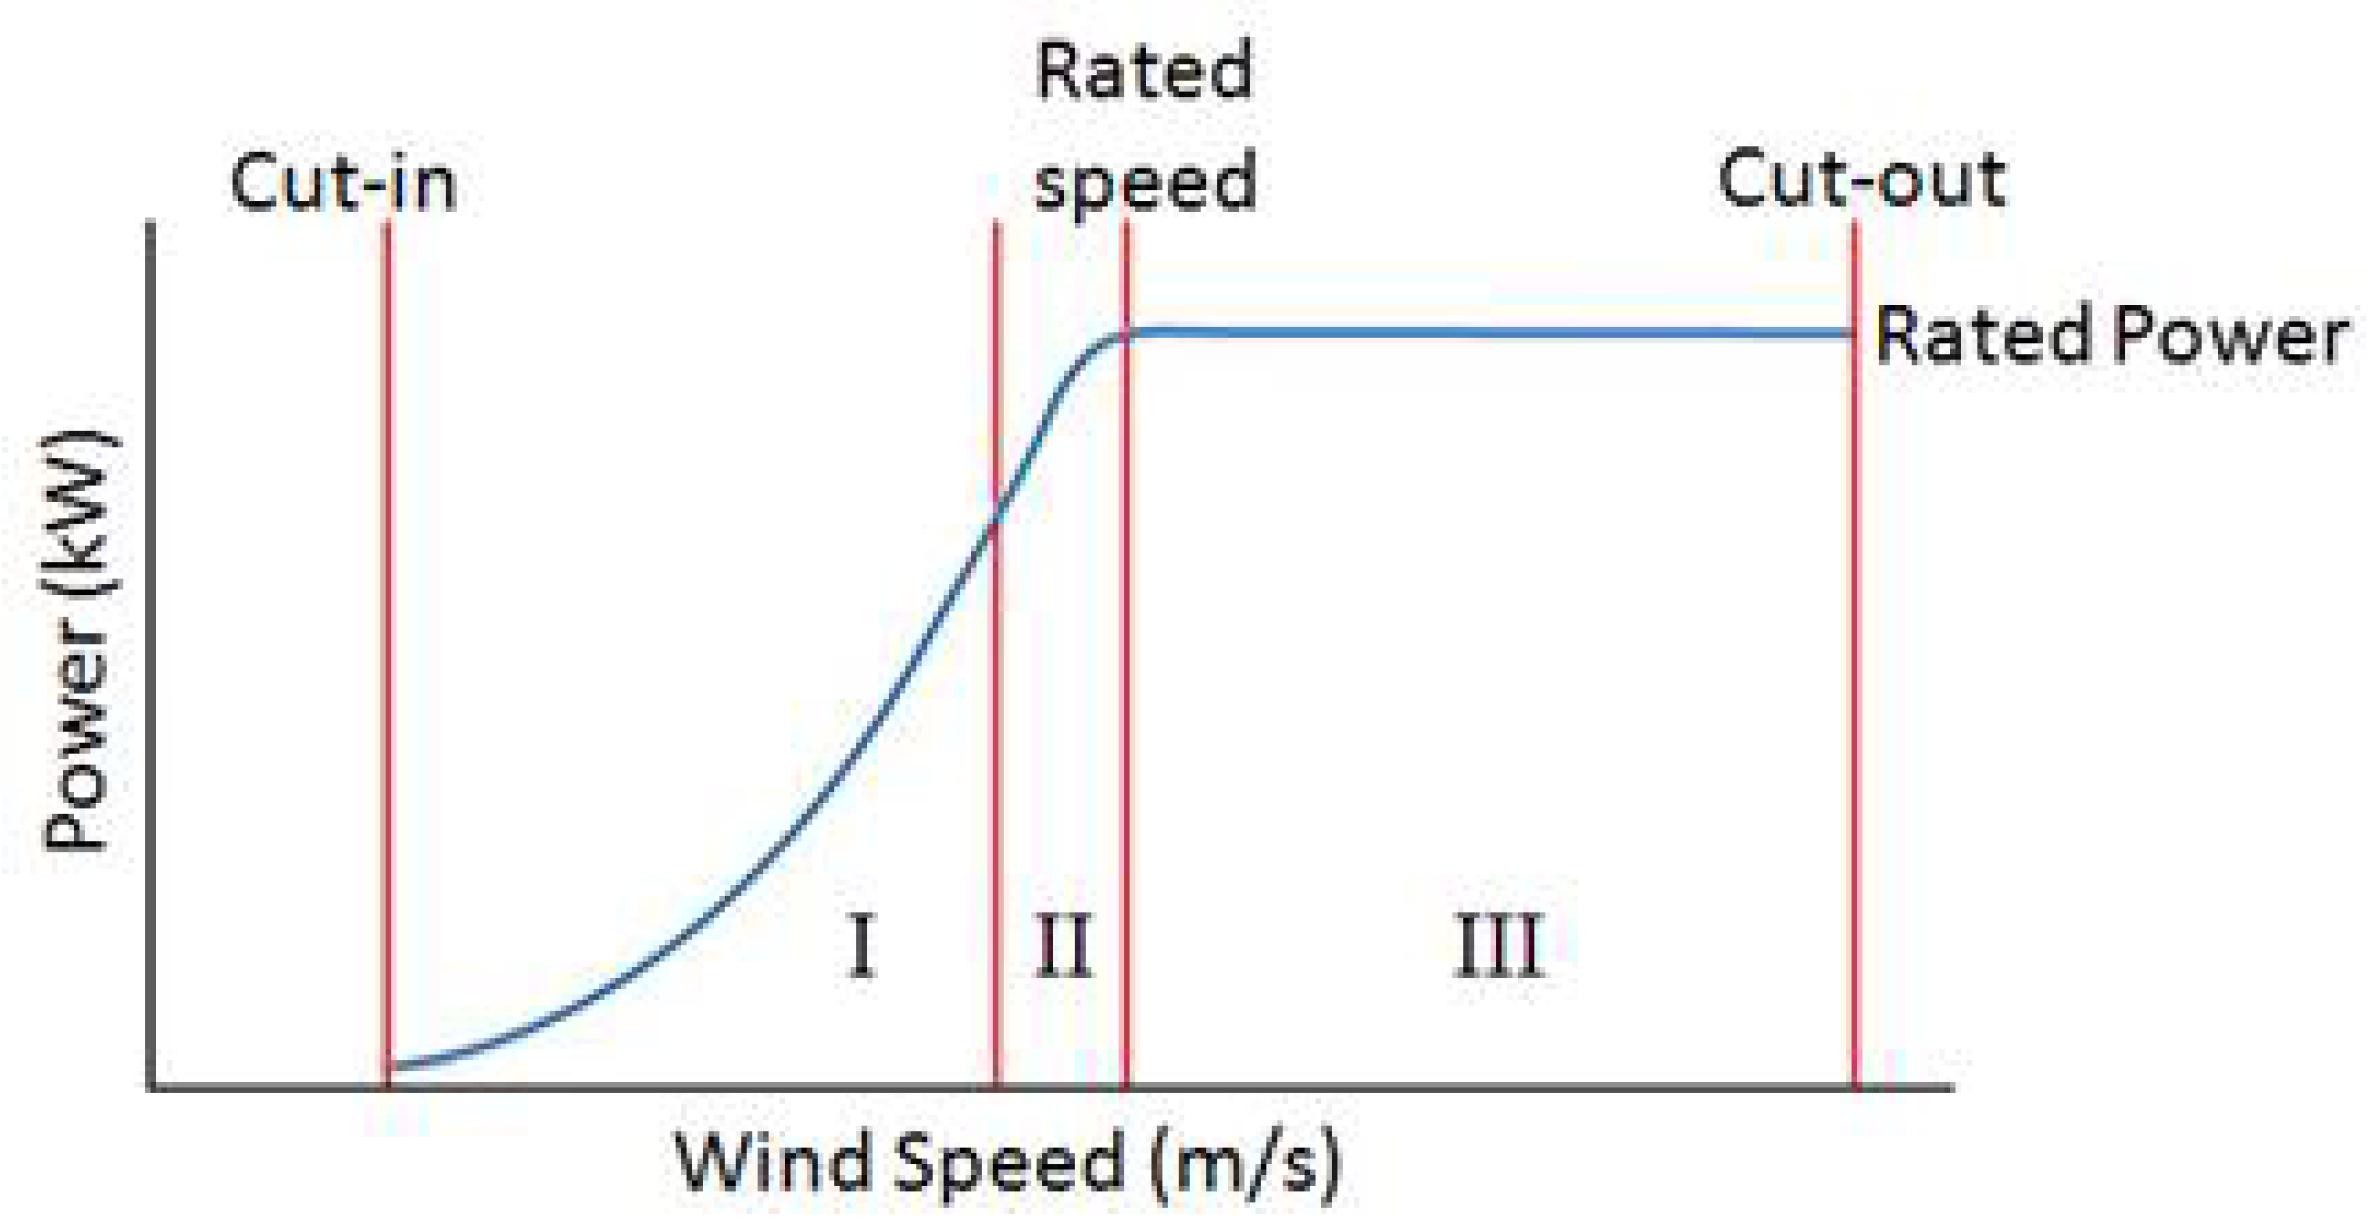
Figure 1. Environmental model proposed.
Proceedings 02 01239 g001
Figure 2. Detection of power consumption patterns using IoT node.
Proceedings 02 01239 g002
Figure 3. IoT devices architecture.
Proceedings 02 01239 g003
Figure 4. Standard curve generated power-wind speed by ©National Instruments.
Proceedings 02 01239 g004
Figure 5. Architecture of Archimedes wind turbine.
Proceedings 02 01239 g005
Figure 6. Average wind speed, 20 May.
Proceedings 02 01239 g006
Figure 7. Significant situations captured to design decision trees.
Proceedings 02 01239 g007
Figure 8. Processes implemented on IoT node.
Proceedings 02 01239 g008
Figure 9. First decision tree that calculates, hourly, different forecast on the facility. The aim is control power loads and renewable devices to optimize the use of renewable energy. The output of this decision tree are three possible scenarios, which are shown in the previous Figure 7. The result, every hour, is used as input to the energy management system. If generation > consumption, electric devices (loads) must be connected to exploit energy. if consumption > generation, no control actions are taken. If consumption and generation can be different the forecast time, control in real time must be implemented.
Proceedings 02 01239 g009
Table 1. Archimedes wind turbine power curve.
Operating ModeWind Speed (m/s)
Cut in2zone I
Rated12.5zone II
Cut out26zone III
Table 2. Production of electricity from the installation of microgeneration, 20 May.
Solar PanelsWind TurbineTotal ProductionConsumption
(W)(W)(W)(W)
00:00 to 1:00 a.m.-100100400
1:00 to 2:00 a.m.-90100300
2:00 to 3:00 a.m.-9090300
3:00 to 4:00 a.m.-80100120.1
4:00 to 5:00 a.m.-5050120.1
5:00 to 6:00 a.m.-5050120
6:00 to 7:00 a.m.-2020120
7:00 to 8:00 a.m.-2020120.3
8:00 to 9:00 a.m.240.2-240.2220
9:00 to 10:00 a.m.360.1-360.1320.5
10:00 to 11:00 a.m.442.911453.9120.2
11:00 a.m. to 12:00 p.m.485.030515.0160
12:00 p.m. to 13:00 p.m.485.095580.0300
13:00 to 14:00 p.m.442.9400842.9900
14:00 to 15:00 p.m.360.1315675.11200
15:00 to 16:00 p.m.240.1450690.1600
16:00 to 17:00 p.m.79.6450529.6300
17:00 to 18:00 p.m.16.0210226.0100
18:00 to 19:00 p.m.-340340300.2
19:00 to 20:00 p.m.-100160600.3
20:00 to 21:00 p.m.-5555600.5
21:00 to 22:00 p.m.-5555700
22:00 to 23:00 p.m.-3535500
23:00 to 24:00 p.m.-2525500
Total production6312.99022.2
Publisher’s Note: MDPI stays neutral with regard to jurisdictional claims in published maps and institutional affiliations.

