Proceeding Paper

Array of MOX Nanowire Gas Sensors for Wastewater Management †

by
Marco Abbatangelo
1,*,
Estefanía Núñez-Carmona
1,
Veronica Sberveglieri
2,
Elisabetta Comini
1,3 and
Giorgio Sberveglieri
1,3
1
Department of Information Engineering, University of Brescia, Via Branze, 38, 25133 Brescia, Italy
2
CNNR-IBBR Institute of Biosciences and Bioresources, via Madonna del Piano, 10, 50019 Sesto Fiorentino (FI), Italy
3
NASYS srl, NASYS spin-off University of Brescia, Dep. Information Engineering, Brescia, Via Camillo Brozzoni 9, 25133 Brescia, Italy
*
Author to whom correspondence should be addressed.
Presented at the Eurosensors 2018 Conference, Graz, Austria, 9–12 September 2018.
Proceedings 2018, 2(13), 996; https://doi.org/10.3390/proceedings2130996
Published: 17 December 2018
(This article belongs to the Proceedings of EUROSENSORS 2018)

Abstract

:
Water is a common fundamental resource for life. The effects of climate change, pollution and waste make it an increasingly scarce resource. Therefore, it becomes very important to monitor water quality to identify situations of possible harm to humans. In this study, incoming wastewater of the depuration plant of A2A Ciclo Idrico in Brescia has been analyzed with an array of MOX nanowire gas sensors. In addition, GC-MS technique has been used to relate sensors responses with the emitted VOCs of the samples. The ability of the system to recognize potable water from wastewater and chemically contaminated wastewater has been found. PCA and ANN methods have been employed in order to see how samples classes cluster and to assess the capability of the device to classify them properly, respectively.

1. Introduction

Nowadays, in developed countries the access of drinking water is easy and almost guaranteed for all the people, but it is under constant threat due to uncontrolled industrial discharges that could lead to harmful microbial outbreaks [1]. Hence, frequent water quality assessment and meticulous water management are central to guarantee safe water supplies to humans and to recognize chemical and microbiological pollution.
In many situations there is a strong need of instrumentations connected on-line for real-time sewage-water analysis. This aim can be reached using chemical gas sensors since they can give information about the status of what they are analyzing in a short time. Their fields of application range from food quality control [2,3,4,5] to environmental monitoring [6] to human disease detection [7]. Their versatility is also due to the various materials that can be employed. In this study, metal oxides (MOX) gas sensors have been considered and put together in an array to analyze the complex volatile fingerprint of water and wastewater samples.
Sensors analysis has been carried forward together with Gas Chromatography coupled with Solid Phase Micro Extraction (SPME)in order to better understand the responses of sensors and to relate them to specific classes of volatile organic compounds (VOCs).

2. Materials and Methods

Experimental set-up was composed by a Small Sensor System (S3) device controlled by its own web-app, a Gas Chromatography-Mass Spectrometer with Solid Phase Micro-Extraction technology (SPME-GC/MS) (Shimadzu Gas Chromatograph GC2010 Plus, Kyoto, Japan) and a forty-two positions auto-sampler HT2000H (HTA s.r.l., Brescia, Italy). The samples used were three: potable water, wastewater and wastewater containing cyanide for a total of 42 samples. The last two of them were collected from the purification plant of A2A Ciclo Idrico in Brescia, but from different inputs. Samples containing cyanide have progressive numbers (from 14 to 18) that indicate different times of sampling. With SPME-GC/MS technique only wastewater specimens were analyzed.

2.1. GC-MS

The GC-MS-SPME tool is formed by: a solid-phase micro-extraction fiber (SPME) model DVB/carboxen/PDMS stable flex (50/30 µm), an analytical capillary column (DB-WAX, 30 m × 0.25 mm × 0.25 µm) and a single quadrupole mass spectrometer.
Vials were heated at 50 °C for 15 min. Initially, SPME fiber was used to extract the VOCs generated by the sample in the vial’s headspace. Subsequently, the fiber desorbed the VOCs into the analytical capillary column through a GC-MS’ injector at the temperature of 200 °C for 6 min. Furthermore, ultrapure helium (99.99%) was used as a carrier gas at a constant flow rate of 1.3 mL/min. In this way, VOCs were separated going through the column. Finally, VOCs were ionized and the single quadrupole mass spectrometer was able to identify the VOCs’ chemical structure.

2.2. Small Sensor System (S3)

The S3 device is designed and constructed at SENSOR Laboratory (University of Brescia, Italy) in collaboration with NASYS S.r.l., a spin-off of the University of Brescia. It is mainly composed by three parts: pneumatic pumping, electronic components and sensing chamber. The pneumatic pump allows the transfer of VOCs released from the samples to S3 sensors chamber with a constant flow of 50 sccm. In addition, a flowmeter is used as a control to continuously monitor the flow rate.
The electronic part built into the S3 device has the function of managing the synchronization between the instrument, the auto-sampler and the web-app. The thermostatic 20 mL internal volume sensing chamber represents the S3’s functional-core. It is constituted by an array of eleven different sensors, ten MOX and one commercial temperature/humidity sensor. Particularly, six nanowire MOX gas sensors (four of tin oxide, two of whom are gold catalyzed and two of copper oxide) and four RGTO-MOX gas sensors (four tin oxide, two of whom are gold catalyzed). MOX nanowires are gas sensors with a high sensitivity to a broad range of chemicals. They exhibit physical properties that are significantly different from their polycrystalline counterpart: higher degree of crystallinity, an extraordinary length-to-width ratio, resulting in enhanced sensing capability as well as long-term material stability, larger adsorption surface and the catalytic activity.
S3 analyzes the head space (HS), i.e. the volatile fraction of the samples formed when the equilibrium of the solid–liquid phase and the vapor phase of all volatile compounds is reached. This characteristic allows for a non-destructive samples analysis. In this case, the sensor base line is obtained from the air of the surrounding environment; the environmental air was filtered using a small metal cylinder (21.5 cm in length, 5 cm in diameter) filled with activated carbons.

2.3. Data Analysis

S3 results have been processed through a multivariate statistical method, Principal Component Analysis (PCA), and an Artificial Neural Network (ANN) to evaluate the classification rate of the device. Regarding GC-MS results, correlation coefficients between samples containing cyanide have been calculated to better understand the graph obtained by PCA.

3. Results and Discussion

3.1. GC-MS Results

With GC-MS technique, VOCs emitted from the two kinds of wastewater samples were found. For the ones without cyanide, 69 different compounds were discovered, 57 for the others. The most abundant compounds are shown in Table 1. Correlation coefficients have been calculated for wastewater containing cyanide in order to understand the similarity between these specimens since the concentration of the chemical contaminant was unknown. It was supposed that the sample “Cyanide 14” had the highest concentration because in that day cyanide was first found. Consequently, “Cyanide 18” has the lowest one. That is partially confirmed by the correlation coefficients: they show that the ones between “Cyanide 14” and the next two are equal to 0.76 and 0.42 respectively, while the are 0.04 and 0.01 with the last. This result can be interpreted as with the passing of time the amount of cyanide was decreased and therefore the microorganisms present were greater, producing a bigger quantity of VOCs.

3.2. S3 Results

From the ten sensors of S3, 5 features were extracted and used to characterize samples: the minimum value of resistance of SnO2, SnO2 Au+Au (heated at 400°C), SnO2 Au+Au (heated at 350°C) and the rising time of CuO. In Figure 1, PCA biplot of analyzed samples is shown. The total explained variance for the first two principal components (PC) is equal to 95.84% (83.6% for PC1 and 12.24% for PC2); this means that almost all the useful information is carried by two variables. It is possible to notice that the system is able to distinguish among potable water (in black), wastewater (in green) and four of the five wastewaters samples containing cyanide (blue, purple, orange and red groups). However, one of samples with cyanide (the yellow group) is overlapped with cluster of water, but it is important to highlight that this is only a 2D representation. The most plausible explanation is that the concentration of cyanide in that samples killed most microorganisms, reducing the amount of produced VOCs and making it more like water as regards the volatile fraction.
ANN is able to recognize 41 of the 42 samples for a classification rate equal to 97.62% taking as inputs all the five original extracted features.

Acknowledgments

We gratefully acknowledge A2A Ciclo Idrico for financial support and for providing samples.

Conflicts of Interest

The authors declare no conflict of interest.

References

  1. WHO/UNICEF Joint Monitoring Programme for Water Supply and Sanitation, WHO Library Cataloguing-In-Publication Data World Health Organization. Available online: https://sustainabledevelopment.un.org/index.php?page=view&type=400&nr=2081&menu=35 (accessed on 22 April 2018).
  2. Sberveglieri, V.; Falasconi, M.; Gobbi, E.; Carmona, E.N.; Zambotti, G.; Pulvirenti, A. Candida milleri detected by Electronic noce in tomato sauce. Procedia Eng. 2014, 87, 584–587. [Google Scholar] [CrossRef]
  3. Abbatangelo, M.; Núñez-Carmona, E.; Sberveglieri, V.; Zappa, D.; Comini, E.; Sberveglieri, G. Application of a novel S3 nanowire gas sensor device in parallel with GC-MS for the identification of rind percentage of grated Parmigiano Reggiano. Sensors 2018, 18, 1617. [Google Scholar] [CrossRef] [PubMed]
  4. Sberveglieri, V. Validation of Parmigiano Reggiano Cheese Aroma Authenticity, Categorized through the Ue of an Array of Semiconductors -Nanowire Device (S3). Materials 2016, 9, 81. [Google Scholar] [CrossRef] [PubMed]
  5. Sberveglieri, V.; Bhandari, M.P.; Carmona, E.N.; Betto, G.; Sberveglieri, G. A novel MOS nanowire gas sensor device (S3) and GC-MS-based approach for the characterization of grated parmigiano reggiano cheese. Biosensors 2016, 6, 60. [Google Scholar] [CrossRef] [PubMed]
  6. Kaushik, A.; Kumar, R.; Arya, S.K.; Nair, M.; Malhotra, B.D.; Bhansali, S. Organic–Inorganic Hybrid Nanocomposite-Based Gas Sensors for Environmental Monitoring. Chemical Reviews 2015, 115, 4571–4606. [Google Scholar] [CrossRef] [PubMed]
  7. Righettoni, M.; Amann, A.; Pratsinis, S.E. Breath analysis by nanostructured metal oxides as chemo- resistive gas sensors. Materialstoday 2015, 18, 163–171. [Google Scholar] [CrossRef]
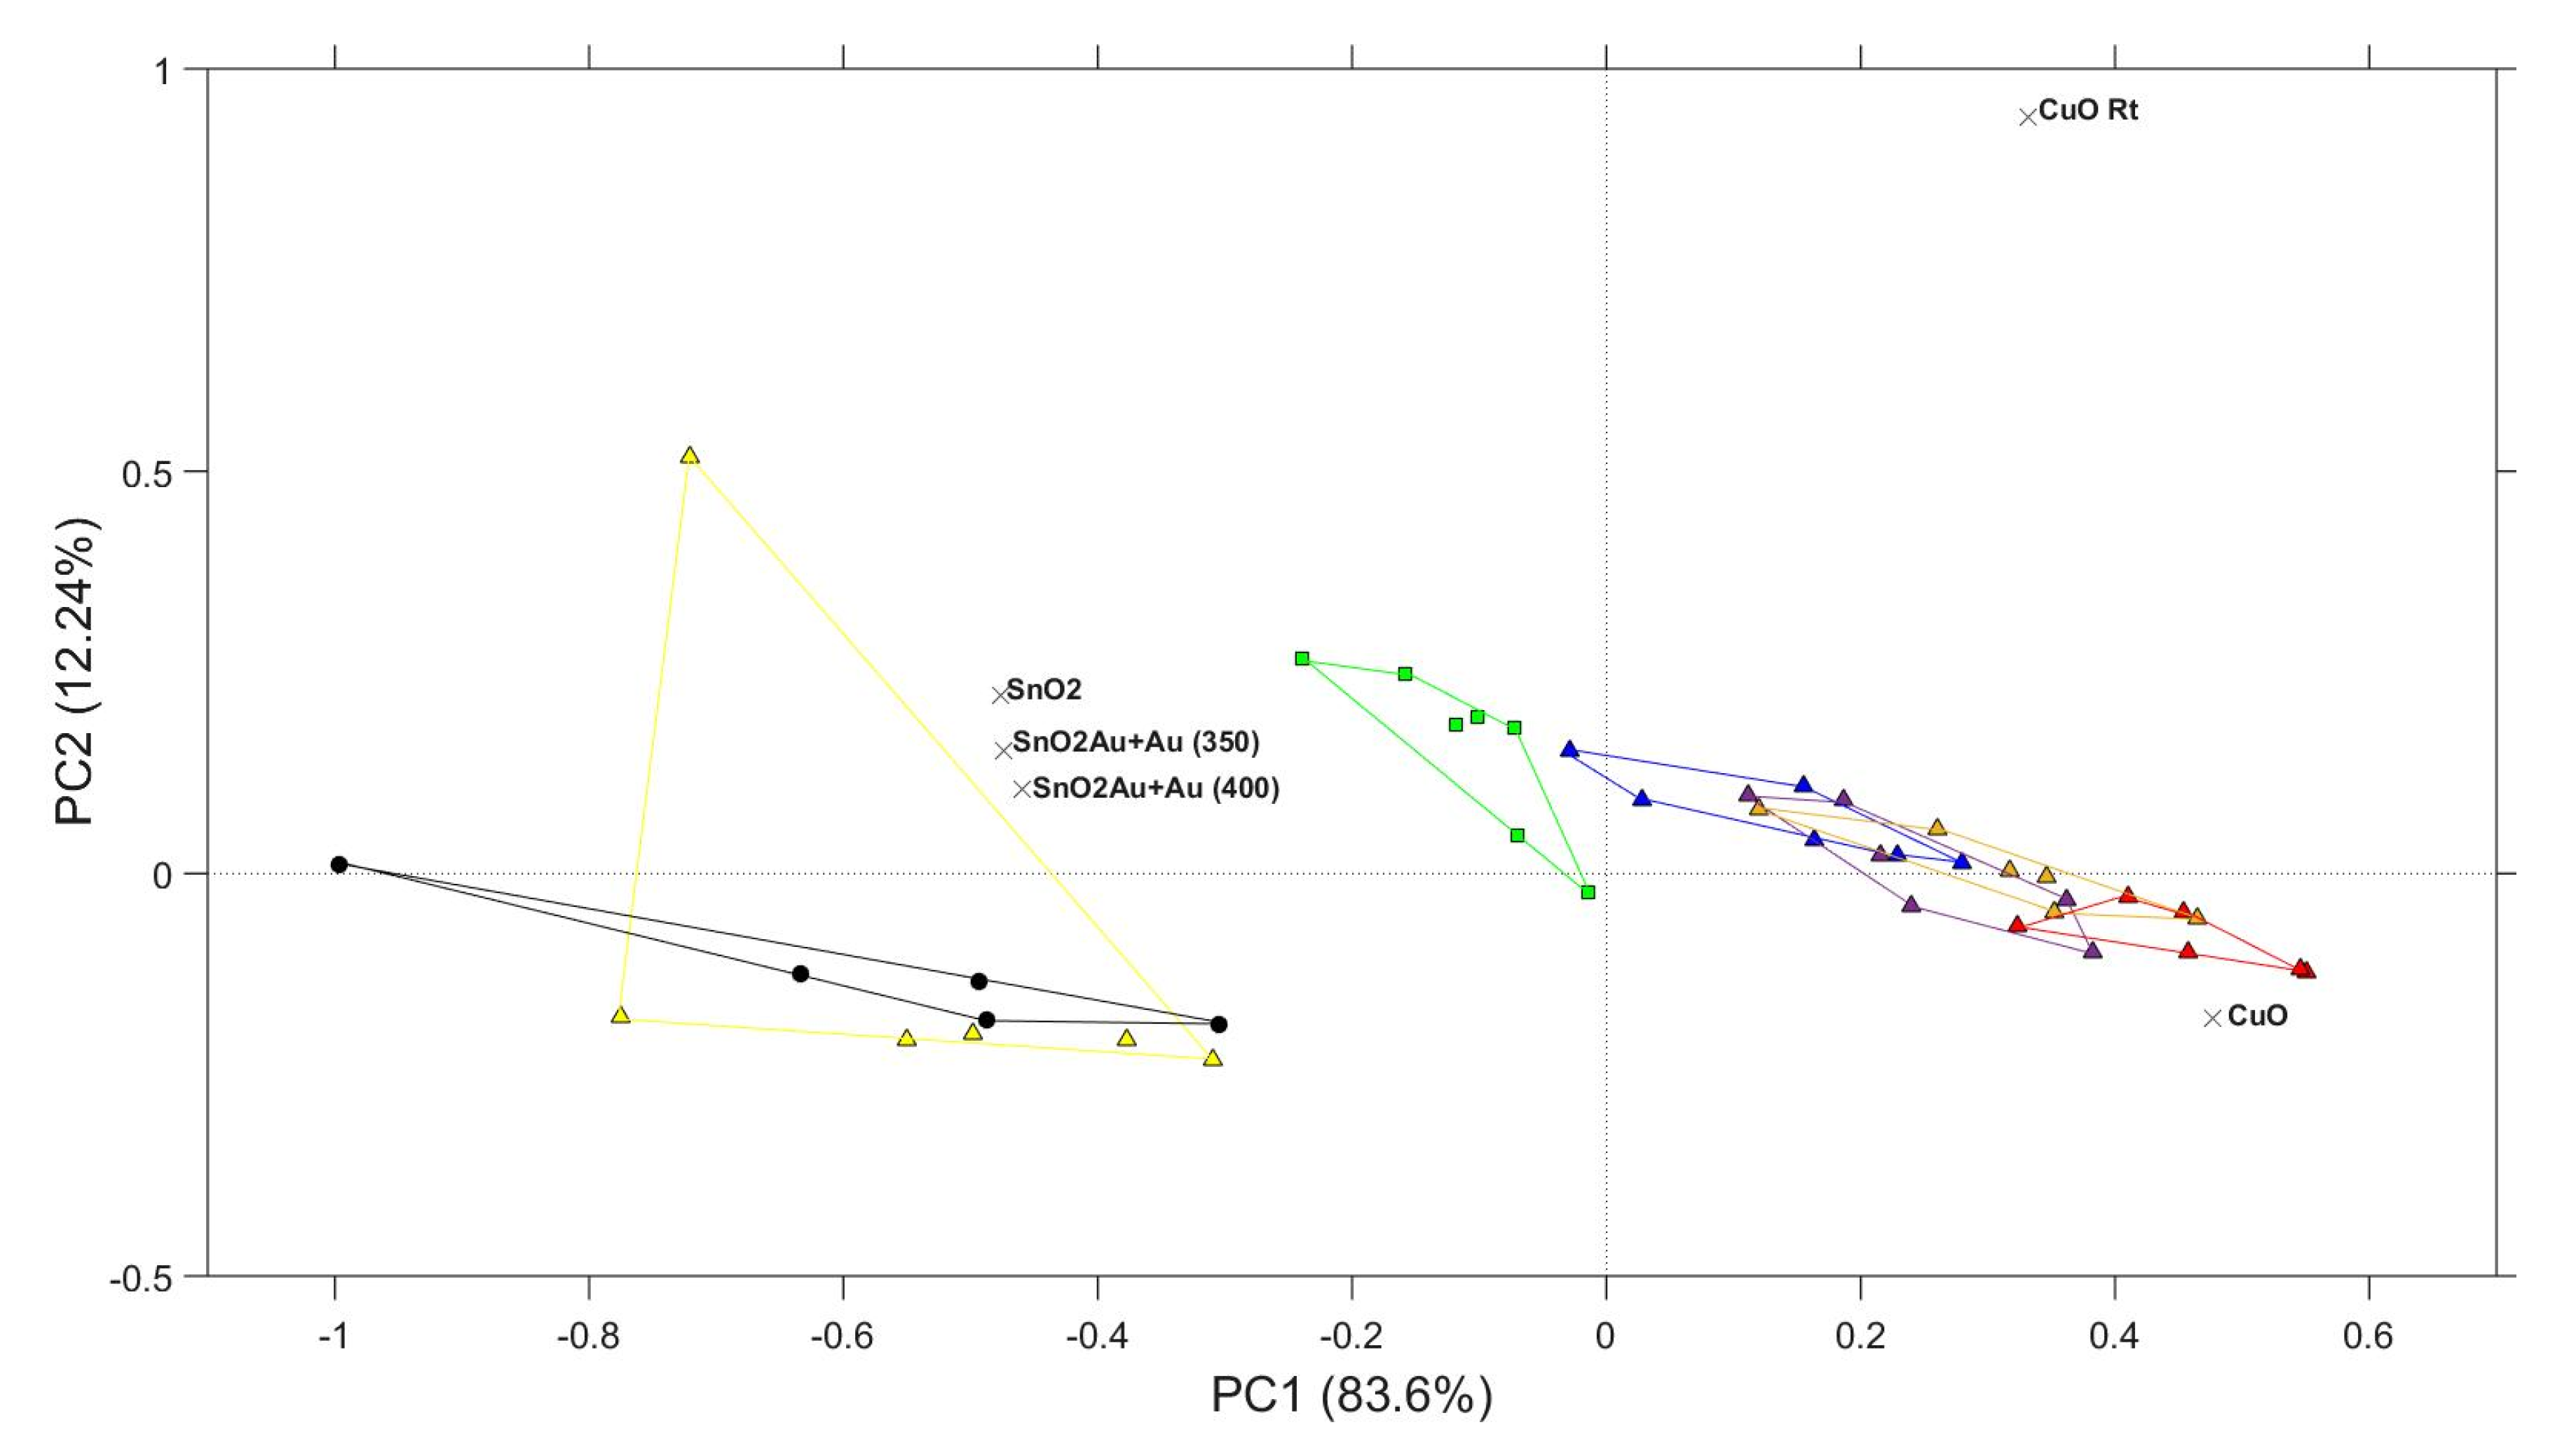
Figure 1. PCA biplot of the analyzed samples. In black water, in green wastewater, in yellow, blue, purple, orange and red wastewater with cyanide.
Proceedings 02 00996 g001
Table 1. Table showing the most representative VOCs in each sample.
SampleMost Abundant Compounds
Wastewater1-(2-methoxypropoxy)-2-propanol; 1-(2-methoxy-1-methylethoxy)-2 propanol; pentyl cyclopropane; 5-methyl-2-(1-methylethyl)-cyclohexanol; cis-(-)-2,4a,5,6,9a-hexahydro-3,5,5,9tetramethyl(1H) benzocycloheptene.
Wastewater cyanideOxime-methoxy-phenyl-; Trans-3,4-epoxyoctane; 2,5-dimethylhexane-2,5-dihydroperoxide 2,4-bis(1,1-dimethylethyl)-phenol 2,2-dimethyl-propyl ester propanoic acid
Publisher’s Note: MDPI stays neutral with regard to jurisdictional claims in published maps and institutional affiliations.