Proceeding Paper

Flow Injection Analysis with Microdialysis Probes Enable Minimally Invasive and Dynamic H2O2 Measurements †

1
Department of Biology, University of Copenhagen, 3000 Helsingør, Denmark
2
Department of Bioscience—Microbiology, University of Aarhus, 8000 Aarhus, Denmark
3
Climate Change Cluster, University of Technology Sydney, Sydney, NSW 2007, Australia
*
Authors to whom correspondence should be addressed.
Presented at the Eurosensors 2018 Conference, Graz, Austria, 9–12 September 2018.
Proceedings 2018, 2(13), 992; https://doi.org/10.3390/proceedings2130992
Published: 17 December 2018
(This article belongs to the Proceedings of EUROSENSORS 2018)

Abstract

:
This paper describes the optimization of a published flow injection analysis system coupled with microdialysis probes (MDP-FIA) for in-situ sampling and online measurements of hydrogen peroxide (H2O2). By modifying the commonly used Na2CO3 buffer by addition of EDTA and a changed order in reagent injection, interfering transition metals such as Fe(II) and Fe(III) are complexed and removed from the system without interfering with the chemiluminescent reaction of the used acridinium ester and H2O2. The system was then used to monitor changes in H2O2 concentration upon microwaving seawater and filtered seawater in the presence and absence of agar.

1. Introduction

Reversible, optical hydrogen peroxide (H2O2) sensors are in high demand to understand dynamic processes and gradients in biological and biomedical systems. However, to date there is to the best of our knowledge no fully reversible, fast responding, selective optical, hydrogen peroxide sensor. Many frequently used systems show cross-sensitivities or are irreversible, which needs to be taken into consideration when analyzing data [1]. We recently described a novel combination of flow injection analysis (FIA) with microdialysis probes (MDP) for H2O2 detection [2] together with a cross-sensitivity study of the chemiluminescent reagent, an acridinium ester, previously regarded as selective for H2O2 apart from pH, temperature and Fe(II) [3,4]. However, we showed additional cross-sensitivities of e.g., Fe(III) and precipitation issues when analyzing seawater. Therefore, further optimizations were conducted which are described in more detail in this paper. Additionally, it was shown that H2O2 is formed when microwaving seawater in varying concentrations depending on the absence and presence of agar and depending on filtration.

2. Materials and Methods

A FIA system (FeLume, Waterville Analytical) was coupled to a 1 mm MDP (CMA 7, metal free, cuprophane with a 6 kDa cut-off; CMA, Harvard Apparatus). The set-up was used according to literature [2], with the following modifications (Figure 1a): The inlet line for the chemiluminescent reagent was exchanged with the inlet line of the Na2CO3 buffer; thus the acridinium ester is mixed with the pH buffered sample in the flow cell and not before. EDTA was added to the 0.1 M Na2CO3 buffer to result in a 10 mM EDTA solution. The pH was readjusted to pH 11.3 by a NaOH solution (MilliQ was catalase treated for at least 30 min before NaOH tablets were dissolved to prepare the base). In order to flush the system, the carrier solution as well as the “acid wash tube” were flushed with a pH 11.3 Na2CO3 solution (instead of catalase treated MilliQ and a 0.01 M HCl solutions), in order to transport the sample through the system, remove the EDTA complexes and have a baseline value measured at the same pH as the sample.

3. Results

3.1. Set-Up and Calibration with and without EDTA

In order to visualize the effect of adding 10 mM EDTA to the buffer solution, a calibration curve was measured with and without EDTA in the enriched seawater medium F2 using direct injection into the FIA system. In this case, the sample tube is guided via the peristaltic pump as well, instead of the syringe pump and has no MDP attached. Direct injection was used as it is faster due to shorter loading times, and interfering effects are more pronounced as potentially interfering species are not diffusion limited by the MDP membrane. A third measurement was done in MilliQ water treated with NaCl to achieve the same salinity as in the F2 medium. Thus, the only difference between the used solutions is the dissolved ion-content (Figure 1b).

3.2. Microwave and Agar Effects on H2O2 Concentrations

3 glass containers were filled with 20 mL of seawater (SW) and 3 glass containers were filled with 20 mL filtered seawater (FSW). Agar was added to one container of each seawater type resulting in a final concentration of 1 wt %. All solutions, apart from one SW and one FSW sample, were microwaved for the same amount of time (until the agar dissolved) and then left to cool to room temperature. H2O2 was measured using a 1 mm MDP in the unstirred SW and FSW as well as submerged in the agar. Results are shown in Figure 2.

4. Discussion

The addition of EDTA to the buffer solution has various benefits. On the one hand, it removes species which might interfere with the chemiluminescent reaction by complexing them, and on the other hand it stabilizes the H2O2 in solution, as it removes transition metals which might otherwise react with it. The steep increase in the calibration curve upon addition of EDTA might also indicate a catalyzing effect of the reaction with the chemiluminescent reagent, a possibility which is currently further investigated.
Filtration of the seawater reduced the measured H2O2 concentration from approx. 600 nmol L−1 (SW) to 60 nmol L−1 FSW). Microwaving SW resulted in an increase to ~3 µmol L−1, whereas FSW showed an increase to 600 nmol L−1. A possible explanation could be bacteria in the seawater, which release H2O2 as stress-response to the temperature increase caused by microwaving, which might also inactivate potential catalase activity. Microwaving the SW/agar solution resulted in an increase to ~7 µmol L−1, while FSW/agar showed an increase to ~2.7 µmol L−1. Why the increase in H2O2 concentration is even higher after microwaving the (F)SW sample together with agar is not fully understood and will be further investigated. Similar effects have been observed previously for autoclaving LB-growth medium, which showed after a 1 + 4 dilution still a H2O2 concentration of almost 20 µmol L−1 [2], and for autoclaving agar together with phosphate buffer, which resulted in a phosphate buffer dependent increase of H2O2 [5].

5. Conclusions

Introducing EDTA in the measuring setup increased measured signal intensities and minimized interfering effects on the chemiluminescent reaction by transition metals such as Fe(II) and Fe(III) via complexing with EDTA. It also stabilized the recovered H2O2, as complexed transition metals are hindered from reacting with it. Additionally, EDTA complexes Ca(II) as well as Mg(II), which prevents the formation and precipitation of hydroxides at the working pH of 11.3, which can cause blockage in the FIA system leading to back pressure and unstable signals due to changing flow speeds.
The system was changed accordingly to support the added EDTA and was tested on the enriched seawater medium F2, showing only minimal differences in comparison to a pure NaCl-solution. Thus, it was possible to apply it on seawater samples, ruling out interferences from freely available transition metals. The system was then used to measure the effect of microwaving (filtered) seawater samples without and together with agar (1wt %). We were able to show that filtration of the SW sample reduces present H2O2 (600 nmol L−1 (SW) to 60 nmol L−1 (FSW)); however, in both cases microwaving increased the found concentration significantly (3 µmol L−1 (SW) and 600 nmol L−1 (FSW)). Microwaving the agar solutions had an even stronger impact resulting in found concentrations of up to 2.7 µmol L−1 (FSW) and 7 µmol L−1 (SW). These findings need to be investigated further, but should be kept in mind when working with agar and cultures sensitive to H2O2, or when interpreting H2O2 production.

Author Contributions

M.M. outlined the paper with editorial input from K.K. and M.K. Experiments were planned and conducted by M.M., K.K. and M.K.

Funding

This study was funded by a Sapere-Aude Advanced grant from the Danish Research Council for Independent Research|Natural Sciences (M.K.), a grant by the Danish Research Council for Independent Research|Technical and Production Sciences (M.M., K.K., M.K.).

Acknowledgments

Sofie L. Jakobsen is thanked for technical assistance. Dirk de Beer is thanked for his help during the experiments and constructive discussions. Imre Vass is thanked for fruitful discussions and his suggestion to implement the use of EDTA in the measuring protocol.

Conflicts of Interest

The authors declare no conflict of interest.

References

  1. Moßhammer, M.; Kühl, M.; Koren, K. Possibilities and Challenges for Quantitative Optical Sensing of Hydrogen Peroxide. Chemosensors 2017, 5, 28. [Google Scholar] [CrossRef]
  2. Moßhammer, M.; Schrameyer, V.; Peter, Ø.; Koren, K.; Kühl, M. Extracellular Hydrogen Peroxide Measurements Using a Flow Injection System in Combination with Microdialysis Probes—Potential and Challenges. Free Radic. Biol. Med. 2018, 1–13. [Google Scholar] [CrossRef] [PubMed]
  3. King, D.W.; Cooper, W.J.; Rusak, S.A.; Peake, B.M.; Kiddle, J.J.; Sullivan, D.W.O.; Melamed, M.L.; Morgan, C.R.; Theberge, S.M. Flow Injection Analysis of H2O2 in Natural Waters Using Acridinium Ester Chemiluminescence: Method Development and Optimization Using a Kinetic Model. Anal. Chem. 2007, 79, 4169–4176. [Google Scholar] [CrossRef] [PubMed]
  4. Miller, G.W.; Morgan, C.A.; Kieber, D.J.; King, D.W.; Snow, J.A.; Heikes, B.G.; Mopper, K.; Kiddle, J.J. Hydrogen peroxide method intercomparison study in seawater. Mar. Chem. 2005, 97, 4–13. [Google Scholar] [CrossRef]
  5. Tanaka, T.; Kawasaki, K.; Daimon, S.; Kitagawa, W.; Yamamoto, K.; Tamaki, H.; Tanaka, M.; Nakatsu, C.H.; Kamagata, Y. A hidden pitfall in the preparation of agar media undermines microorganism cultivability. Appl. Environ. Microbiol. 2014, 80, 7659–7666. [Google Scholar] [CrossRef] [PubMed]
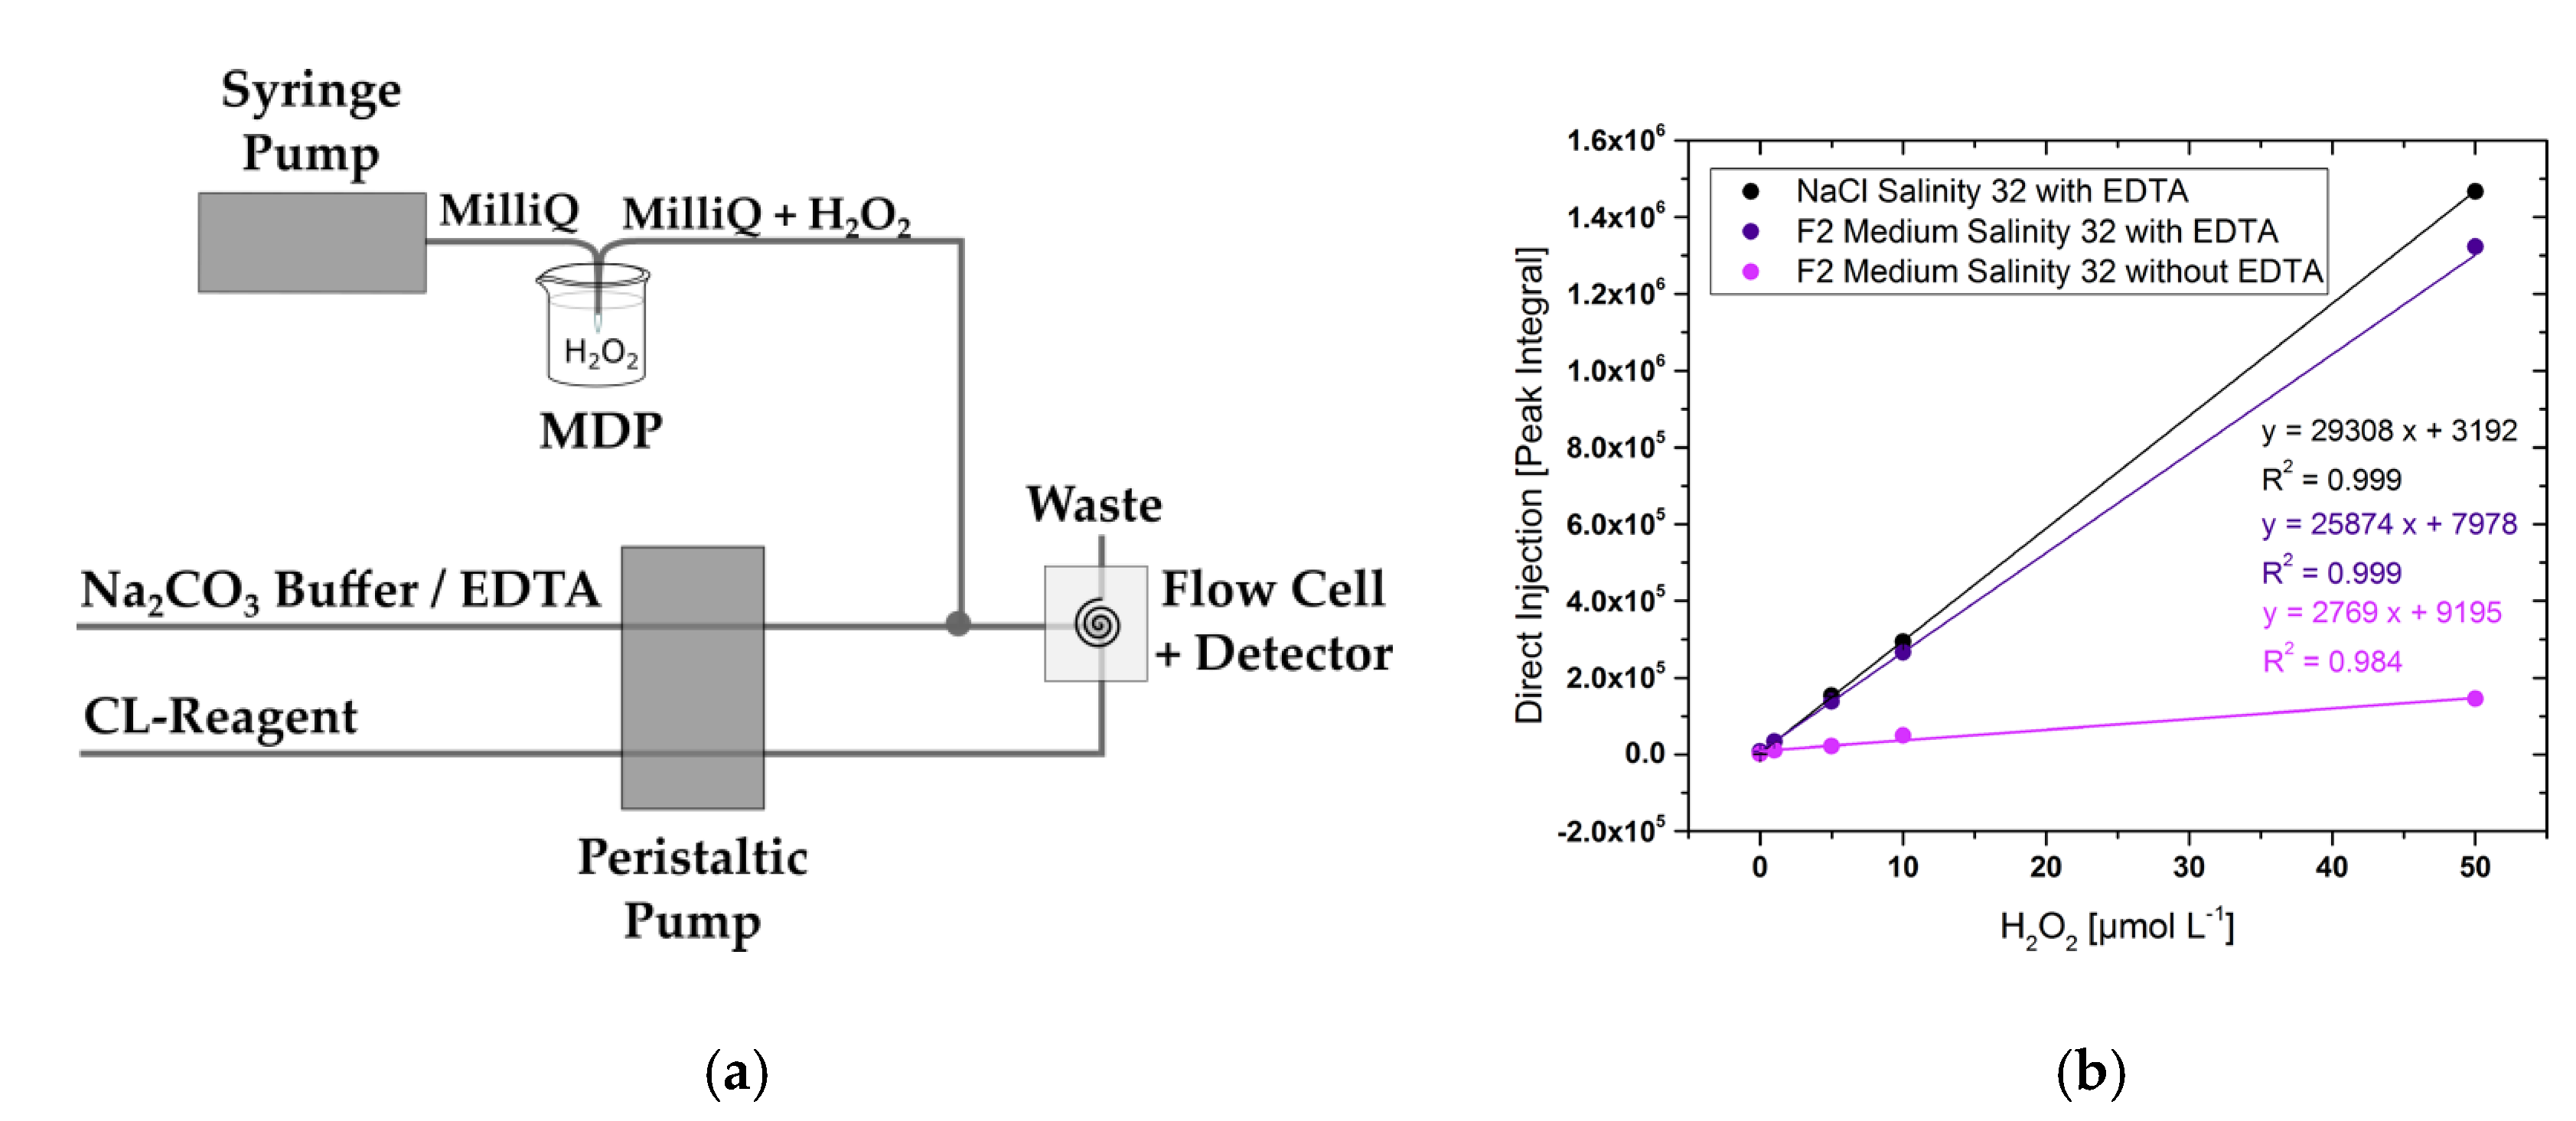
Figure 1. (a) Measuring set-up for H2O2 measurements (modified from the original setup in Moßhammer et al. 2018 [2]) allowing the introduction of EDTA to the FIA system. The perfusion fluid is transported by the syringe pump through the microdialysis probe (MDP) were analytes such as H2O2 can diffuse in. The enriched perfusion fluid is subsequently mixed with the EDTA in the carbonate buffer to remove interfering species and adjust the pH. Afterwards the solution is mixed with the acridinium ester resulting in chemiluminescence in the presence of H2O2. (b) The graph shows three calibration curves obtained by using the flow injection system without the MDP but by directly injecting the sample solution. Calibration curve without EDTA in the original set up [2] of the enriched seawater medium F2 (light purple, n = 1), a calibration curve of the F2 medium using the set-up shown in (a) in combination with EDTA (dark purple, n = 3), and the calibration curve in a NaCl-solution adjusted to the same salinity as the F2 medium (32) using EDTA (black, n = 3).
Proceedings 02 00992 g001
Figure 2. H2O2 measurement of seawater (SW) and filtered seawater (FSW) as well as effects of microwaving SW (MW SW) and FSW (MW FSW) on the H2O2 concentration in solution in the absence and presence of agar (1 wt %). All samples were measured three times (n = 3).
Proceedings 02 00992 g002
Publisher’s Note: MDPI stays neutral with regard to jurisdictional claims in published maps and institutional affiliations.