1. Introduction
Combustion analysis is of high necessity to reduce undesirable and toxic exhaust emissions. A number of air pollutants are released from industrial facilities and transportation with fuel-driven engines, harming human health and the environment [
1,
2,
3,
4]. Worldwide federal and state laws govern the permitted emission rates of the toxic compounds and are controlled by the federal Environmental Protection Agency (EPA) [
4]. Combustion analysis is performed to monitor toxic and acid rain forming emissions in order to meet these strict federal, state and local regulations [
4]. However, a low-cost combustion gas emission monitoring system with a sensitivity below 1 ppm at continuous gas flow and in harsh environments is still not available.
In this paper, we present the development of a low-cost, resonant photoacoustic gas-monitoring device.
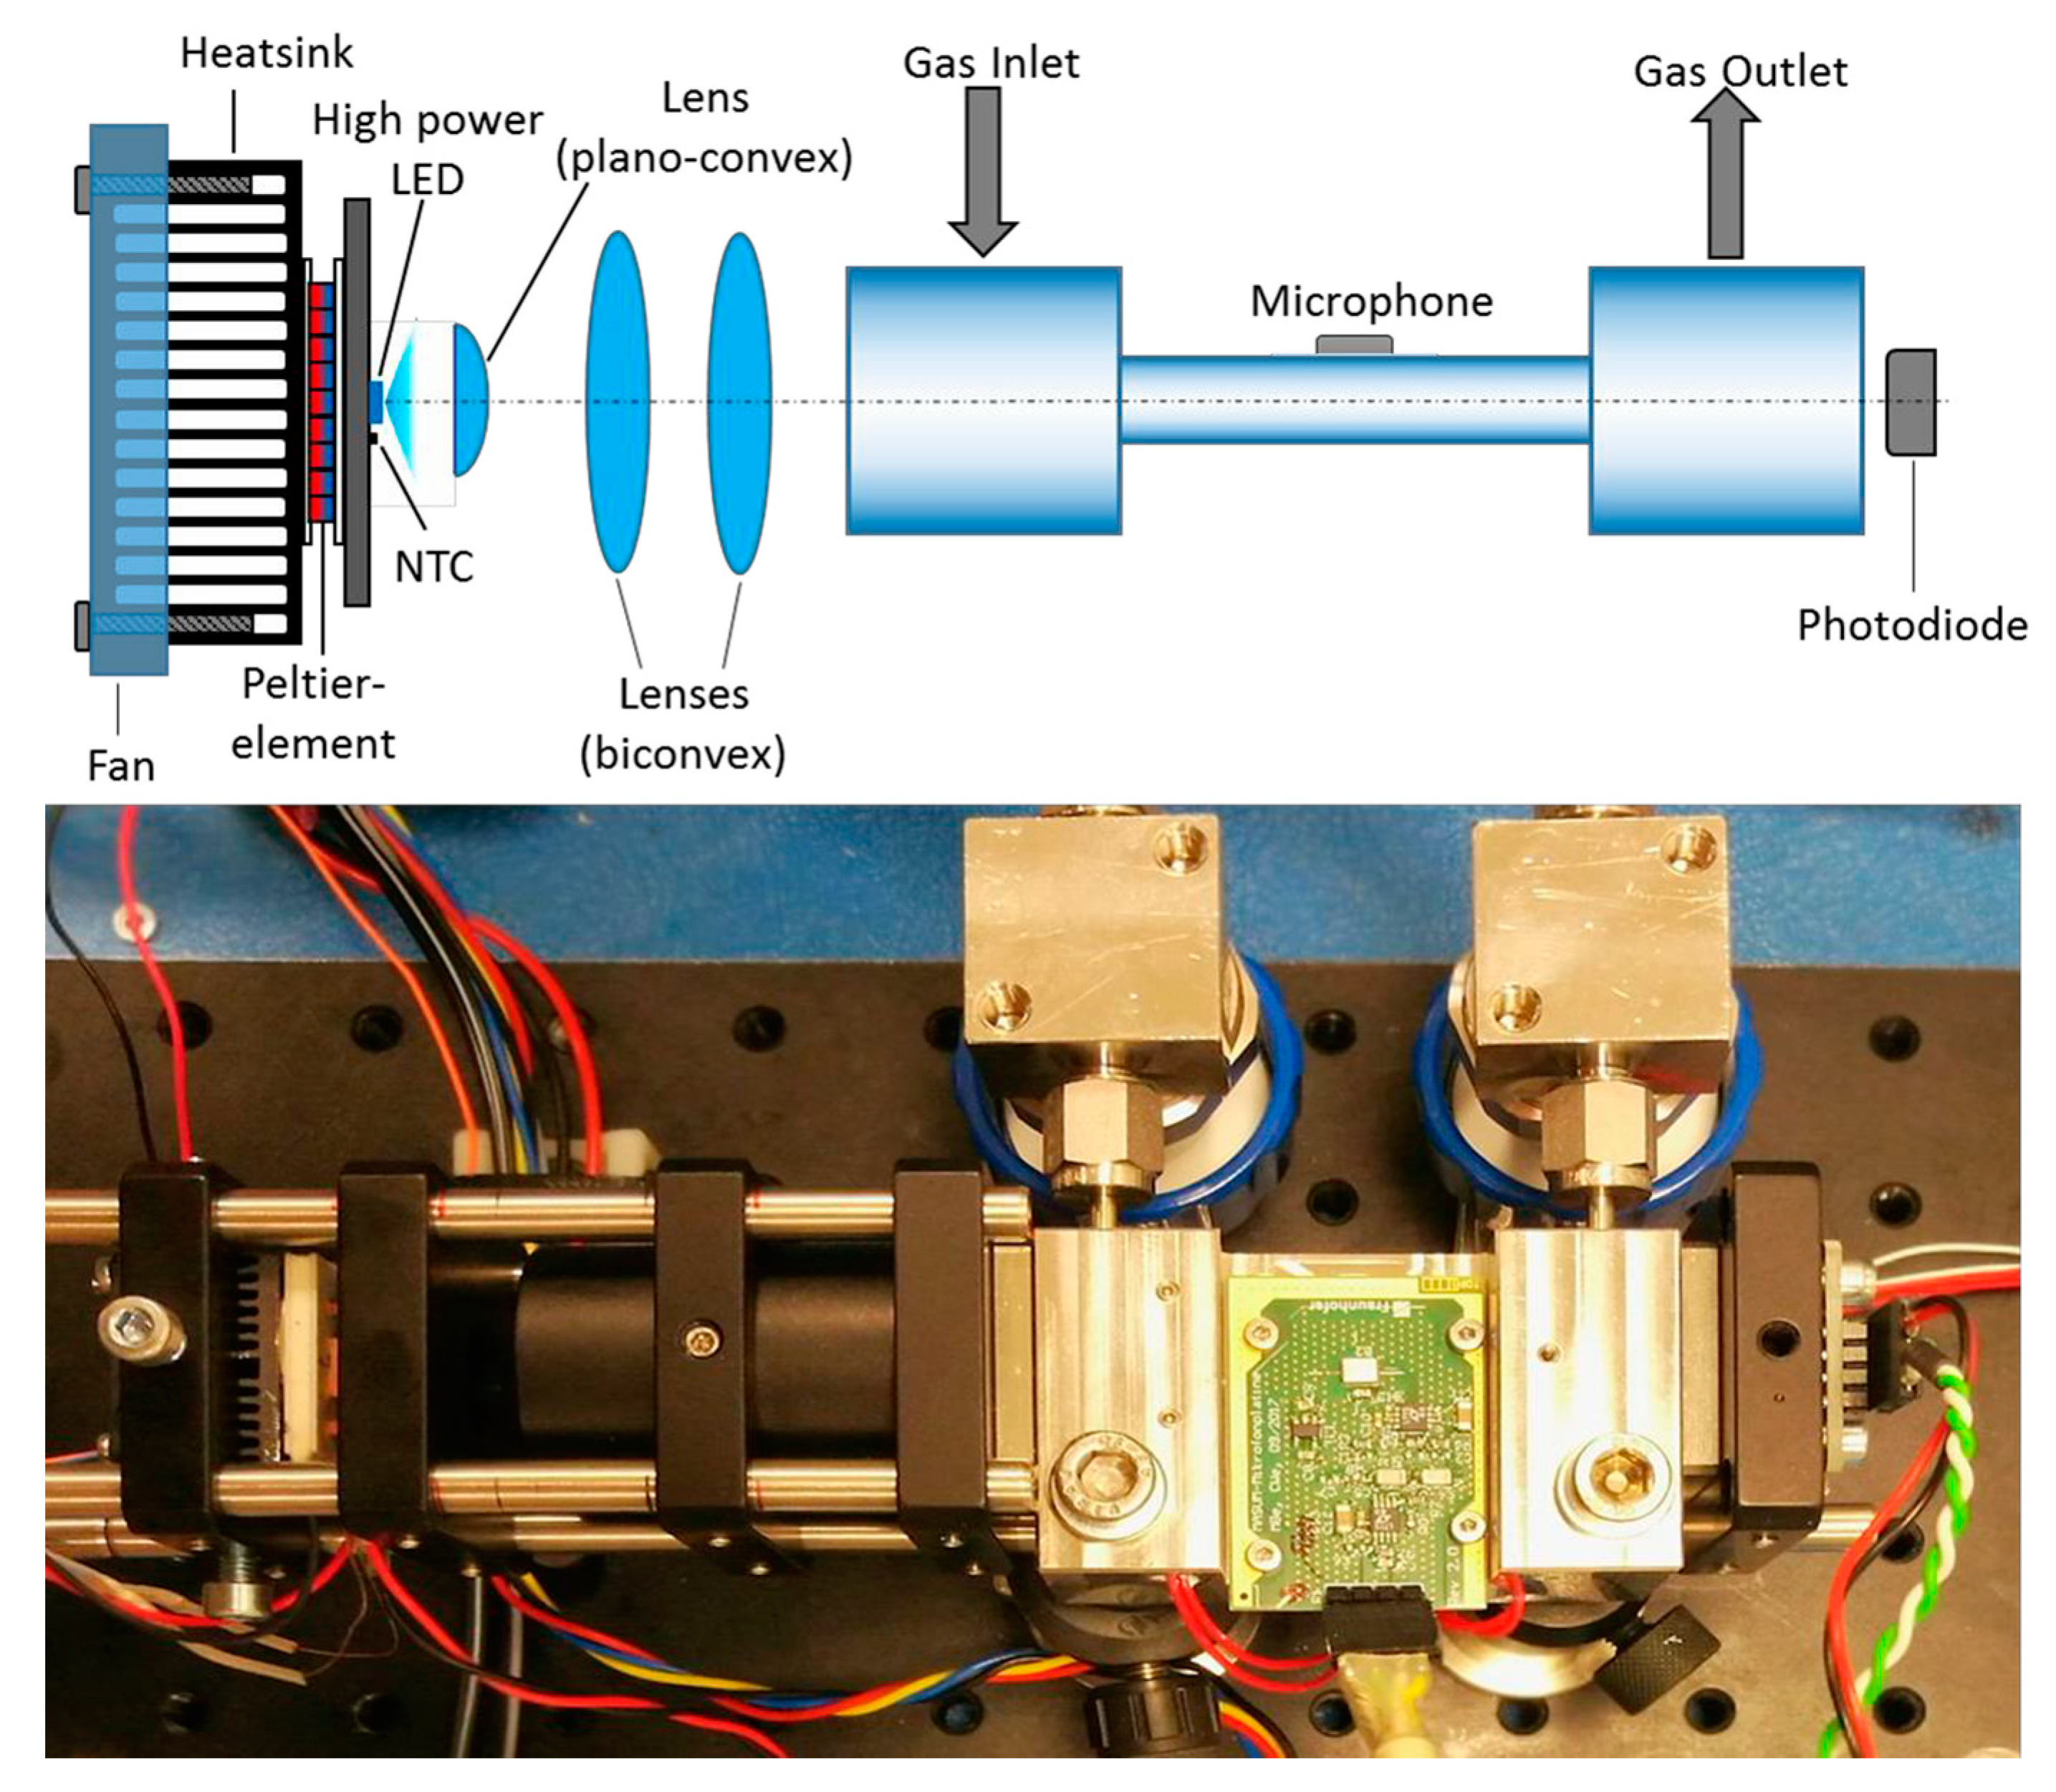
2. Material and Methods
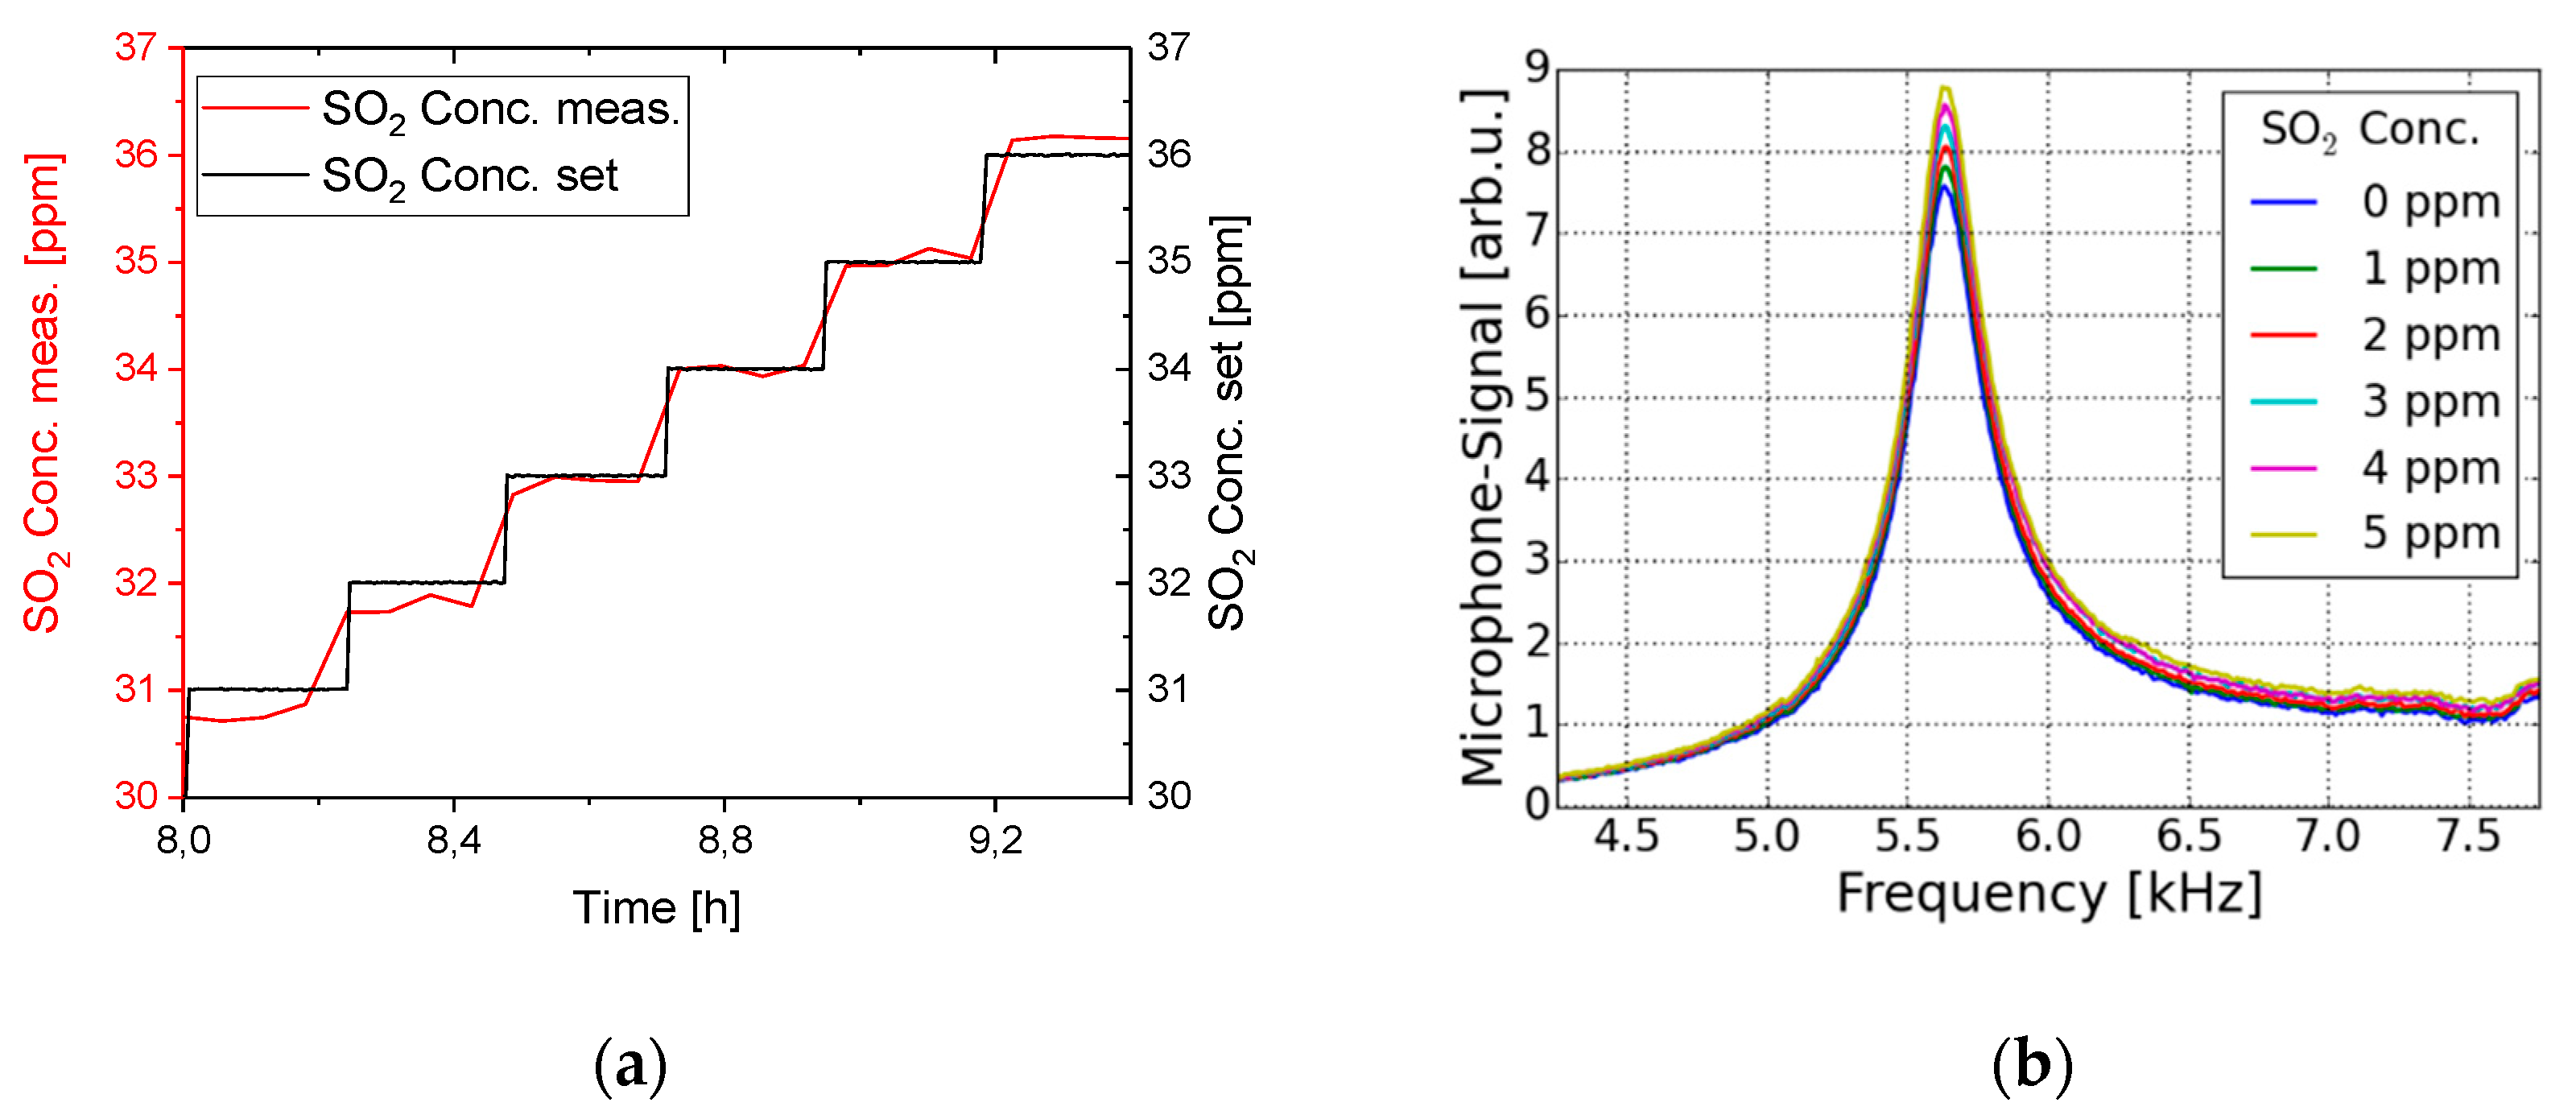
Photoacoustic gas sensors detect the pressure waves that were generated directly by the absorbed energy of the light [
5]. Gas molecules in the ground state are excited when light with a wavelength coinciding with an absorption band of the molecules is absorbed [
6]. The molecules start to oscillate in the excited state, which induces a heating of the gas volume in the measurement cell. Due to the proportionality of the temperature and the pressure within a constant volume, an increase of the gas temperature results in an increase of the pressure within the gas cell. A modulation of the light causes a frequent change of pressure within the gas-filled measurement cell. This pressure change can be detected by a microphone and corresponds to the photoacoustic signal (PAS).
The sensitivity of a photoacoustic system is strongly influenced by the construction of the photoacoustic cell [
6]. At non-resonant operation, the light modulation frequency is far below the lowest resonance frequency of the cell, where no signal amplification takes place [
6]. When the exciting light is modulated at a resonance frequency of the gas cell, the generated photoacoustic signal is amplified which leads to a higher signal-to-noise ratio and a higher sensitivity compared to the non-resonant operation [
7]. For a further reduction of surrounding acoustic noise, a cylindrical buffer structure (acts as acoustic filter) is attached to both sides of a much narrower cylindrical acoustic resonator [
5].
A stainless steel measurement cell is designed and developed for first experimental tests. The diameter of the cylindrical buffer volumes is set to 12 mm while the diameter of the cylindrical resonator is fixed to 3 mm. The resonance frequency of the first longitudinal Eigenmode in a cylindrical resonator is set to 5 kHz to reduce the influences of low-frequented noise on the generated acoustic signal. A detailed explanation for adapting the radius and length of the photoacoustic cylindrical resonator to a specific resonance frequency can be found in [
7].
Due to the wide emission angle of the used LED, the beam only partially enters into the resonator. An additional optical system consisting of one plano-convex and two biconvex lenses is placed in front of the gas cell window to focus a higher amount of photons into the measurement chamber. By reducing the beam width, a clear sensitivity increase was observed. An overview of the system components and a schematic drawing are shown in
Figure 1.
The high power LED produces a significant amount of heat, which would lead to an increase in temperature and eventually to a wavelength drift of the LED. Therefore, an external temperature controller (connected with a thermistor (NTC) as sensor and a Peltier element as cooling device) stabilizes the temperature of the light source. The LED and the temperature stabilization system are placed in front of the gas cell window. The LED is electrically modulated with a square wave-like function (50% duty cycle).
When the target gas is located in the gas cell, the light of the respective LED gets absorbed and an acoustic wave is generated and detected by the microphone. The used MEMS microphone is placed in the middle of the resonator for maximum acoustic signal generation. The detected signal is converted into an electronic signal which is further amplified. Moreover, the measurement signal gets isolated from surrounding noises through a lock-in amplifier and analyzed by subsequent analysis electronics. A photo diode is placed at the light outlet of the measurement cell to monitor the performance of the high power LED.
3. Results
First tests of the developed system were carried out with the toxic SO
2 at the UV region. The high-power LED source emits light at a center wavelength of 285 nm. Using a continuous gas flow of 200 mL/min 1 ppm SO
2 concentration steps are measured.
Figure 2a,b show the obtained results of the developed photoacoustic sensor. In
Figure 2a the set and the evaluated concentrations are shown in a range between 30 and 37 ppm. The concentration is a function of the peak height of the measured resonance curve shown in
Figure 2b. To obtain this value the theoretical curve of an external driven harmonic oscillator was fitted to the raw data.
4. Conclusions
Highly sensitive laser-based photoacoustic detection of toxic gases has been the focus of research in the last few years. In [
8], Gondal et al. achieved a lowest SO2 detection limit of 328 parts per trillion by volume at a laser wavelength of 300 nm and 1.3 parts per billion by volume (ppbv) at a wavelength of 225.7 nm. Using expensive lasers is one of the main hurdles for commercializing laser-based photoacoustic gas detectors.
Based on that, the development of a low-cost and very sensitive detector was the main focus of this research. The system presented in this work achieved a measurement resolution of 1 ppm within the concentration range of 0 to 50 ppm SO2 in a nitrogen matrix. Such an inexpensive photoacoustic gas detectors can be useful in combustion analysis and specifically monitoring the actually emitted amount of toxic gases.
With further research focusing on the optimization of the optical system and the geometry of the gas cell, a lower detection limit of less than 0.1 ppm should be achievable.
Author Contributions
J.W. and B.W. conceptualized the project; H.-F.P. and K.S. conceived and designed the experiments; M.E.-S. and M.D. performed the experiments and analyzed the data; C.W. developed the software and electronics; M.E.-S. and H.-F.P. wrote the paper. All authors have read and agreed to the published version of the manuscript.
Funding
This research was funded by the European Commission/German Federal Ministry of Education and Research grant number E! 9727-MASUM.
Acknowledgments
The authors thank Andre Eberhardt, Gerd Sulz and Ulrich Ulmer for the fruitful technical discussions.
Conflicts of Interest
The authors declare no conflict of interest. The founding sponsors had no role in the design of the study; in the collection, analyses, or interpretation of data; in the writing of the manuscript, and in the decision to publish the results.
References
- International Energy Outlook 2017, U.S. Energy Information Administration, Report Number: DOE/EIA- 0484(2017). Available online: https://www.eia.gov/outlooks/ieo/ (accessed on 13 April 2018).
- Overview of Greenhouse Gases, Greenhouse Gas Emissions, United States Environmental Protection Agency. Available online: https://www.epa.gov/ghgemissions/overview-greenhouse-gases (accessed on 13 April 2018).
- Chen, T.M.; Gokhale, J.; Shofer, S.; Kuschner, W.G. Outdoor air pollution: Nitrogen dioxide, sulfur dioxide, and carbon monoxide health effects. Am. J. Med. Sci. 2007, 333, 249–256. [Google Scholar] [CrossRef] [PubMed]
- Combustion Analysis Basics—An Overview of Measurements, Methods and Calculations Used in Combustion Analysis. Available online: http://www.tsi.com/uploadedFiles/Product_Information/Literature/Handbooks/CA-basic-2980175.pdf (accessed on 4 July 2018).
- Schmid, T. Photoacoustic spectroscopy for process analysis. Anal. Bioanal. Chem. 2006, 384, 1071–1086. [Google Scholar] [CrossRef] [PubMed]
- Bozóki, A.; Pogány, A.; Szabó, G. Photoacoustic Instruments for Practical Applications: Present, Potentials, and Future Challenges. Appl. Spectrosc. Rev. 2011, 46, 1–37. [Google Scholar] [CrossRef]
- Miklós, A.; Hess, P.; Bozóki, Z. Application of acoustic resonators in photoacoustic trace gas analysis and metrology. Rev. Sci. Instrum. 2001, 72, 1937–1955. [Google Scholar] [CrossRef]
- Gondal, M.A.; Mastromarino, J. Pulsed laser photoacoustic detection of SO2 near 225.7 nm. Appl. Opt. 2001, 40, 2010–2016. [Google Scholar] [CrossRef] [PubMed]
| Publisher’s Note: MDPI stays neutral with regard to jurisdictional claims in published maps and institutional affiliations. |
© 2018 by the authors. Licensee MDPI, Basel, Switzerland. This article is an open access article distributed under the terms and conditions of the Creative Commons Attribution (CC BY) license (https://creativecommons.org/licenses/by/4.0/).