1. Introduction
Bulk optodes allow selective and non-destructive analysis [
1]. Very often optodes are made of hydrophobic materials incorporating lipophilic indicators. The protonated and deprotonated forms of the indicator differ in their optical properties thus making the change in protonation degree in the sensor recordable. Ionophores, capable of selective complexation with the analyte, and lipophilic ionic additives are also immobilized in the polymeric matrix. The optical signal is determined by an ion-exchange between the optode and the solution. In case of the bulk sensors, the whole sensing phase is equilibrated with the aqueous sample. This process is under diffusion control, which often makes the sensor response unacceptably long [
2]. Yet, it has never been questioned how the response changes if the signal is recorded prior to the equilibrium.
Digital cameras and scanners are widely used to record the optode signal [
1]. However, the quantitative color processing is lacking reliable criteria for choosing suitable camera and the right color space for digital color analysis (DCA). DCA typically implies color correction [
3]. Commonly utilized white (gray) standards differ in their surface optical properties from the sensing films and do not correspond to the color transition of the sensor, which makes color balance less adequate. Furthermore, existing color standards differ in the way of fabrication from the sensing units of an array. This fact is significant for the large-scale production of multi-analyte optode-based platforms.
Here we summarize our efforts aimed at developing a number of non-conventional approaches for signal acquisition and processing with ion-selective optical sensors (bulk optodes).
2. Materials and Methods
Chromoionophores III (ETH5350), VIII (TPBE), VII (ETH5418), II (ETH2439); Na ionophore VI, Pb ionophore IV; cation exchanger NaHFPB, lipophilic salt tetrabutylammonium tetrabutylborate (TBATBB), plasticizer bis(2-ethylhexyl) sebacate (DOS), poly(vinyl chloride) (PVC) were from Fluka, Switzerland. Aqueous solutions were prepared with deionized water buffered with 0.01M of 4-(2-hydroxyethyl)-1-piperazineethanesulfonic acid (HEPES). The pH of the samples was controlled with glass pH electrode. Optode compositions were obtained by dissolving appropriate quantities of the active components, PVC and DOS (1:2 by weight) in tetrahydrofuran.
Optode films were prepared from the liquid composition a) by drop-casting from the micropipette into the wells drilled in a glass slide; b) by spin-coating a white plastic support. The signal was registered (a) by photographing the optodes with digital color camera coupled with stereomicroscope; (b) with monochrome camera; (c) spectrophotometrically with UV-VIS spectrophotometer. The images were processed with ImageJ freeware. The color components were normalized to the respective intensities of the custom made gray or other standard. The ratio of the normalized intensities was an analytical signal. The data from 4-6 replica optodes were collected.
3. Results and Discussion
3.1. Bulk Optodes Operating in Non-Equilibrium Mode
The response time of a bulk optode and can be expressed as the time corresponding to 95% of the signal change after immersion into the solution [
2].
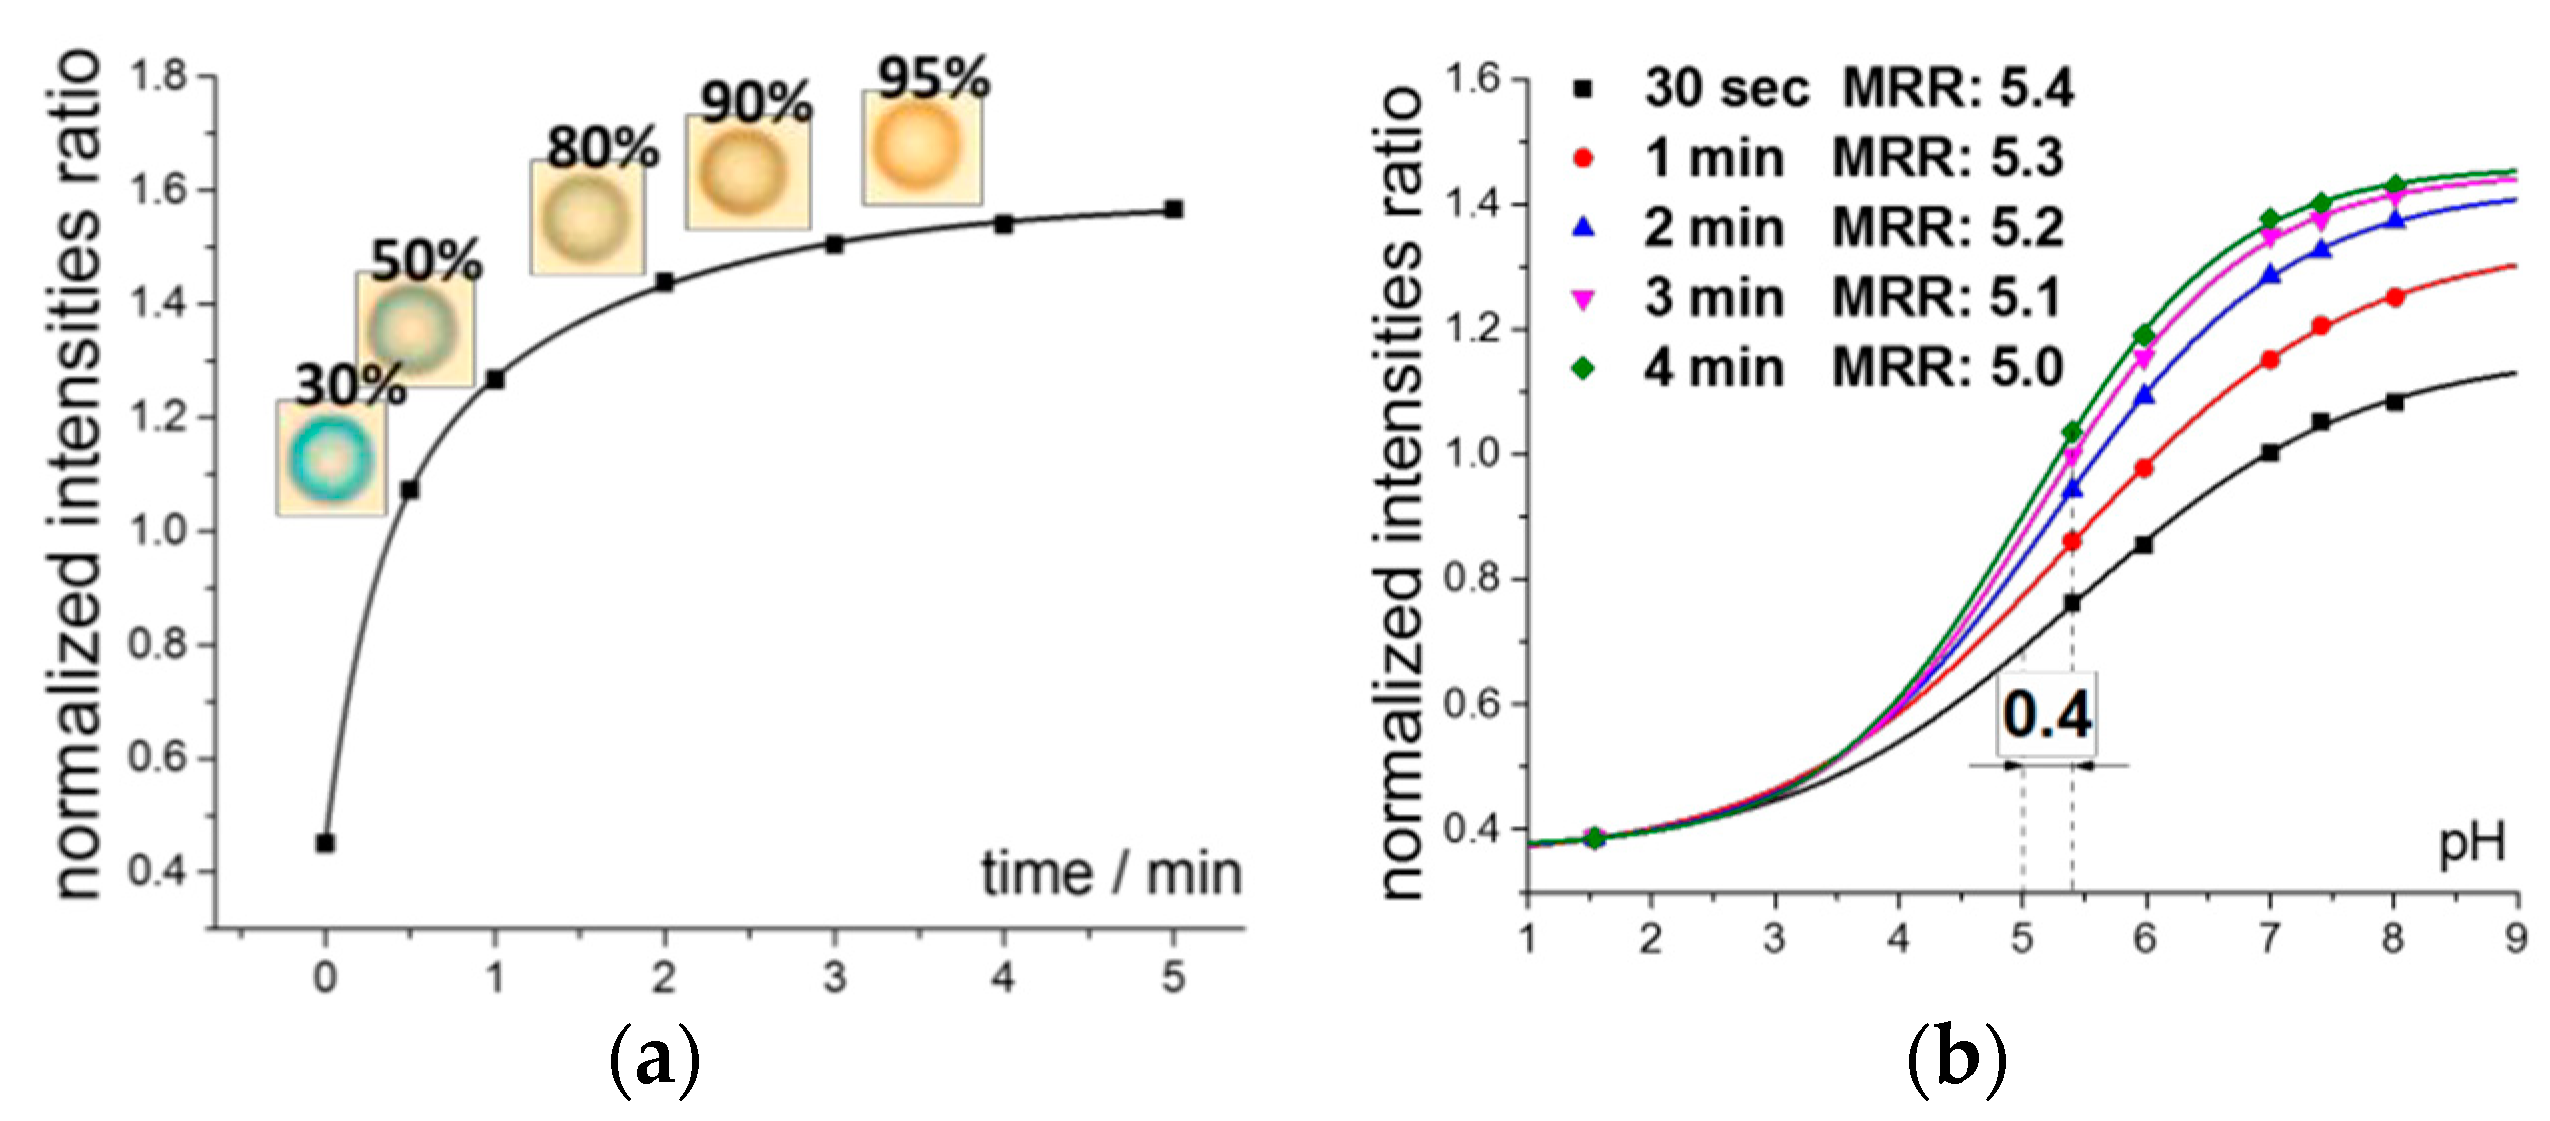
Figure 1a shows the time response of the pH-optode to pH change from 0.1 M HCl to 6.5. The optode phase had the thickness of ca. 15 µm and the time until the 95% of the signal change was about 4 min. However, the detectable change of the color occurs much earlier in time: already after 1–2 min of the contact with the solution (photos in
Figure 1a).
From the data, analogous to the data shown in
Figure 1a with the same starting point in 0.1M HCl, but with different final pH of the solution the respective calibration curves were obtained: at 30, 50, 80, 90 and 95% of the signal change (
Figure 1b). The response curve has typical for the optodes sigmoid shape and the response range shifts monotonously towards more alkaline pH with reducing the contact time. This fact can be utilized for the fine tuning of the optical response towards the desired concentration ranges, e.g., in physiological applications. Meanwhile the respective loss in the sensitivity and span of the response is rather minor at contact times longer than 1 min and can be compensated by the drastic reduction of the analysis time (from 4 min to 1–2 min).
3.2. The Role of the Camera Type and Color Space in Digital Color Analysis of Colorimetric Optodes
Digital cameras are commonly utilized for recording colorimetric signal. The acquired images then undergo digital color analysis (DCA) in RGB (Red, Green, Blue) or HSB (Hue, Saturation, Brightness) color space [
3,
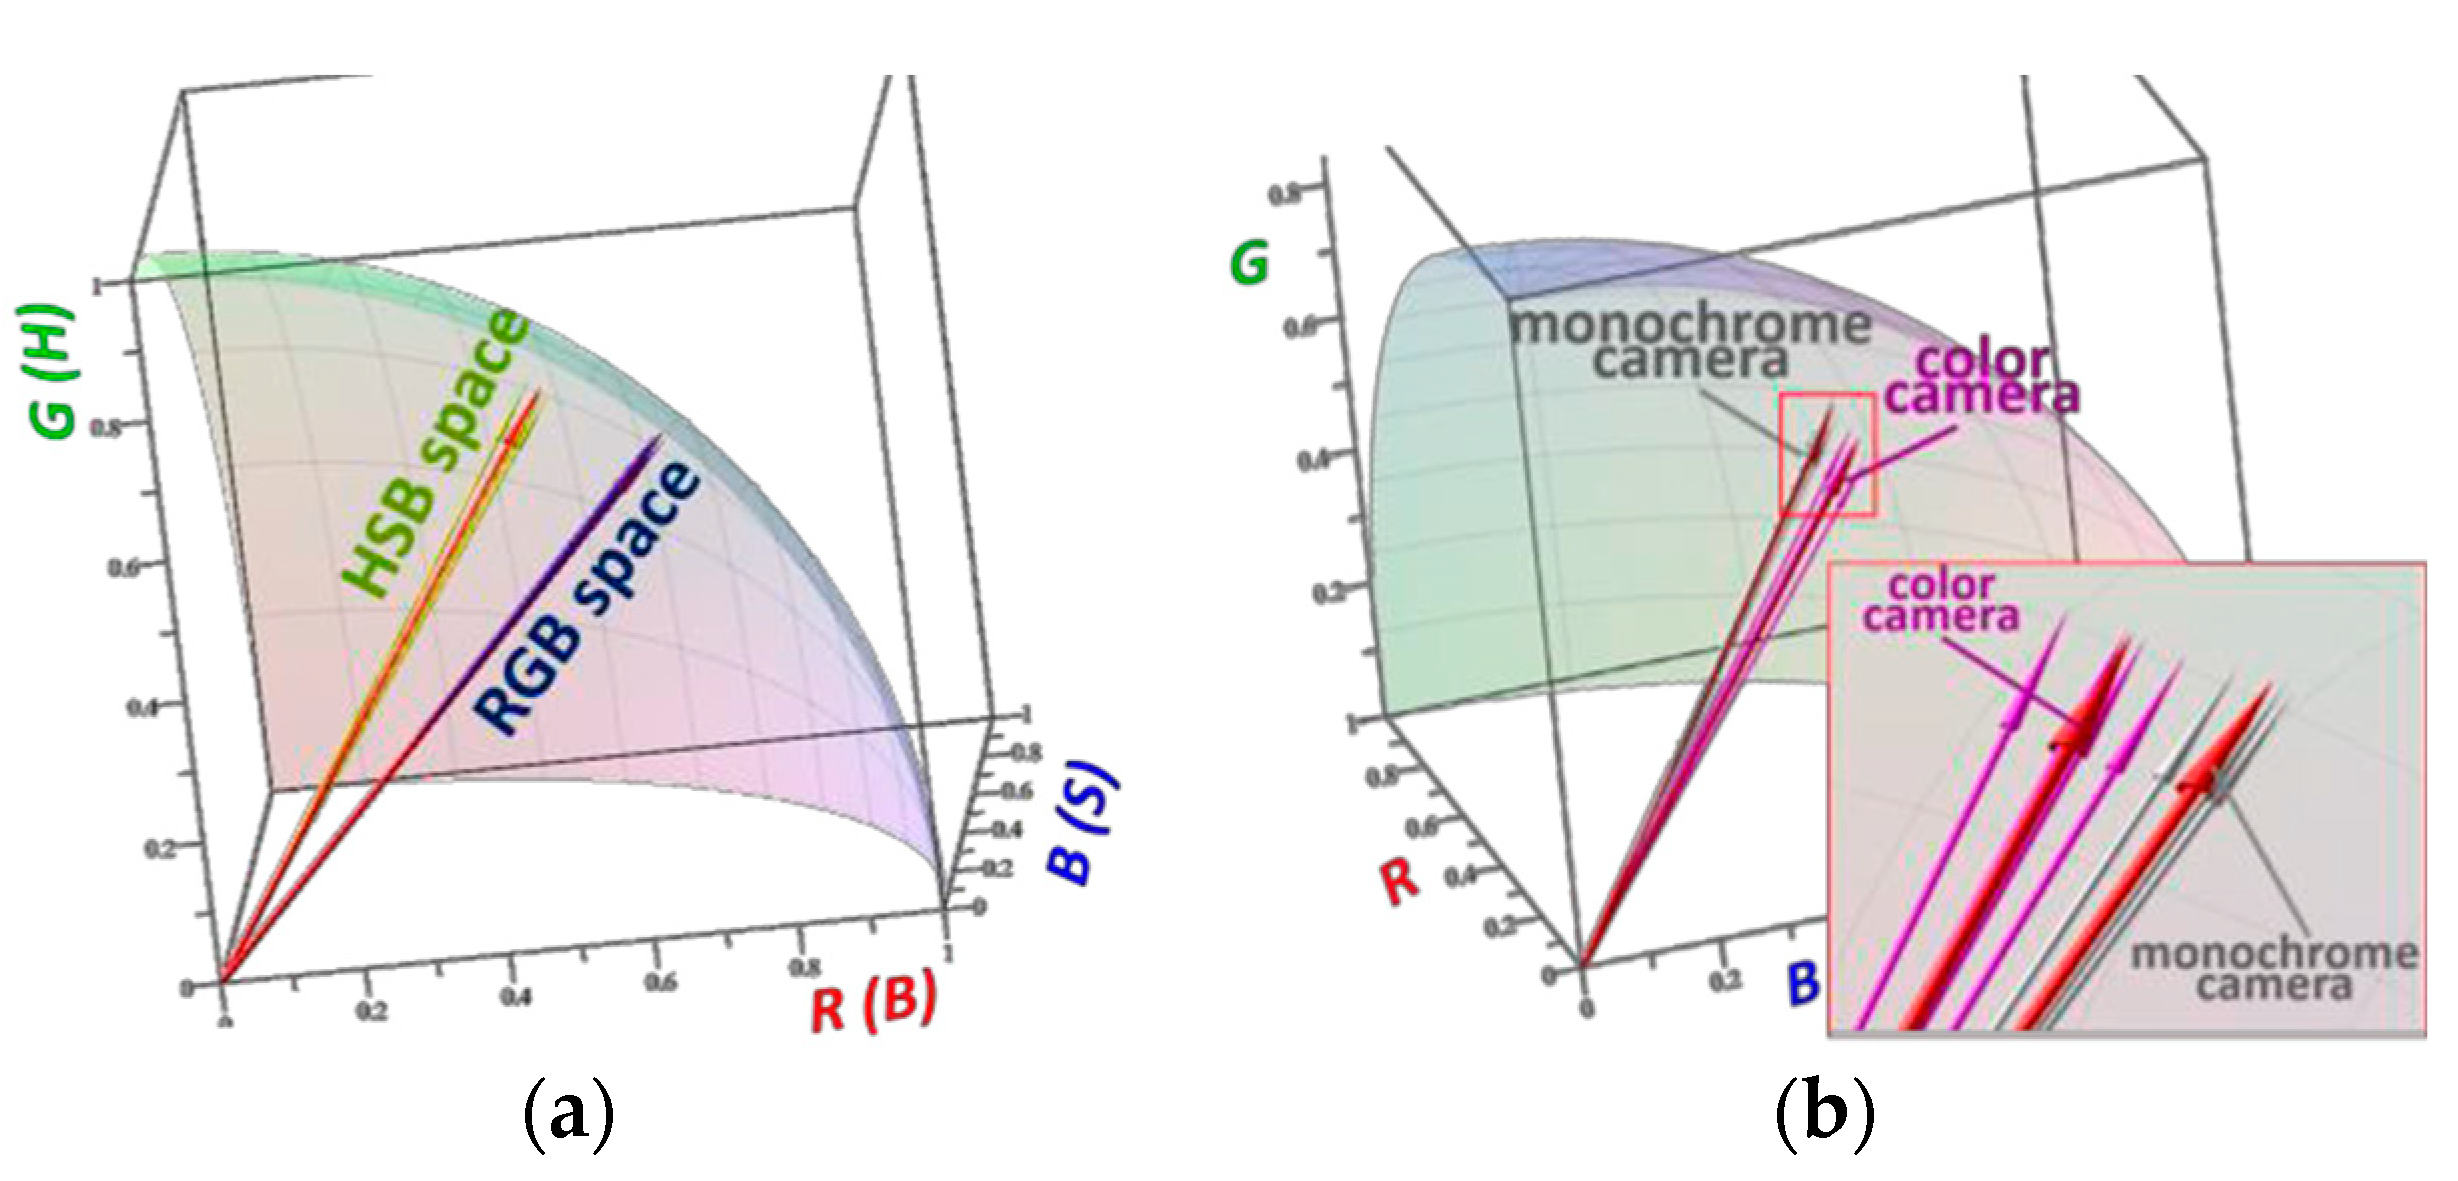
4]. We performed a systematic evaluation of the signal errors obtained after color processing in both spaces. Color CCD camera with incandescent illumination and grayscale camera with RGB-LED illumination were compared. The obtained results suggest that regardless the camera used the RGB space is preferable for color processing while the monochrome camera is superior to the color one independently on the color space. Generally, the colors registered for 5 replica sensors were transformed into normalized vectors in RGB or HSB space, so that each of the colors gave a point on the positive eighth of the unit sphere. The distance between these points and the end of the mean vector (
di), as well as signal-to-noise ratio (
SNR) were evaluated with the following equations:
where (𝑋, 𝑌, 𝑍)
𝑖–
i-vector coordinates, (𝑋, 𝑌, 𝑍)
𝑚 —mean vector coordinates in the respective color space.
where
β is the slope, and
ΔpH is the width of the linear domain of the optode response curve; 𝑆𝜃: the standard deviation of the vector angles was calculated as described elsewhere [
3].
The results demonstrating the advantage of RGB space over HSB space and the gray-scale camera over the color one are shown in
Figure 2.
3.3. Indicator-Based Color Standards and Color Scale for Calibration-Free Measurements with Optodes
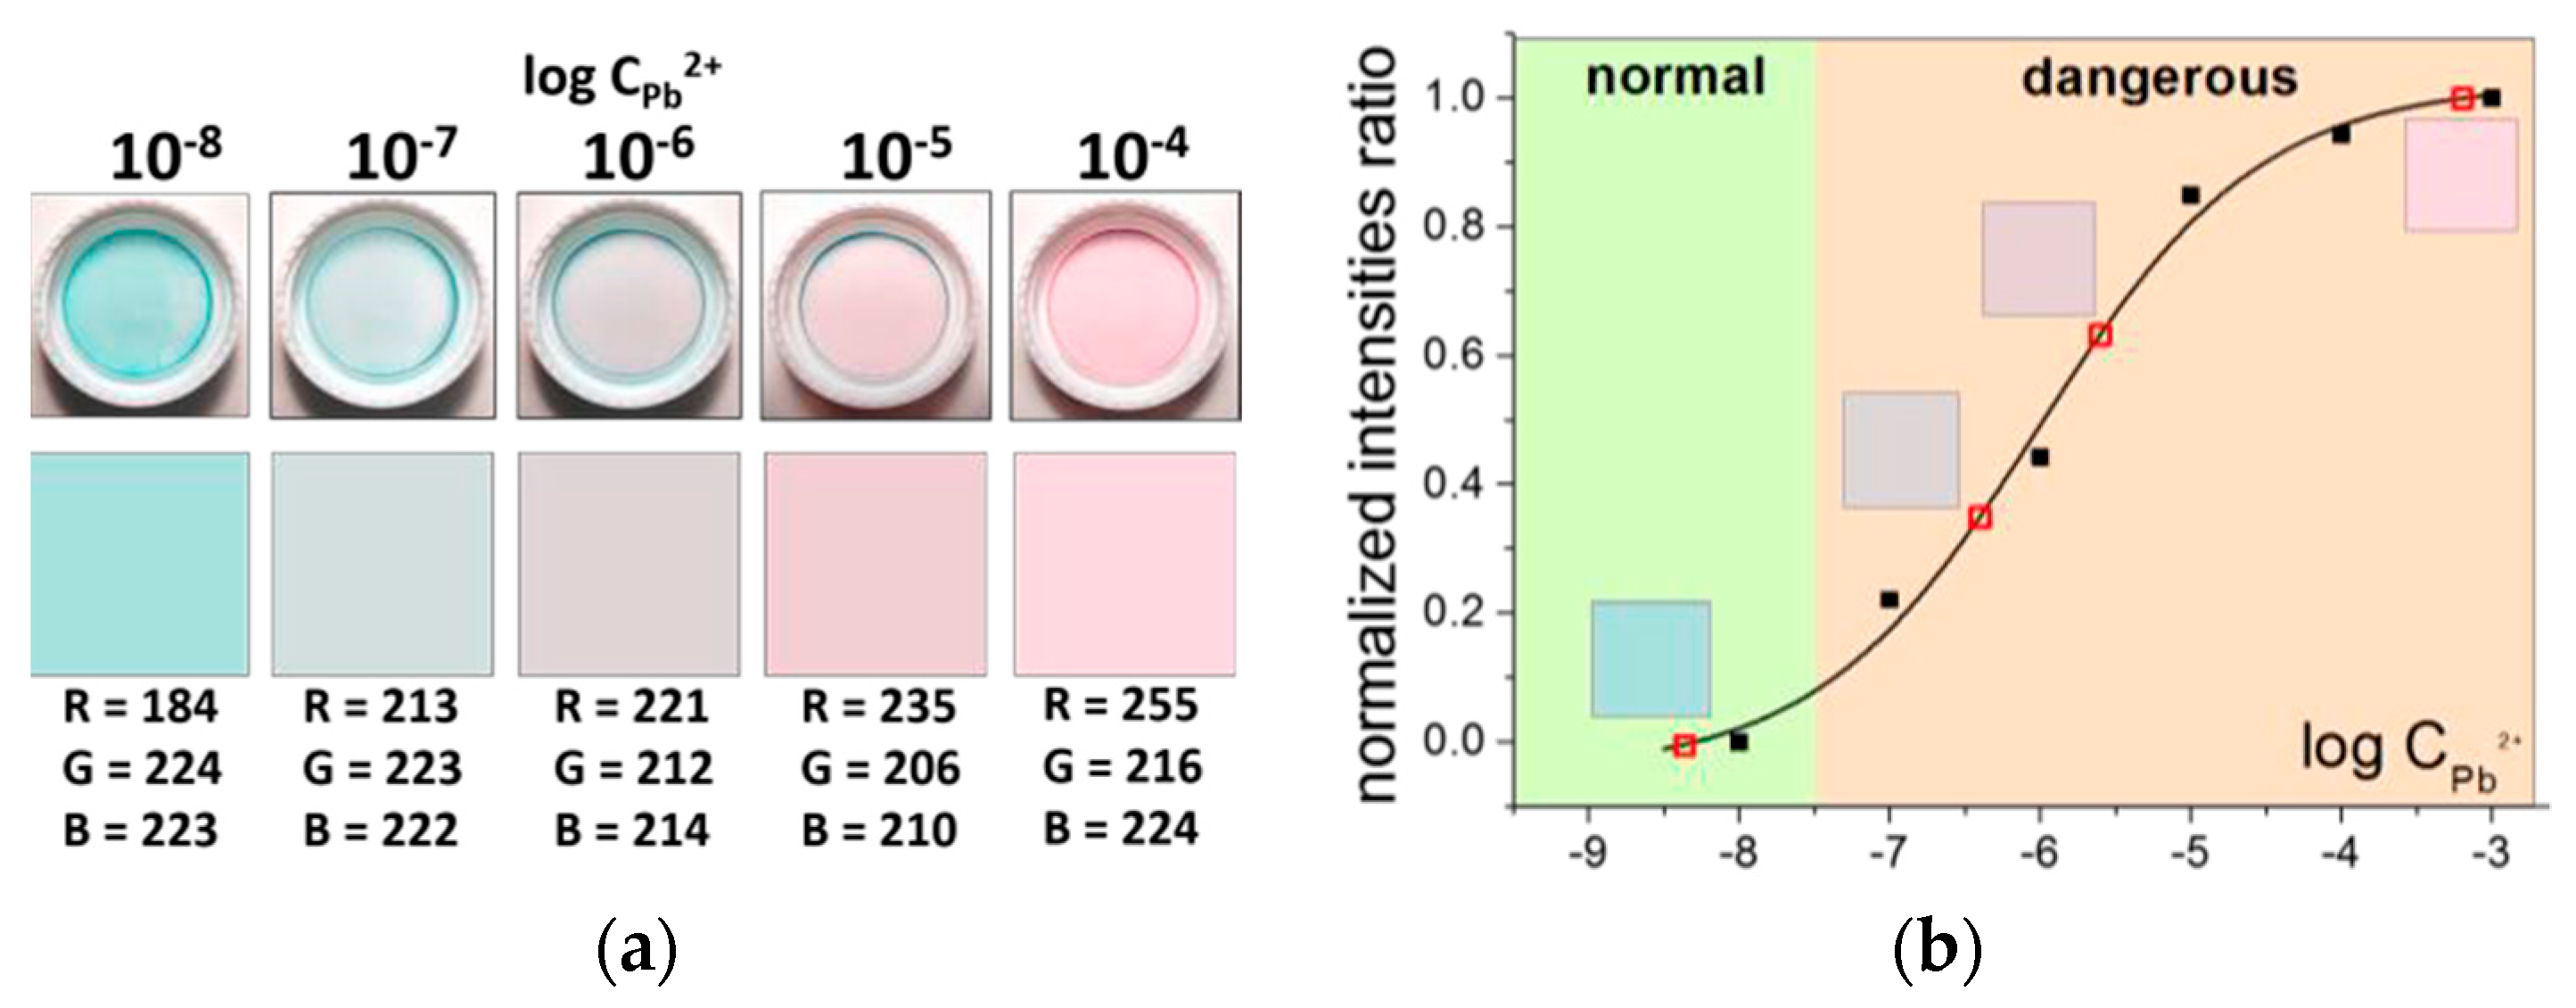
A 5-elements color scale (
Figure 3a) was developed for semi-quantitative calibration-free analysis with the optodes. Highly reproducible procedure of spin-coating was used both for the standard and the sensing film preparation. The standard films were photographed in the standard solutions and the respective values of RGB were used to draw and print high-resolution colored rectangles from MS Word to form a scale. The results of successful Pb
2+ determination in spiked aqueous and diluted urine samples using the developed scale are shown in
Figure 3b and
Table 1.
Furthermore, we suggest here the indicator-based polymeric color standards for color normalization in DCA. The novel standards where the colors corresponding to the actual absorption bands of the indicator are mixed in fixed proportions would potentially substitute the commonly used white/gray standards. As shown earlier [
5,
6] addition of the lipophilic electrolyte to the I+/H+-selective optode can suppress the ion-exchange between the two phases. The indicators ETH5350 and ETH2439 and the lipophilic salt: TBATBB were utilized. The standard colors remained unchanged upon varying solution pH, the nature and the concentration of the electrolyte (
Figure 4a,b). Calibration curves of pH-optodes were recorded in horse serum using the developed standards and found to have broader span and higher sensitivity as compared to the results obtained with conventional gray (
Figure 4c). The results of the serum sample determination with target value of pH 7.28 suggested the green standard to give the best color normalization (measured 7.28), close value was obtained with blue standard (7.3) and conventional gray standard gave the least accurate value of 7.35.
Author Contributions
A.K., K.N. and M.P. conceived and designed the experiments; N.P., A.K. performed the experiments and analyzed the data; K.N. contributed in discussion of the results and writing the paper.
Acknowledgments
program of President Grants for support of young scientists (#SP-1901.2018.4) is acknowledged.
Conflicts of Interest
The authors declare no conflict of interest. The funding sponsors had no role in the design of the study, collection, analyses, interpretation of data, writing of the manuscript, decision to publish the results.
References
- Mikhelson, K.N.; Peshkova, M.A. Advances and trends in ionophore-based chemical sensors. Russ. Chem. Rev. 2015, 84, 555–578. [Google Scholar] [CrossRef]
- Seiler, K.; Simon, W. Theoretical aspects of bulk optode membranes. Anal. Chim. Acta 1992, 266, 73–87. [Google Scholar] [CrossRef]
- Ahuja, P.; Peshkova, M.A.; Hemphill, B.D.; Gratzl, M. Minimizing color interference from biological samples in optode-based measurements. Sens. Actuators B 2014, 204, 319–325. [Google Scholar] [CrossRef]
- Cantrell, K.; Erenas, M.M.; De Orbe-Payá, I.; Capitán-Vallvey, L.F. Use of the hue parameter of the hue, saturation, value color space as a quantitative analytical parameter for bitonal optical sensors. Anal. Chem 2010, 82, 531–542. [Google Scholar] [CrossRef] [PubMed]
- Vincze, A.; Horvai, G. The design of reference electrodes without liquid junction. Electrochem. Soc. Proceed. 1997, 19, 550–555. [Google Scholar]
- Stashkova, A.E.; Peshkova, M.A.; Mikhelson, K.N. Single-ion activity: Optical sensing vs. electrochemical sensing. Sens. Actuators B 2015, 207, 346–350. [Google Scholar] [CrossRef]
| Publisher’s Note: MDPI stays neutral with regard to jurisdictional claims in published maps and institutional affiliations. |
© 2018 by the authors. Licensee MDPI, Basel, Switzerland. This article is an open access article distributed under the terms and conditions of the Creative Commons Attribution (CC BY) license (http://creativecommons.org/licenses/by/4.0/).


