Proceeding Paper

A Microfabricated 4-Electrode Conductivity Sensor with Enhanced Range †

by
Greja J. A. M. Brom-Verheijden
*,
Martijn H. Goedbloed
and
Marcel A. G. Zevenbergen
Holst Centre, IMEC The Netherlands, 5656AE 31 Eindhoven, The Netherlands
*
Author to whom correspondence should be addressed.
Presented at the Eurosensors 2018 Conference, Graz, Austria, 9–12 September 2018.
Proceedings 2018, 2(13), 797; https://doi.org/10.3390/proceedings2130797
Published: 10 December 2018
(This article belongs to the Proceedings of EUROSENSORS 2018)

Abstract

:
Conductivity is a routinely measured parameter to assess impurities in water. Changing the geometry from parallel plate electrodes to planar microfabricated dual-band or interdigitated electrodes, these sensors could be miniaturized. Based on this approach, we designed 2-electrode conductivity sensors and compared their performance with a commercially available device. Adding another electrode pair (either as dual-band or meandering between interdigitated electrodes), a 4-electrode sensor was formed for which the measuring range could be enhanced to 3 × 10⁻⁶–12 × 10−3 S/cm.

1. Introduction

The conductivity of an electrolyte is a measure for the total number of dissolved ions. Conductivity tests can be performed reliably, with a fast response and high sensitivity. Although the technique is unable to distinguish between different kinds of ions, it is routinely used to assess the quality of for instance waste water, drinking water, surface water, process water or other solutions [1]. Furthermore, if a single salt is dissolved, conductivity can be used to determine the concentration of this salt.
State the of the art conductivity sensors consist either of 2 or 4 parallel electrodes. In a 2-electrode sensor, the resistance of the fluid between the two electrodes, Rs, is measured at a certain frequency and the conductivity, κ, is then given by κ = Kc/Rs where Kc is the cell constant dependent on the area, A, and distance, d, between the electrodes (Kc = d/A). In a 4-electrode sensor one pair of electrodes (the outer poles) is used for current injection and one pair (the inner poles, placed inside the electric field lines of the outer poles) act as voltage measurement electrodes. Because of the high input impedance of the voltage measuring circuit, nearly no current flows through this pair of electrodes, preventing that the measured impedance is influenced by polarization or charging currents at the electrode-electrolyte interface. As a results, 4-electrode conductivity sensors have a larger measurement range. 2-electrode conductivity sensors have been miniaturized by microfabricating planar electrodes (either as dual-band or interdigitated structure) [2,3,4]. The sensor’s impedance as function of frequency had a frequency independent plateau with a certain bandwidth determined by the cut-off frequencies, flo and fhi, respectively. This response could be well modeled by an equivalent circuit of resistors and capacitors, as explained by Langereis [2]. The impedance at the plateau equals Rs, the conductivity is then given by κ = Kc/Rs where Kc is given by Equation (11) in [3] for a dual-band or interdigitated electrode geometry. Both the high and low cut-off frequencies, flo and fhi are proportional to the solution’s conductivity. If the sensor is operated at a single frequency, at a certain moment in either low or high conducting solutions, the sensors impedance will not be linearly dependent anymore on the solution’s conductance and this limits the measurement range.
We designed 2-electrode planar conductivity sensors with different Kc based on the approach of Timmer et al. [3] and compared their performance with a commercially available conductivity sensor. Furthermore, we extended this approach with two different designs for planar 4-electrode conductivity sensors for which the Kc was determined experimentally. We show that the bandwidth increased and therefore the measurement range could be enhanced.

2. Design

2.1. 2-Electrode Sensors

Based on the approach by Timmer et al. [4], three interdigitated 2-electrode conductivity sensors with a Kc of 0.05 cm−1 (type 1A), 0.5 cm−1 (type 1B), and 1 cm−1 (type 1C) were designed. Figure 1 shows parts of the lithography mask and the dimensions of the different sensors are listed in Table 1. Two individual leads connect each comb structured electrode in order to create a so-called 4-point probe system (a 4-point probe measurement decreases the influence of the resistance of the leads. The outer lead pair act as the current measuring pair, while the alternating voltage is applied to the other pair [5]). The hatched parts in the drawings are the openings in the top isolation layer that covered the leads, avoiding any parasitic influence on the measurements.

2.2. 4-Electrode Sensors

We fabricated two type of planar 4-electrode sensors. In the first design (sensor type 2 in Figure 1a), the two inner electrodes (grey lines) are placed between two larger outer electrodes (blue lines). For the second design (sensor type 3 in Figure 1), the two outer electrodes are designed as an interdigitated finger structure, with the two inner electrodes meandering as a serpentine in between. The electrode sizes and spacing of these two sensors are listed in Table 1 as well.

3. Experimental

3.1. Device Fabrication

The electrodes were fabricated on a silicon substrate covered by a 500 nm thick layer of thermal oxide. The electrode layer, consisting of 10 nm Ta (adhesion layer) and 200 nm Pt, was deposited by sputtering (PVD). The electrodes were patterned using conventional lithography in combination with ion beam etching. An isolation stack of 100 nm SiO2, 200 nm SiN, 600 nm SiO2 and 300 nm SiN (bottom to top) was deposited by a PECVD process. The isolation stack was opened at the sensor area and bondpads using contact lithography and reactive ion etching. Figure 1b shows microscope images of the devices. The wafers were diced and the individual dies were placed and wirebonded on a printed circuit board and the bondpad area was protected with epoxy (Epotek H70e-2).

3.2. Measurement Setup

Impedance spectra were recorded in 19 different KCl solution ranging in concentration from 10 µmol/L (3 µS/cm) to 100 mmol/L (12 mS/cm) using an Autolab PGSTAT302N. For comparison, the conductivity of each solution was determined with a 914 pH/Conductometer obtained from Metrohm, equipped with a 4-electrode conductivity cell (Kc = 0.44 cm−1) and an integrated Pt1000 temperature sensor. To calibrate this sensor, a 100 µS/cm (25 °C) conductivity standard obtained from Metrohm was used.

4. Results

4.1. 2-Electrode Sensor

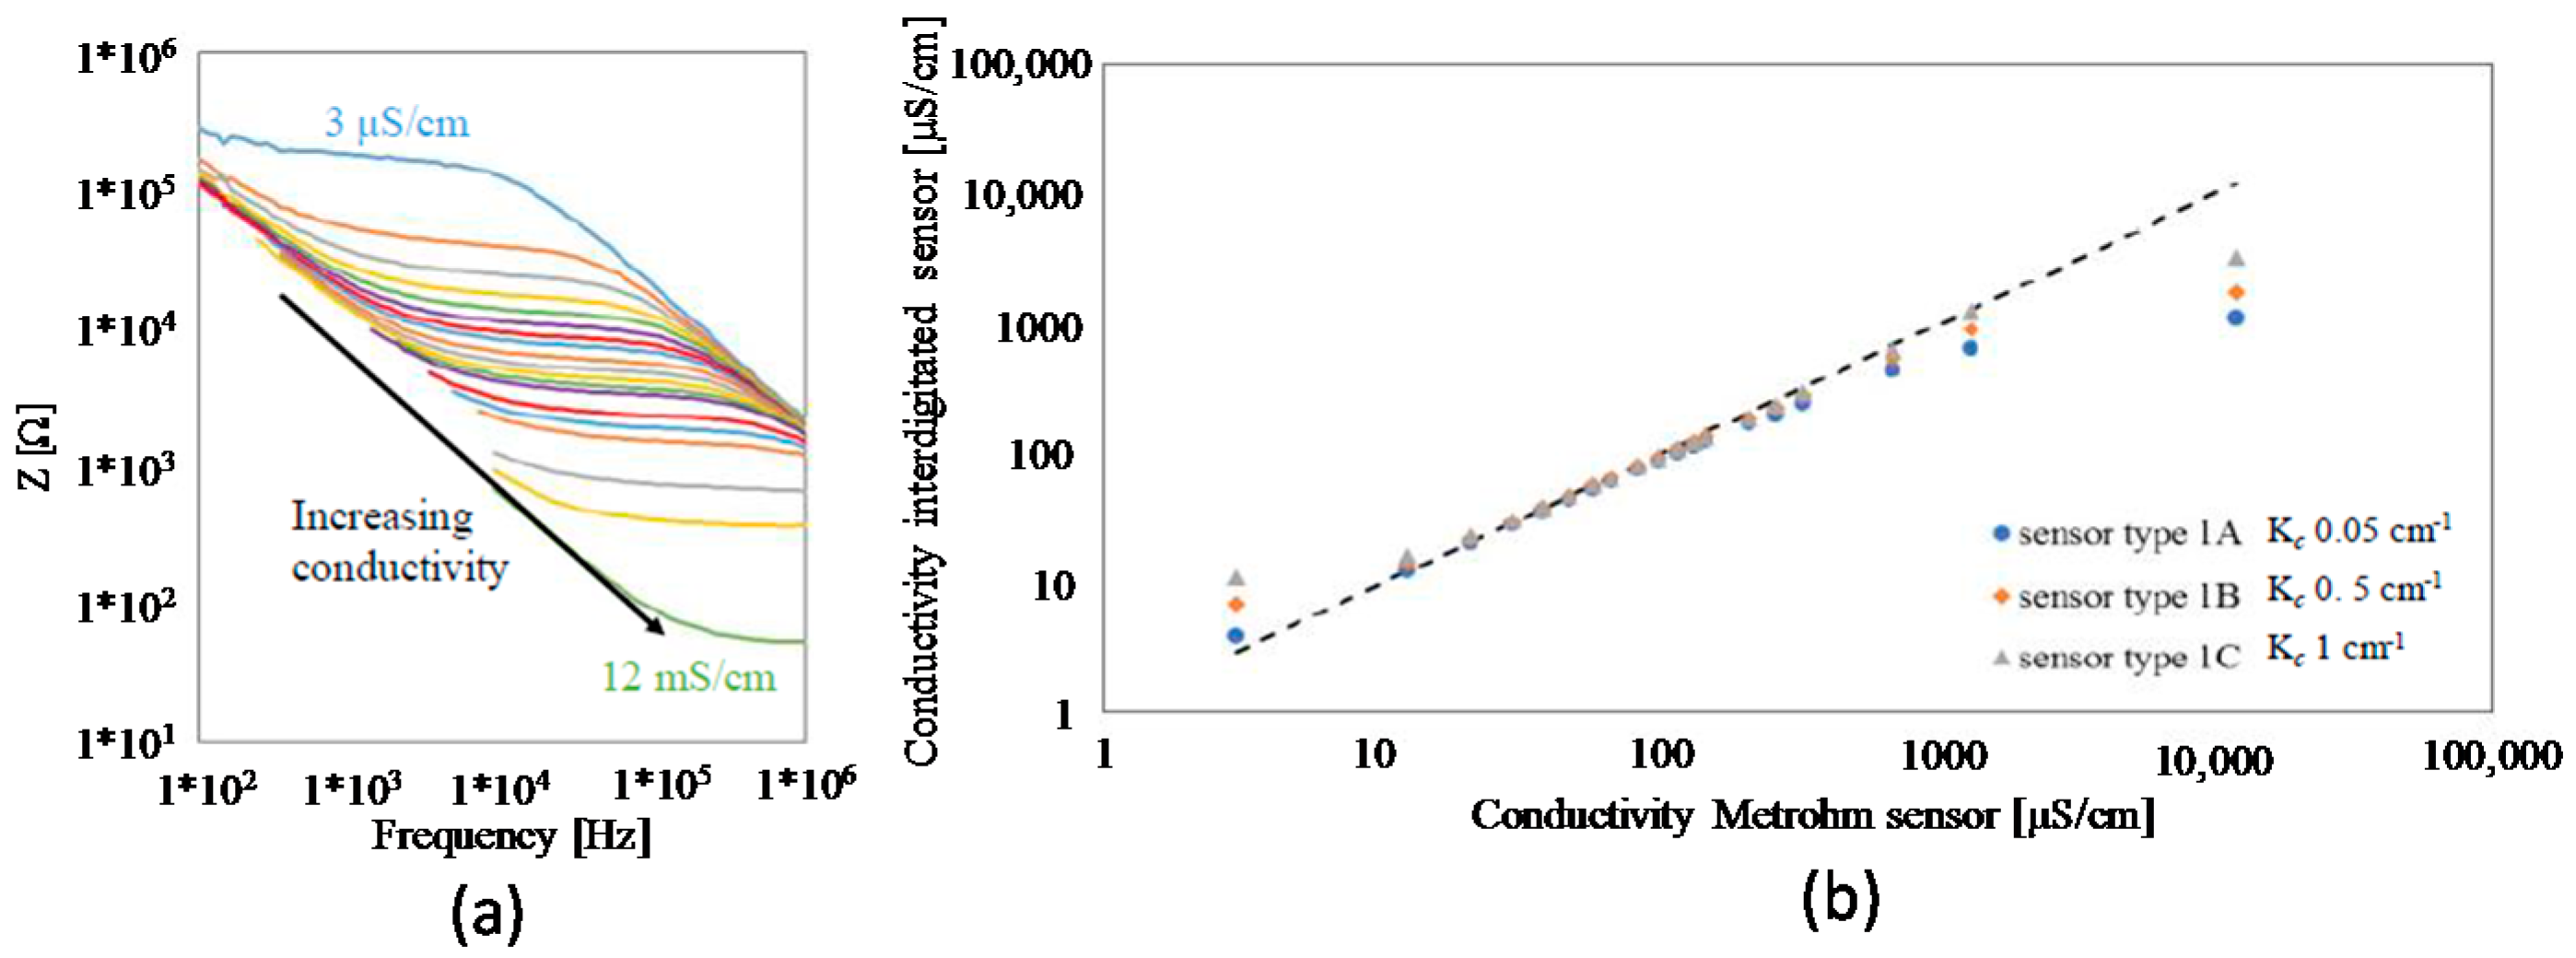
Figure 2a show the impedance spectra for the interdigitated sensor type 1B (Kc of 0.5 cm−1, other Kc values showed similar spectra, data not shown). During the measurement, an AC voltage of 50 mV rms was applied and the current was measured over a frequency range from 100 Hz to 1 MHz. The spectra are characterized by a plateau with a certain bandwidth. The plateau level, flo and fhi all shift upward or downward with changing conductivity. In practice, full spectral data is not available when a sensor is operated at a single frequency. Therefore, the conductivity was determined by dividing Kc with the impedance value at a fixed frequency of 24 kHz, which fell within the limits of the plateau for the bulk of the measurements.
Figure 2b compares the conductivity obtained with the interdigitated electrode sensors (for all three investigated Kc) to the conductivity measured with the Metrohm sensor. The dashed line represents the line y = x, with unity slope. In the range 10–500 µS/cm, the obtained conductivity agreed well with the Metrohm sensor for sensors with Kc = 0.5 cm−1 and Kc = 1 cm−1. For the sensor with Kc = 0.05 cm−1, this range changed to 3–100 µS/cm, as expected for a conductivity sensor with lower Kc. Outside these ranges, all the sensors started to deviate from the unity line due to the shifting low and high cut-off frequencies.

4.2. 4-Electrode Sensor

For the 4-electrode sensors, Kc could not be determined beforehand and had to be measured. Impedance spectra were determined in a calibration solution with a conductivity of 100 µS/cm (25 °C) obtained from Metrohm. The frequency range was 100 Hz to 10 kHz with an applied AC current of 1 µA rms injected in the outer electrode pair, while the voltage was measured at the inner pair. These spectra were nearly flat in this range and the average impedances were used to determine Kc which were Kc = 0.77 cm−1 for sensor type 2 and Kc = 0.23 cm−1 for sensor type 3, respectively.
Figure 3a and b show the impedance measurements for the two designed 4-electrode sensors in solutions with different conductivity. All the spectra are nearly flat in this frequency range except for the lowest investigated conductivity (3 µS/cm) in which a shoulder appeared at high frequency and for the highest conductivity (12 mS/cm) for which a shoulder appeared a low frequency. Still the impedance at a single chosen frequency (280 Hz), fell within the limits of the plateau for all investigated conductivities. Figure 3c shows the conductivity determined at 280 Hz as a function of the conductivity measured with the Metrohm sensor. The dashed line has a unity slope, showing excellent agreement. Comparing the impedance spectra to the spectra obtained with the 2-electrode sensor, flo shifted to lower frequencies (because of a reduced influence of charging current at the electrode-electrolyte interface) thereby widening the sensor’s range to the full 3 µS/cm–12 mS/cm investigated here.

5. Conclusions

We presented a microfabricated planar 4-electrode conductivity sensor. Similarly to the parallel plate geometry routinely used, the measurement range could be enhanced to 3 µS/cm–12 mS/cm investigated here, while the sensor was operated at a single frequency. For a microfabricated 2-electrode sensor with similar Kc this range was 10–500 µS/cm. Outside this range, the spectra were distorted by the interfacial double layer at low frequency.

References

  1. Rice, E.W.; Baird, R.B.; Eaton, A.D.; Clesceri, L.S. Standard Methods for the Examination of Water and Wastewater, 22nd ed.; American Public Health Association: Washington, DC, USA, 2012. [Google Scholar]
  2. Langereis, G. An Integrated Sensor System for Monitoring Washing Processes. Ph.D. Thesis, University of Twente, Twente, The Netherlands, 1999. [Google Scholar]
  3. Olthuis, W.; Streekstra, W.; Bergveld, P. Theoretical and experimental determination of cell constants of planar-interdigitated electrolyte conductivity sensors. Sens. Actuators B 1995, 24–25, 252–256. [Google Scholar] [CrossRef]
  4. Timmer, B.; Sparreboom, W.; Olthuis, W.; Bergveld, P.; van den Berg, A. Optimization of an electrolyte conductivity detector for measuring low ion concentrations. Lab Chip 2002, 2, 121–124. [Google Scholar] [CrossRef] [PubMed]
  5. Schroder, D.K. Semiconductor Material and Device Characterization, 3rd ed.; John Wiley & Sons: Hoboken, NJ, USA, 2006; pp. 1–59. [Google Scholar]
Figure 1. (a) Three designs for the microfabricated conductivity sensors. Sensor type 1 is a 2-electrode sensor, sensor type 2 and 3 are 4-electrode sensors. For the 4-electrode sensors the grey lines are the inner poles and the blue lines are the outer poles. The green hatched areas are the openings in the dielectric layer. (b) Microscope images of the fabricated sensors.
Proceedings 02 00797 g001
Figure 2. (a) Impedance spectra for sensor type 1B (b) Conductivity determined at a measurement frequency of 24 kHz plotted against the conductivity values measured with the Metrohm sensor for all three 2-electrode sensors. The dashed line represents the line y = x, with unity slope.
Proceedings 02 00797 g002
Figure 3. Impedance for the microfabricated 4-electrode sensors type 2 (a) and type 3 (b). (c) Conductivity measured with the microfabricated 4-electrode sensors as function of conductivity determined with the commercial sensor. The conductivity is determined from the impedance at 280 Hz. The dashed line represents the line y = x, with unity slope.
Proceedings 02 00797 g003
Table 1. Geometry of the microfabricated conductivity sensors.
Sensor TypeSa [µm]Size Measurement (Inner) ElectrodeSize Outer Electrode
Wb [µm]Lc [µm]NdWb [µm]Lc [µm]Nd
Type 1 A,B,C10201220A: 250, B: 26, C: 13
Type 21020530028053002
Type 3102026,860250116022
a: Space between fingers; b: Width of finger; c: Length of finger; d: Number of fingers.
Publisher’s Note: MDPI stays neutral with regard to jurisdictional claims in published maps and institutional affiliations.