Abstract
We present our investigation on the gasochromic reaction of E141 (ii) towards the toxic gas nitrogen dioxide (NO2). E141 (ii) is a chlorophyllin-based food additive, typically used as green coloring for nearly all kinds of sweets. In this presentation we show an alternative approach for using E141 (ii) as optical gas indicator. All solid samples are prepared by multi-layer screen printing on different substrates like paper and PE-foil. Gas measurements are performed using an UV/Vis spectrometer. The influence of the substrate and according layer thickness is shown.
1. Introduction
The detection of the toxic gas nitrogen dioxide (NO2) is of high relevance in varying fields like monitoring environmental pollution due to combustion or automotive emission, industrial safety or for early fire gas detection [1]. During the last few years, the approach of detecting gases by gasochromic dyes came to the fore. Several NO2-sensitive color dyes are described in literature [2]; one of them is the characteristic green plant dye chlorophyll [3]. However, chlorophyll has the disadvantages of being very expensive and limited temperature stable. One promising alternative is the food additive Cu-chlorophyllin, also known as E141 (ii). According to the Commission Regulation (EU) No 231/2012 E141(ii): “The alkali salts of copper chlorophyllins are obtained by the addition of copper to the product obtained by the saponification of a solvent extraction of strains of edible plant material, grass, lucerne and nettle.”. E141 (ii) is of bright green color and used as coloring for confectionary, desserts, beverages, and ice cream etc.
The here presented approach shows the capability of E141 (ii) as color indicator for selective and reversible [2] NO2 detection. The color change of E141 (ii) is recorded in solution and as screen printed test stripes on PE-foil and paper.
2. Experimental Part
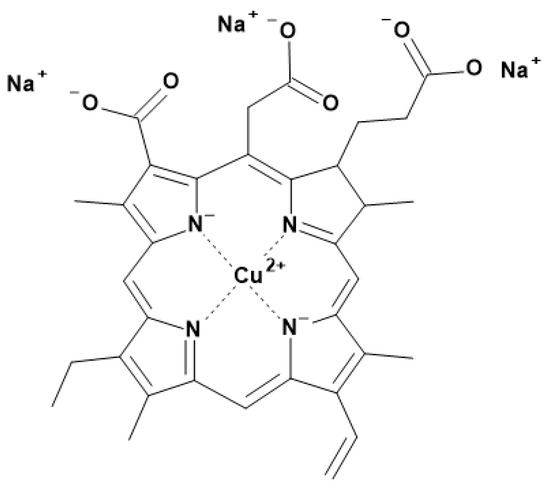
For all experiments, E141 (ii) was used as color dye. It was provided by ExtraChem GmbH (Huchzermeierstr. 8a, 33611 Bielefeld, Germany), and consists of copper chlorophyllin (3.5–4.3%), maltodextrin, polysorbate 80 and potassium hydroxide. The sodium copper chlorophyllin is derived from a standardized and purified extract of grass or edible plant material. It is vegetarian, vegan, kosher and halal [4]. The chemical structure of sodium copper chlorophyllin is shown in Figure 1.

Figure 1.
Chemical structure of sodium copper chlorophyllin.
To demonstrate the color of E141 (ii) changes in the presence of NO2, 1 mg E141 (ii) were solved in 5 mL H2O and exposed to 45 ppm NO2 in dry nitrogen. For sample preparation, the color dye was transferred into a screen printing paste consisting of 15 g ethylcellulose, 15 mL tributylphosphate and 600 mL ethanol (99%). All educts are of pure grade and were provided by Sigma Aldrich (Darmstadt, Germany). The color dye concentration was set to 31 g/L. All samples were made by screen printing in order to get homogenous and thin layers, using a 180/27 screen in DIN A4. After printing, the samples were dried at room temperature for at least four hours. As substrates, paper (UPM Finesse Premium Silk, 150 g/m2, UPM Communication Paper Augsburg, Germany) and PE-foil with ink adhesion primer (Autostat CT3, MacDermid, Wantage, UK) were used. To obtain different layer thicknesses, a multi-layer printing process was developed. It is divided into 1-layer (1nn: once printed wet-in-wet), 2-layer (2nn: twice printed wet-in-wet) and 3-layer (3nn: triple printed wet-in-wet). The resulting thicknesses were determined by 3D laser scanning microscopy (KEYENCE VK 9700 K, Keyence Deutschland GmbH, Germany) (for PE-foil): 2nn 0.9–1.1 µm and 3nn 1.5 µm.
All measurements were performed at the gas measurement station of Fraunhofer IPM. The general description of the gas measurement station is given in [5]. The transmission spectra were recorded using a Perkin Elmer Lambda 900 UV/Vis-spectrometer (Perkin Elmer, Waltham, MA, USA).
3. Results and Discussion
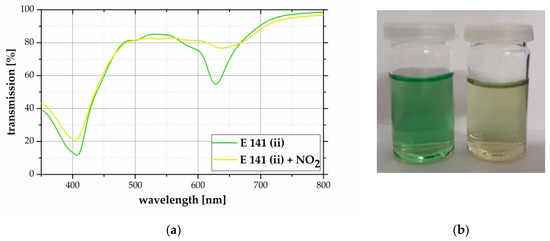
To demonstrate the gas dependent color change of E141 (ii), 45 ppm NO2 were passed through the solution. The reaction leads to a hypsochromic color change from bright green to pale yellow within 60 minu as shown in Figure 2b. The related transmission spectra are given in Figure 2a. The reaction causes transmission changes in the violet (λ = 410 nm) and orange (λ = 630 nm) wavelength area.

Figure 2.
(a) Transmission spectra of dissolved E141 (ii) in H2O before (green) and after (yellow) the reaction with 45 ppm NO2 for 60 min. The color change increases the transmission within the violet (410 nm) and the orange (630 nm) wavelength area. (b) Photo of the E141 (ii) solution before (green) and after (yellow) treating with 45 ppm NO2 for 60 min.
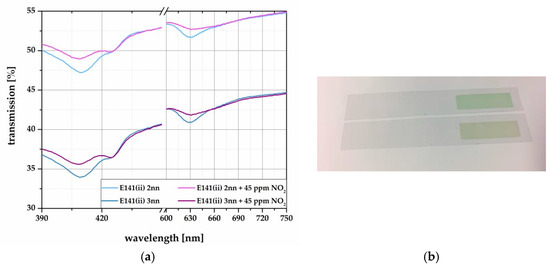
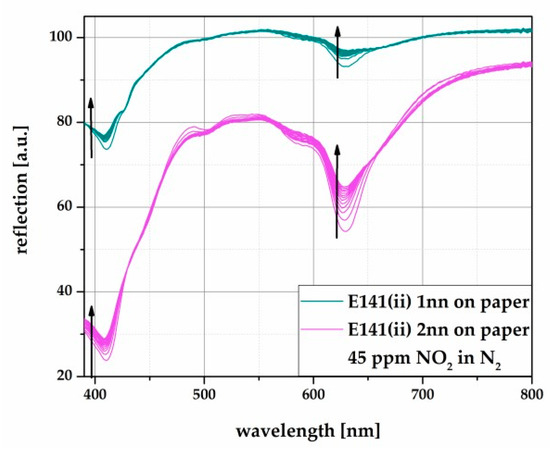
The results of the PE-foil based samples to the reaction with NO2 are shown in Figure 3. The samples were also exposed to 45 ppm NO2 in dry N2. As in solution, the color changes induce signal changes within the violet and the orange wavelength area, comparing 2nn and 3nn layers. Com- pared to this, Figure 4 depicts the results of the reflection changes of the paper based samples, measured identically to Figure 3.

Figure 3.
(a) Transmission spectra of screen printed E141 (ii) on PE-foil with different layer thicknesses (2nn and 3nn). The samples were exposed to 45 ppm NO2 in N2. (b) Picture of the test stripes on PE-foil before (up) and after (down) the exposure to 45 ppm NO2.

Figure 4.
Reflection spectra of screen printed E141 (ii) on paper with different layer thicknesses (1nn and 2nn). The samples were exposed to 45 ppm NO2 in N2.
Table 1 summarizes the sensitivity to NO2 (transmission change in %) of different samples depending on the layer thickness. It is obvious that the sample preparation, substrate and layer thickness have a remarkable influence to the sensitivity.

Table 1.
Overview of the sensitivity to 45 ppm NO2 (given as the maximum transmission change in. %) of E141 (ii) in solution, screen-printed samples on paper as well as samples on PE-foil in dependency of the layer thickness.
4. Conclusions
The capability of E141 (ii) as color dye for gasochromic NO2 detection has been demonstrated. During NO2 exposure, it changes its color from bright green to pale yellow. The intensity of this color change is significantly influenced by the sample preparation and layer thicknesses. As the pigment amount of copper chlorophyllin is limited to at least 4.3% of E141 (ii), this sensitivity is nevertheless remarkable. The use of pure copper chlorophyllin might further increase the sensitivity. Next steps are the integration of the color dye into a waveguide-based optical sensor set-up.
Author Contributions
C.P. and J.W. Conceptualization, C.P. and K.R.T. conceived and designed the experiments; C.P. and L.E. and T.V. performed the experiments; C.P. and L.E. and T.V. analyzed the data; C.P. wrote the paper.
Funding
This research was funded by the German Federal Ministry of Education and Research grant number 13N14076.
Acknowledgments
Special thanks go to our projects Partner Thieme GmbH for screen printing.
Conflicts of Interest
The authors declare no conflict of interest.
References
- Schmitt, K.; Tarantik, K.R.; Pannek, C.; Wöllenstein, J. Colorimetric Materials for Fire Gas Detection—A Review. Chemosensors 2018, 6, 14. [Google Scholar] [CrossRef]
- Bernardo, M.; Organo, V. Chlorophyll as a Simple, Inexpensive and Environment-friendly Colorimetric Indicator for NO2 Gas. Orient. J. Chem. 2014, 30, 445–449. [Google Scholar] [CrossRef][Green Version]
- MSDS Chlorophyllin water-soluble (Na-Cu-Chlorophyllin). Available online: https://www.google.com/url?sa=t&rct=j&q=&esrc=s&source=web&cd=12&ved=2ahUKEwjIz464x_neAhVnhosKHd54AT4QFjALegQIBBAC&url=http%3A%2F%2Fwww.merckmillipore.com%2FINTERSHOP%2Fweb%2FWFS%2FMerck-BE-Site%2Fen_US%2F-%2FEUR%2FShowDocument-File%3FProductSKU%3DMDA_CHEM-102492%26DocumentType%3DMSD%26DocumentId%3D102492_SDS_CY_EN.PDF%26DocumentUID%3D321738%26Language%3DEN%26Country%3DCY%26Origin%3DPDP&usg=AOvVaw0ELRipbSSDd3ahOWlfPUCn (accessed on 15 November 2018).
- Kneer, J.; Eberhardt, A.; Walden, P.; Ortiz Pérez, A.; Wöllenstein, J.; Palzer, S. Apparatus to characterize gas sensor response under real-world conditions in the lab. Rev. Sci. Instrum. 2014, 85, 055006. [Google Scholar] [CrossRef] [PubMed]
Publisher’s Note: MDPI stays neutral with regard to jurisdictional claims in published maps and institutional affiliations. |
© 2018 by the authors. Licensee MDPI, Basel, Switzerland. This article is an open access article distributed under the terms and conditions of the Creative Commons Attribution (CC BY) license (https://creativecommons.org/licenses/by/4.0/).