Proceeding Paper

Analysis of Synthesis Mechanism of Gold Nanoparticles Using Glass Microfluidics  †

1
Department of Mechanical Engineering, Kanto Gakuin University, Yokohama 236-8501, Japan
2
Fukoku Co., Ltd., Ageo 362-8561, Japan
*
Author to whom correspondence should be addressed.
Presented at the Eurosensors 2018 Conference, Graz, Austria, 9–12 September 2018.
Proceedings 2018, 2(13), 702; https://doi.org/10.3390/proceedings2130702
Published: 3 December 2018
(This article belongs to the Proceedings of EUROSENSORS 2018)

Abstract

:
According to LaMer diagram, a clearly separate of nucleation and grows step is required to synthesis of monodisperse nanoparticles. However, a critical mixing time Tc until the growth process is started, is not clear experimentally. In this paper, we prepared gold nanoparticles (GNPs) by liquid-phase reduction using citric acid on microfluidics with different flow rates. From relationship of the diameter of the prepared nanoparticle and the mixing time, Tc for the preparation of monodisperse GNPs was found for the first time.

1. Introduction

In an application of metallic nanoparticle to bio/chemical sensor with localized surface plasmon resonance [1], there are strong demands for monodisperse nanoparticles with coefficient of variation (C.V.) defined as the ratio of the standard deviation to the mean diameter smaller than 0.1. The synthesis mechanism of nanoparticles by liquid-phase reduction was divided into three stages by LaMer’s model [2]: (I) the number of particles (atoms) increases continuously. (II) When the number of atoms exceeds the critical supersaturation (Cmin), the atoms aggregate to form crystal nuclei, and the number of particles begins to decrease. (III) After a large number of atoms are consumed, the number of particles would gradually decline to below the critical supersaturation level (Cm). The number of particles no longer increases, and the growth of nuclei dominates the process (Figure 1). To synthesize monodisperse nanoparticles, the reagents must be uniformly mixed at the molecular level before stage III is started, and stage II and III have to be clearly divided. Therefore, we expect that a critical mixing time Tc exists in the synthesis process. In this paper, we fabricate glass microfluidic device with simple Y shaped microchannel and analyzed Tc for synthesis of monodisperse GNPs by evaluating particle diameter.

2. Materials and Methods

2.1. Glass Device

Soda-lime glass substrates (25 mm × 76 mm × 1.2 mm) were processed by micropowder blasting [3]. A Y-shaped microchannel was processed on the bottom glass substrate. Three holes were processed on the upper glass substrate. The fabrication process can be outlined as follows. A dry film resist (MS7050, Mitsubishi Paper Mills Ltd., Tokyo, Japan) was coated on the bottom substrate, and a mask pattern with a Y-shaped channel was then fabricated via photolithography. Subsequently, Al2O3 microparticles with a mean diameter of 25 μm were accelerated from the nozzle with a diameter of 0.8 mm toward the sample with high-pressure (0.3 MPa) airflow and an incident angle of 90°. In order to process the entire surface of the glass substrate, the substrate was repeatedly scanned by the X-Y stages at a constant velocity of 1000 mm/min and a moving step of 5 mm. On the other hand, two inlet holes and one outlet hole on the upper substrate were processed by a router with a diameter of 3 mm. The two fabricated glass substrates were immersed in dilute NH4OH/H2O2 solution (NH3OH:H2O2:H2O = 1:1:5) for 24 h to form a sealed channel. Finally, they were thermally bonded in the oven at 610˚C for 8 h and cooled at the rate of 30 °C/min under a pressure of 3.7 kPa. The two stacked glass substrates were sandwiched by two polished alumina plates to keep the glass surface smooth. In this study, the devices with channel widths of 260 μm (70 μm depth) was fabricated (Figure 2a).

2.2. Synthesis

Table 1 shows the reagents for the synthesis of GNPs. An aqueous solution of tetrachloroaurate (III) tetrahydrate (solution-A, 0.368 mM) was used as a source of Au ions. Aqueous solutions of sodium citrate acid (33.7 mM) and tannic acid (5.82 mM) were used as the reducing agent and protective agent, respectively. Solution-A (5 mL) was injected into Inlet-1, and a mixture of 4.0 mL reducing agent solution, 0.1 mL protective agent solution, and 75.9 mL distilled water (solution-B, 5 mL) was injected into Inlet-2 with a syringe pump at the flow rate of 0.01 to 0.1 mL/min (Figure 2b). In this study, the mixed solution in the device was collected in a bottle through the silicone tube. The absorption spectrum of the GNPs synthesized by the batch process remained unchanged after 1 week. After 1 week at the room temperature from the synthesis on the device, the visible-light absorption spectrum of the solution was measured for a qualitative evaluation of the size distribution of the nanoparticles. This study focuses on mixing before the growth process. The total mixing time, including the mixing time in the device and out of device need for synthesis of GNPs is constant for all flow rates and channel width. Therefore, by evaluating the time variation of the absorption spectrum of the solution in the batch process, we can confirm that the synthesis of GNPs was completed. Table 1 shows the reagents for the synthesis.

2.3. Characterization

The spectra of GNPs after 1 week from the synthesis were measured using a UV–vis spectrometer (UV-1240, Shimadzu Corporation, Kyoto, Japan), and the full width at half maximum (FWHM) and absorption wavelength at the peak were calculated. A small FWHM of the absorption peak resulted in a small size distribution of nanoparticles, and a small peak wavelength was induced by a small mean diameter. The synthesized GNPs were observed using transmission electron microscopy (TEM) (JEM-2010, JEOL Ltd., Tokyo, Japan) to evaluate dispersibility and nanoparticle diameter.

3. Results and Discussion

3.1. Absorption Spectrum and Mixing Time

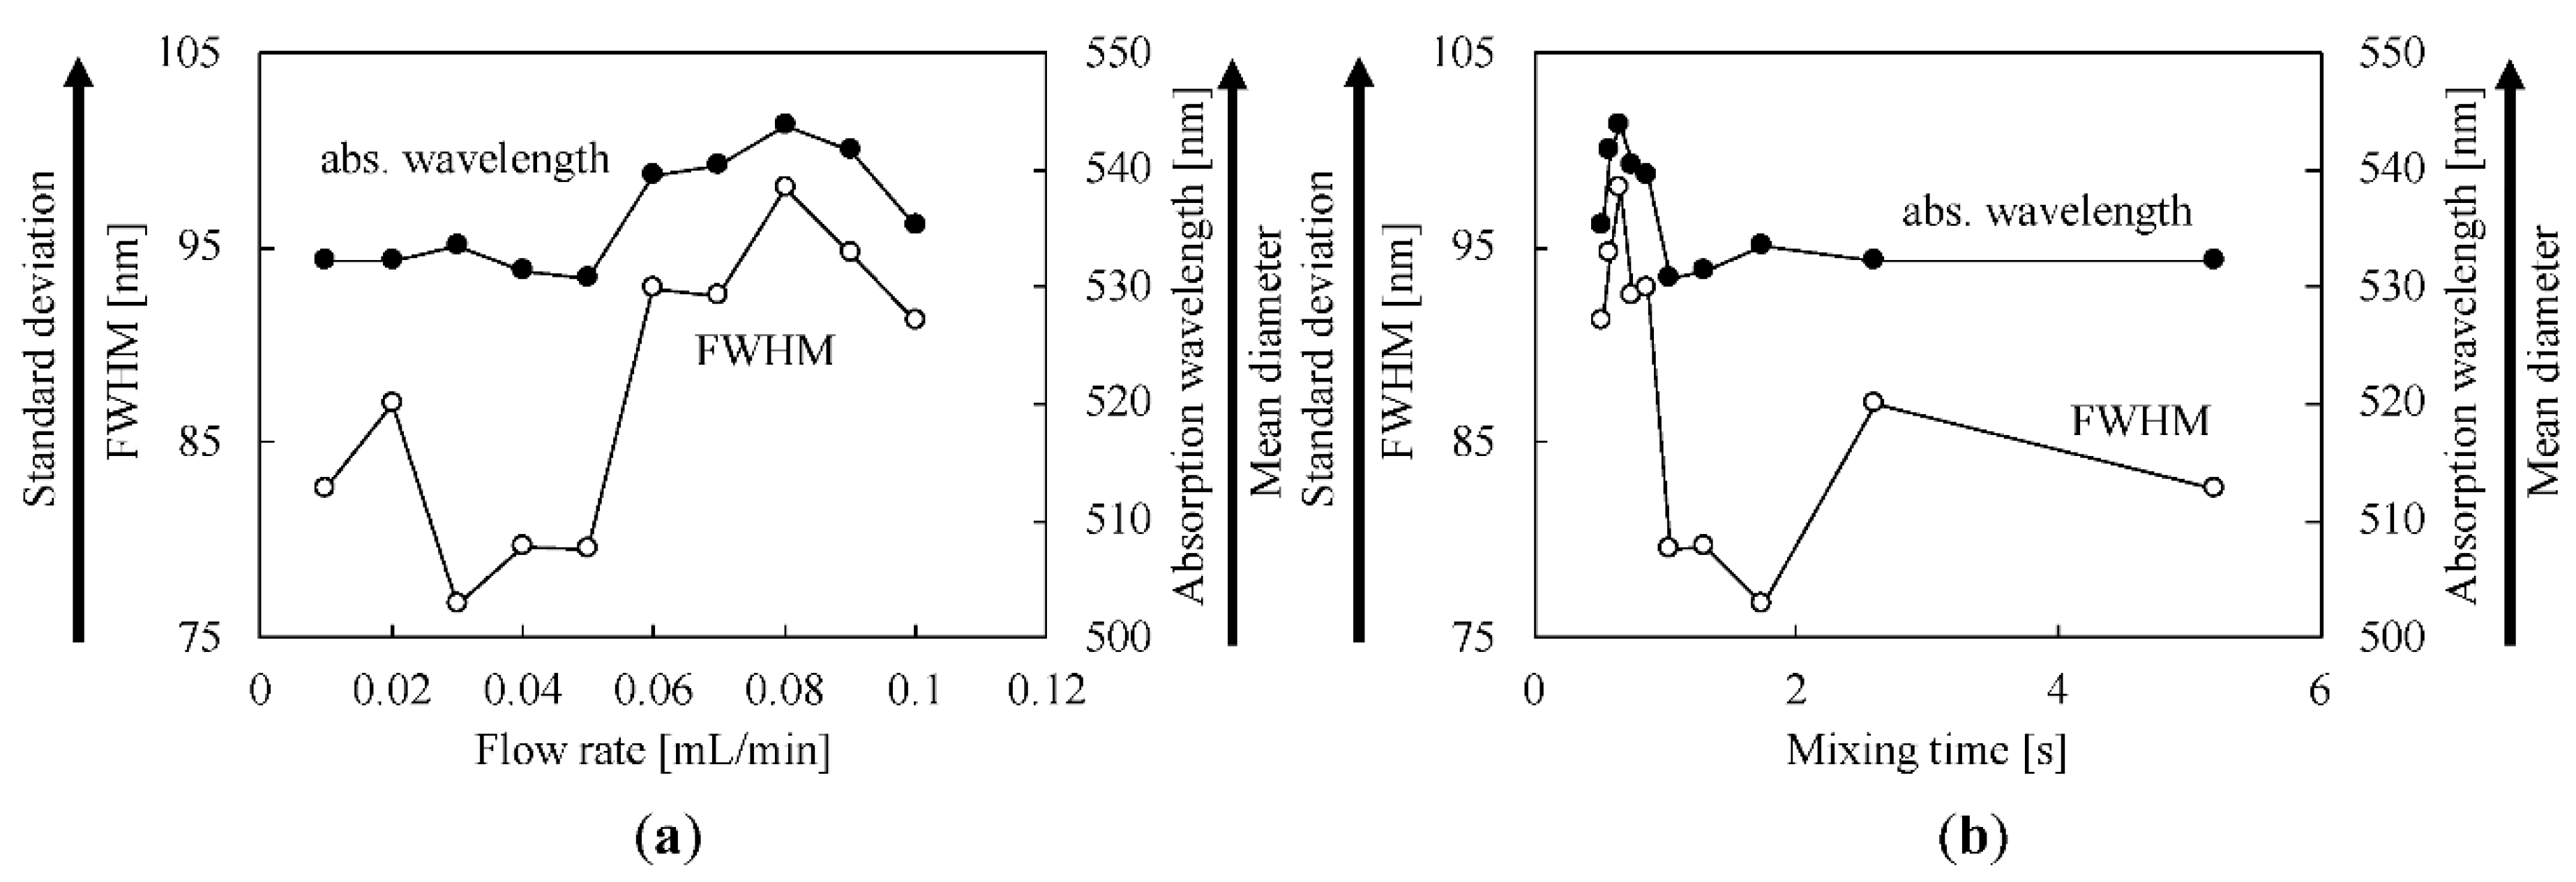
Figure 3a shows FWHM and absorption wavelength at the peak as a function of the flow rate. In the absorption spectrum of the synthesized GNPs, FWHM at the peak showed minimum value at the flow rate of 0.03 mL/min. The peak wavelength decreased at 0.05 mL/min. FWHM and absorption wavelength of the synthesized GNPs by the 100 mL beaker are 94.9 nm and 538 nm.
Figure 3b shows FWHM and absorption wavelength at the peak as a function of mixing time. In this study, the mixing time T was calculated from the flow velocity v and the channel length L using T = L/v = LS/Q. The flow velocity v was calculated from the flow rate Q of syringe pump and cross- sectinl area of the channel S, and the area was calculated as 1.3 × 10⁻⁸ m2 in the case of a semi-circular channel section, as shown in Figure 2a. At the flow rate of 0.03 mL/min, which showed minimum FWHM, the mixing time was calculated as 1.7 s from the semi-circular cross-sectional area of the microchannel and channel length (131.5 mm) after Y-shape junction.

3.2. Particle Size Distribution

Figure 4 shows TEM images of the synthesized gold nanoparticles. From TEM images, it was found that monodisperse GNPs with mean diameter of 11.5 nm and C.V. of 0.09 was synthesized at the flow rate of 0.05 mL/min as shown in Figure 5. Mean diameter and standard deviation of the synthesized GNPs by the 100 mL beaker are 17.6 nm and 3.85 nm. These results indicated that Tc is defined as 1.7 s, and the synthesis mechanism is subjected to LaMer diagram.

4. Conclusions

We have demonstrated the synthesis of GNPs in the simple Y shaped microchannel device, and the characterization of synthesized GNPs. The relationship of the diameter of the prepared nanoparticle and the mixing time confirmed that the critical mixing time Tc for monodisperse GNPs was existed in the synthesis process.

Acknowledgments

The present study was supported in part by the Tanaka Kikinzoku Memorial Foundation.

Conflicts of Interest

The authors declare no conflict of interest. The founding sponsors had no role in the design of the study; in the collection, analyses, or interpretation of data; in the writing of the manuscript, and in the decision to publish the results.

References

  1. Bolduc, O.R.; Masson, J.F. Advances in Surface Plasmon Resonance Sensing with Nanoparticles and Thin Films: Nanomaterials, Surface Chemistry, and Hybrid Plasmonic Techniques. Anal. Chem. 2011, 83, 8057–8062. [Google Scholar] [CrossRef]
  2. Lamer, V.K.; Dinegar, R.H. Theory, Production and Mechanism of Formation of Monodispersed Hydrosols. J. Am. Chem. Soc. 1950, 72, 4847–4854. [Google Scholar] [CrossRef]
  3. Yagyu, H.; Sugano, K.; Hayashi, S.; Tabata, O. Micropowder Blasting using Nanoparticles Dispersed Polymer Mask for Rapid Prototyping of Glass Chip. J. Micromech. Microeng. 2005, 15, 1236–1241. [Google Scholar] [CrossRef]
Figure 1. LaMer diagram. Tc is a critical mixing time for preparation of monodisperse nanoparticles.
Proceedings 02 00702 g001
Figure 2. (a) Photograph of the fabricated glass microfluidic device. (b) Schematic image of a joint section in the microchannel.
Proceedings 02 00702 g002
Figure 3. (a) The full width at half maximum (FWHM) and absorption wavelength at the peak as a function of the flow rate. (b) FWHM and absorption wavelength at the peak as a function of mixing time.
Proceedings 02 00702 g003
Figure 4. TEM images of the synthesized GNPs by the device at the flow rate of 0.01, 0.05, 0.1 mL/min, and by 100 mL beaker.
Proceedings 02 00702 g004
Figure 5. (a) Mean diameter and (b) standard deviation as a function of the flow rate.
Proceedings 02 00702 g005
Table 1. The reagents for the synthesis.
ReagentSolution-ASolution-B
HAuCl4·4H2O1 g-
Sodium citrate acid (33.7 mM)-4.0 mL
Tannic acid (5.82 mM)-0.1 mL
H2O79 mL75.9 mL
Publisher’s Note: MDPI stays neutral with regard to jurisdictional claims in published maps and institutional affiliations.