1. Introduction
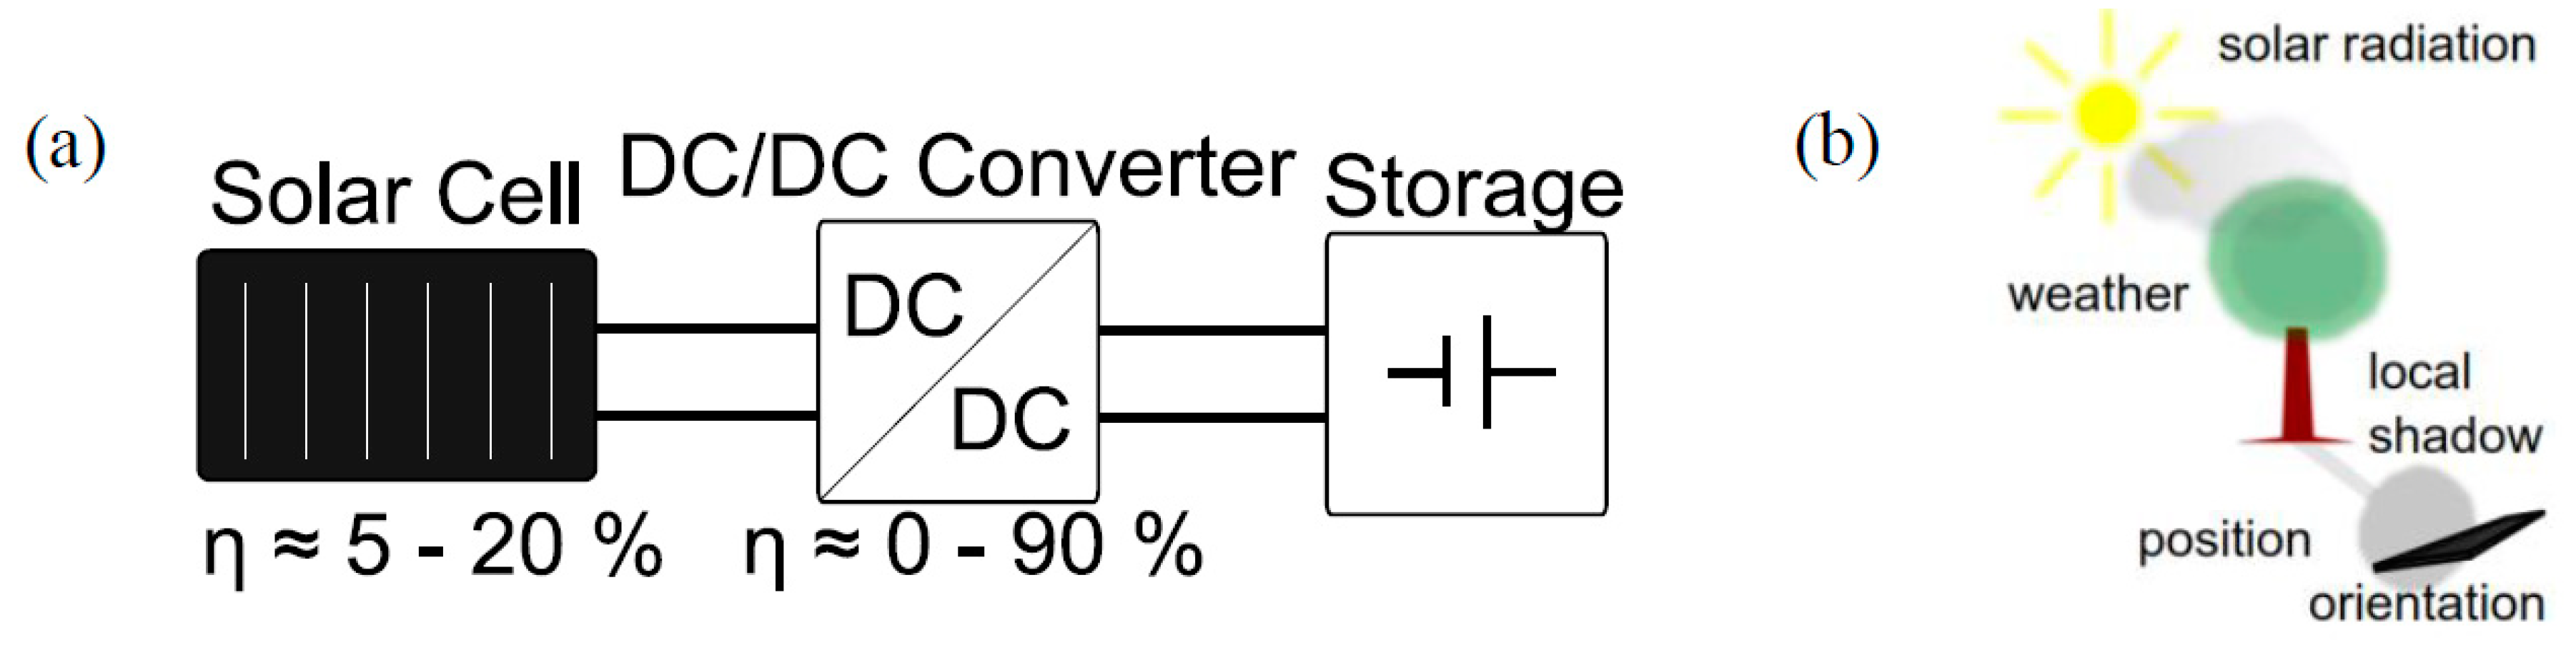
Wireless sensor nodes (WSNs) are miniaturized electronic systems commonly used to measure, collect and transmit environmental data. Usually they operate in remote areas with difficult access, i.e., energy has to be provided by means of a battery, by energy harvesting or by a combination of both. To power a WSN via energy harvesting, photovoltaic (PV) cells with specialized DC/DC converters are commonly used in applications that give access to solar or artificial radiation, with the basic setup of
Figure 1a. This concept is also used within this study, however, it should be mentioned that all principles described here can also be applied for WSNs powered from thermal or mechanical energy harvesting. As the gathered data have to be sent to a receiver via a wireless connection, with a significant power drain from the WSNs limited energy budget, severe problems will occur, when the WSN is “inexpectedly” running out of energy. Therefore, intelligent control algorithms are used in a WSN, to adjust internal energy consumption and usage to the energy income to achieve, overall, an energy-neutral operation [
1]. These algorithms can be based on pure averaging of the energy income or, in the next step, on the prediction of energy income. To achieve good prediction results, the knowledge of local energy income of a WSN is indispensable.
There are different possibilities to measure energy income from solar radiation. As one example a photodiode with a spectral response similar to the PV cell in use can be used [
2]. Furthermore, the current flow to a storage unit can be measured and the energy income can be calculated from the gathered data. The disadvantage of using a separate sensor for energy income is the negligence of the electrical losses in the system. The second option, i.e., measuring the input current [
3], also causes some problems. First, to measure the current a serial resistor has to be included, which is generating losses. Second, if the storage is fully charged, the input current decreases, especially when energy is available. Thus, information about the currently available energy is lost for prediction purpose or even can falsify prediction.
Furthermore, there are lots of factors effecting the power income of a sensor node, as shown in
Figure 1b for photovoltaic energy harvesting. The effect of weather, local shadows of buildings or trees and the orientation of the PV cell are important and variable from application to application.
In this study, a third option for energy measurement is presented, where the transformed energy from a DC/DC converter is stored on an extra capacitor and the voltage difference is used to determine the actual income of solar energy via a charge measurement. Comparison with standard radiation profile delivers the basis for a self-learning prediction algorithm with low computing effort and reasonable accuracy in different application scenarios, as described in the following chapters.
2. Measurement Set Up
Within the study two PV cells in parallel configuration are used. The area of a single cell is 39 × 35 mm ± 0.2 mm, its open cell voltage under AM 1.5 conditions is VOC ≈ 4.2 V and its short circuit current ISC ≈ 37 mA [
4]. A specially tailored low-voltage DC-DC-converter [
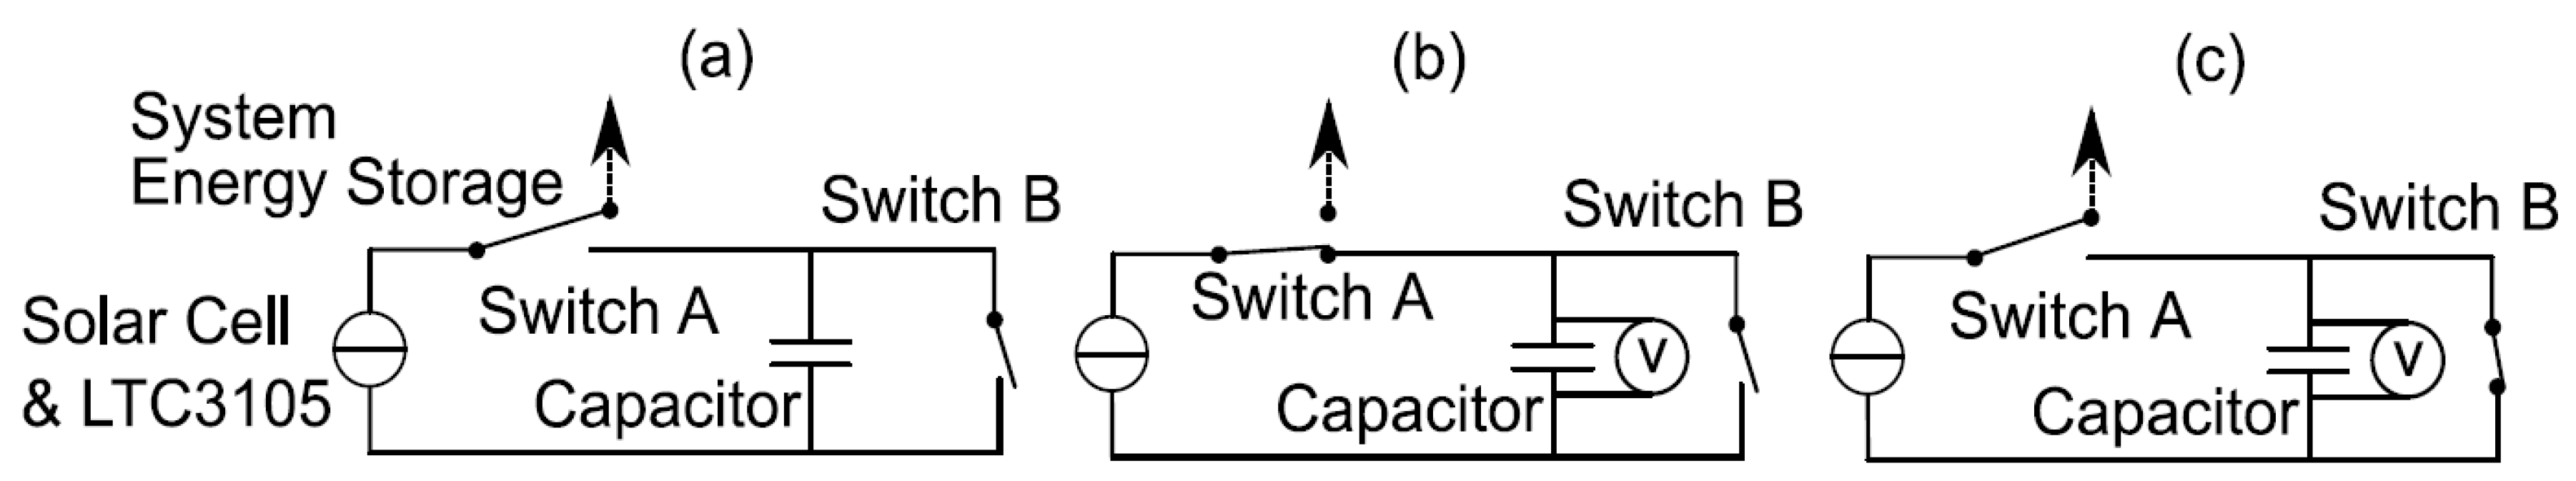
5] with up to 70% power conversion efficiency is connected in series to the PV panel. The converter’s output voltage is fixed to 3.3 V, in order not to exceed the input voltage range voltage of the microcontroller’s AD converter. In this study, an Arduino Due is used with an internal 12-bit AD converter. Using two MOSFET switches, the output of the DC-DC converter is switched to a 1000 µF or 330 µF capacitor in regular intervals and for a defined measurement interval (
Figure 2).
For switch A, a p-channel MOSFET (IRLML6402), whereas a n-channel MOSFET (IRLML250) is connected as switch B together with a 10 Ω discharge resistor. Both MOSFETs are operated from the Arduino Due.
As soon as switch A turns on (
Figure 2b), the empty capacitor is charged. After a waiting period of 120 µs, a pre-charged voltage
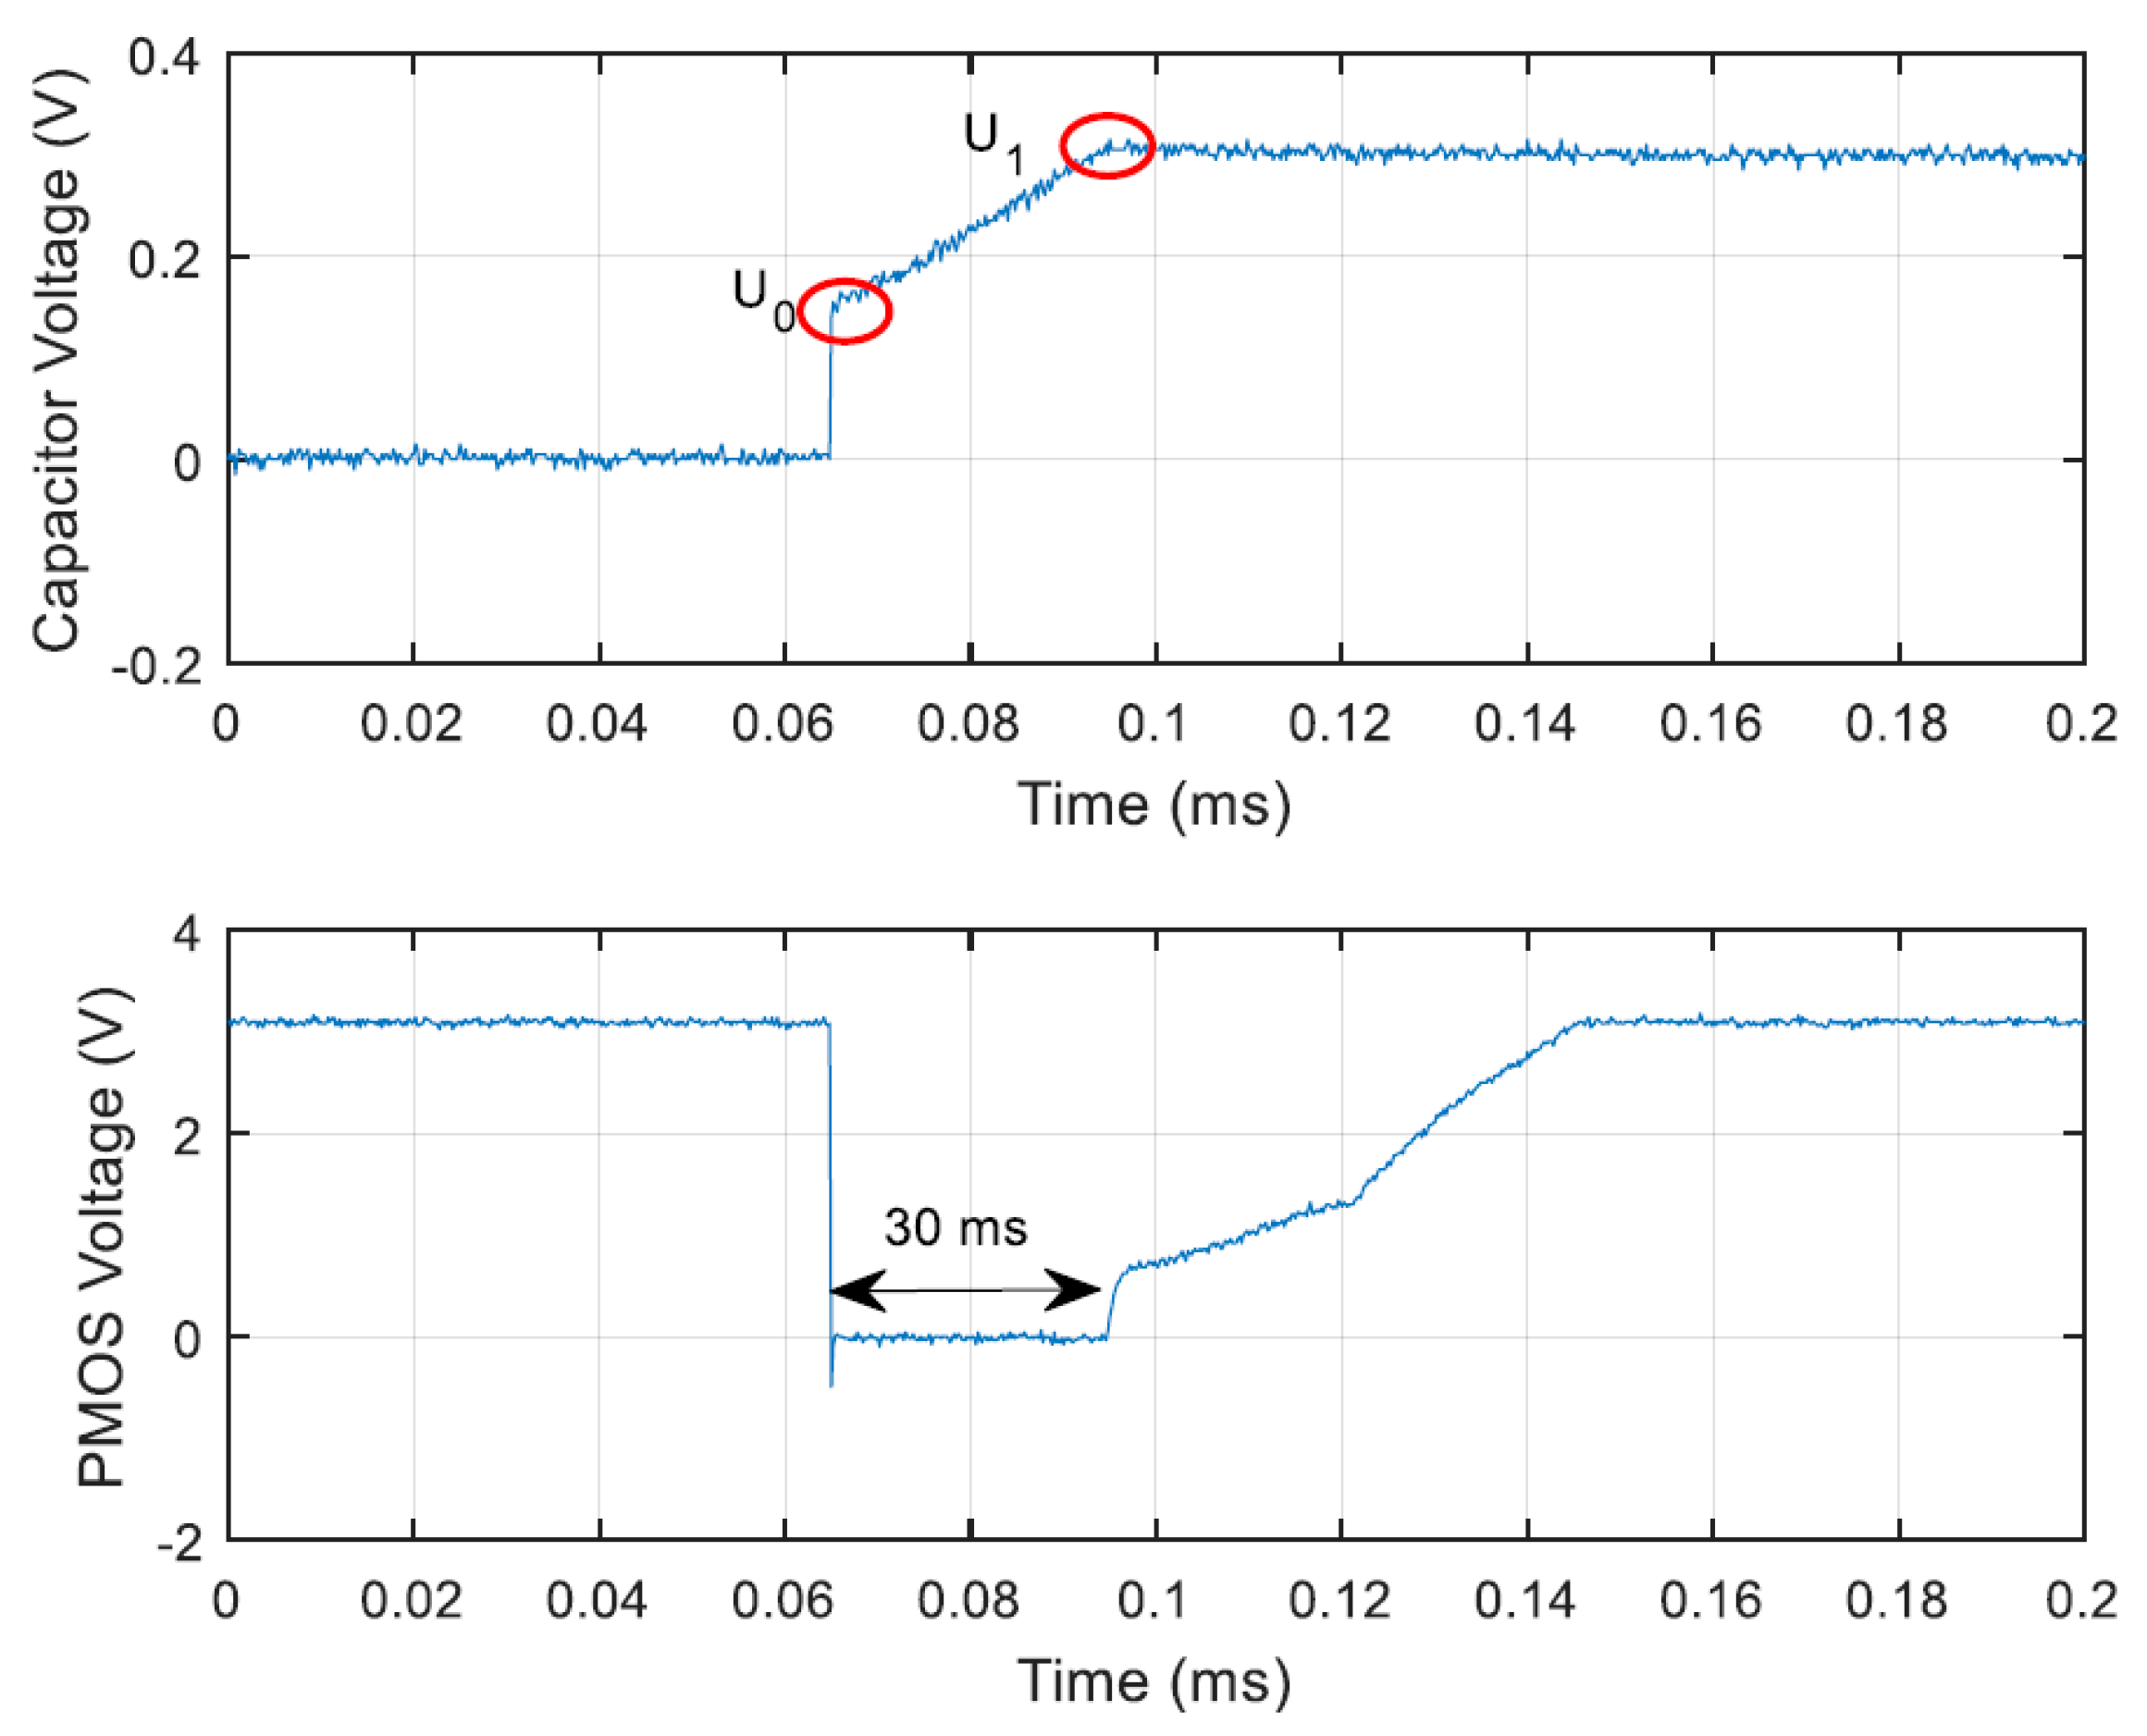
U0 is determined. Then, after a following period of 30 ms, the charging process is stopped and the end voltage
U1 is measured. Finally, the capacitor is discharged again again (
Figure 2c). With the basic equation
the energy on the capacitor can be calculated with reasonable accuracy, with neglecting all inrush or leakage currents present in the capacitor.
Figure 3 shows, as an example, the trend of the capacitor voltage when recorded in the laboratory. For illumination a natural light bulb (EXO Terra, “Natural Light”, 25 W, HAGEN Deutschland GmbH & Co. KG, Holm, Germany) with daylight spectrum is used. The voltages
U0 and
U1 are highlighted.
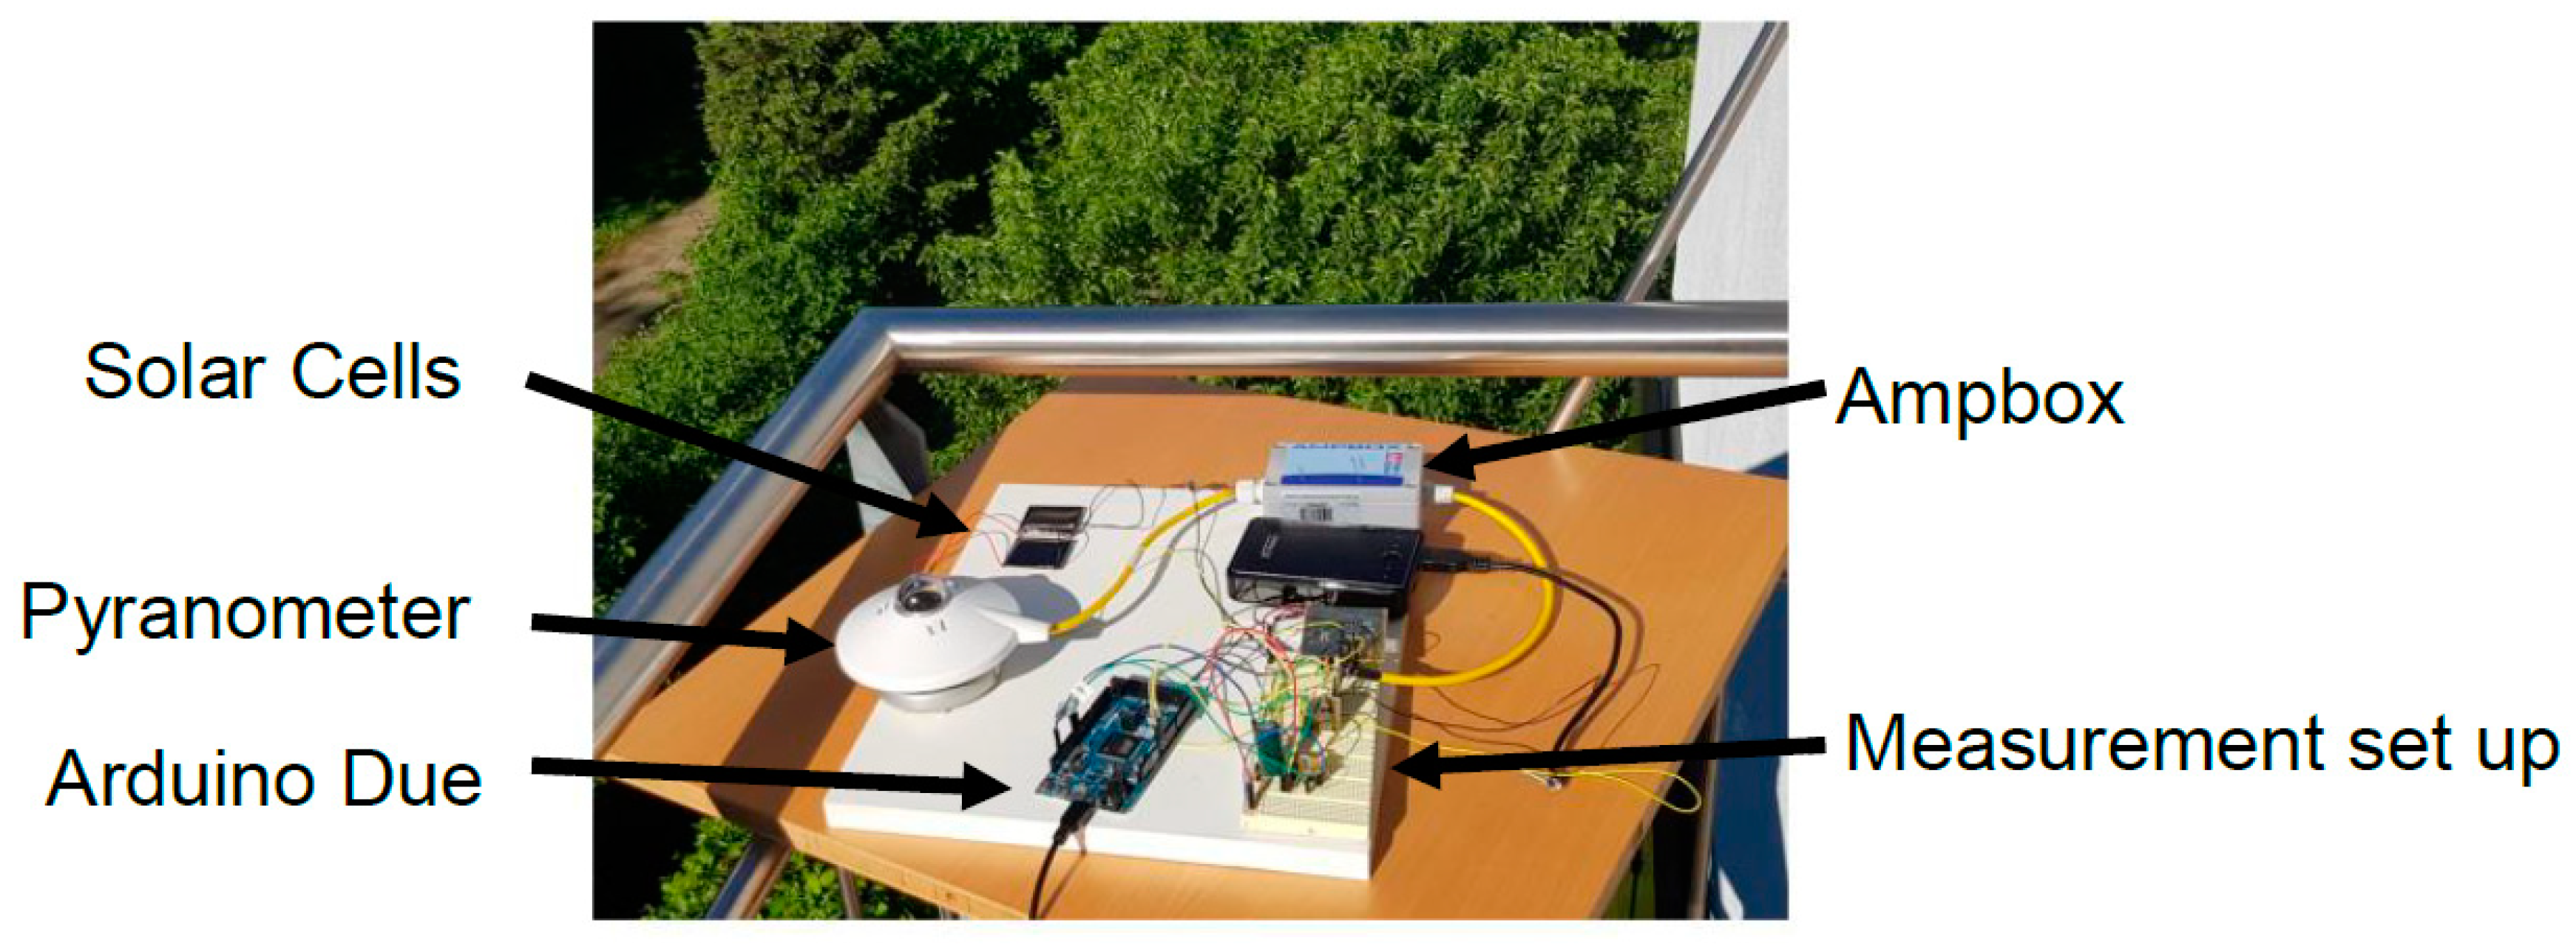
Figure 4 shows the principal set up used for outdoor measurements. It consists again of two PV cells parallel [
4] and the aforementioned DC-DC converter [
5]. In parallel, solar irradiance is measured with a pyranometer (CMP3 and Ampbox, Kipp&Zonen, Delft, the Netherlands) [
6].
3. Results
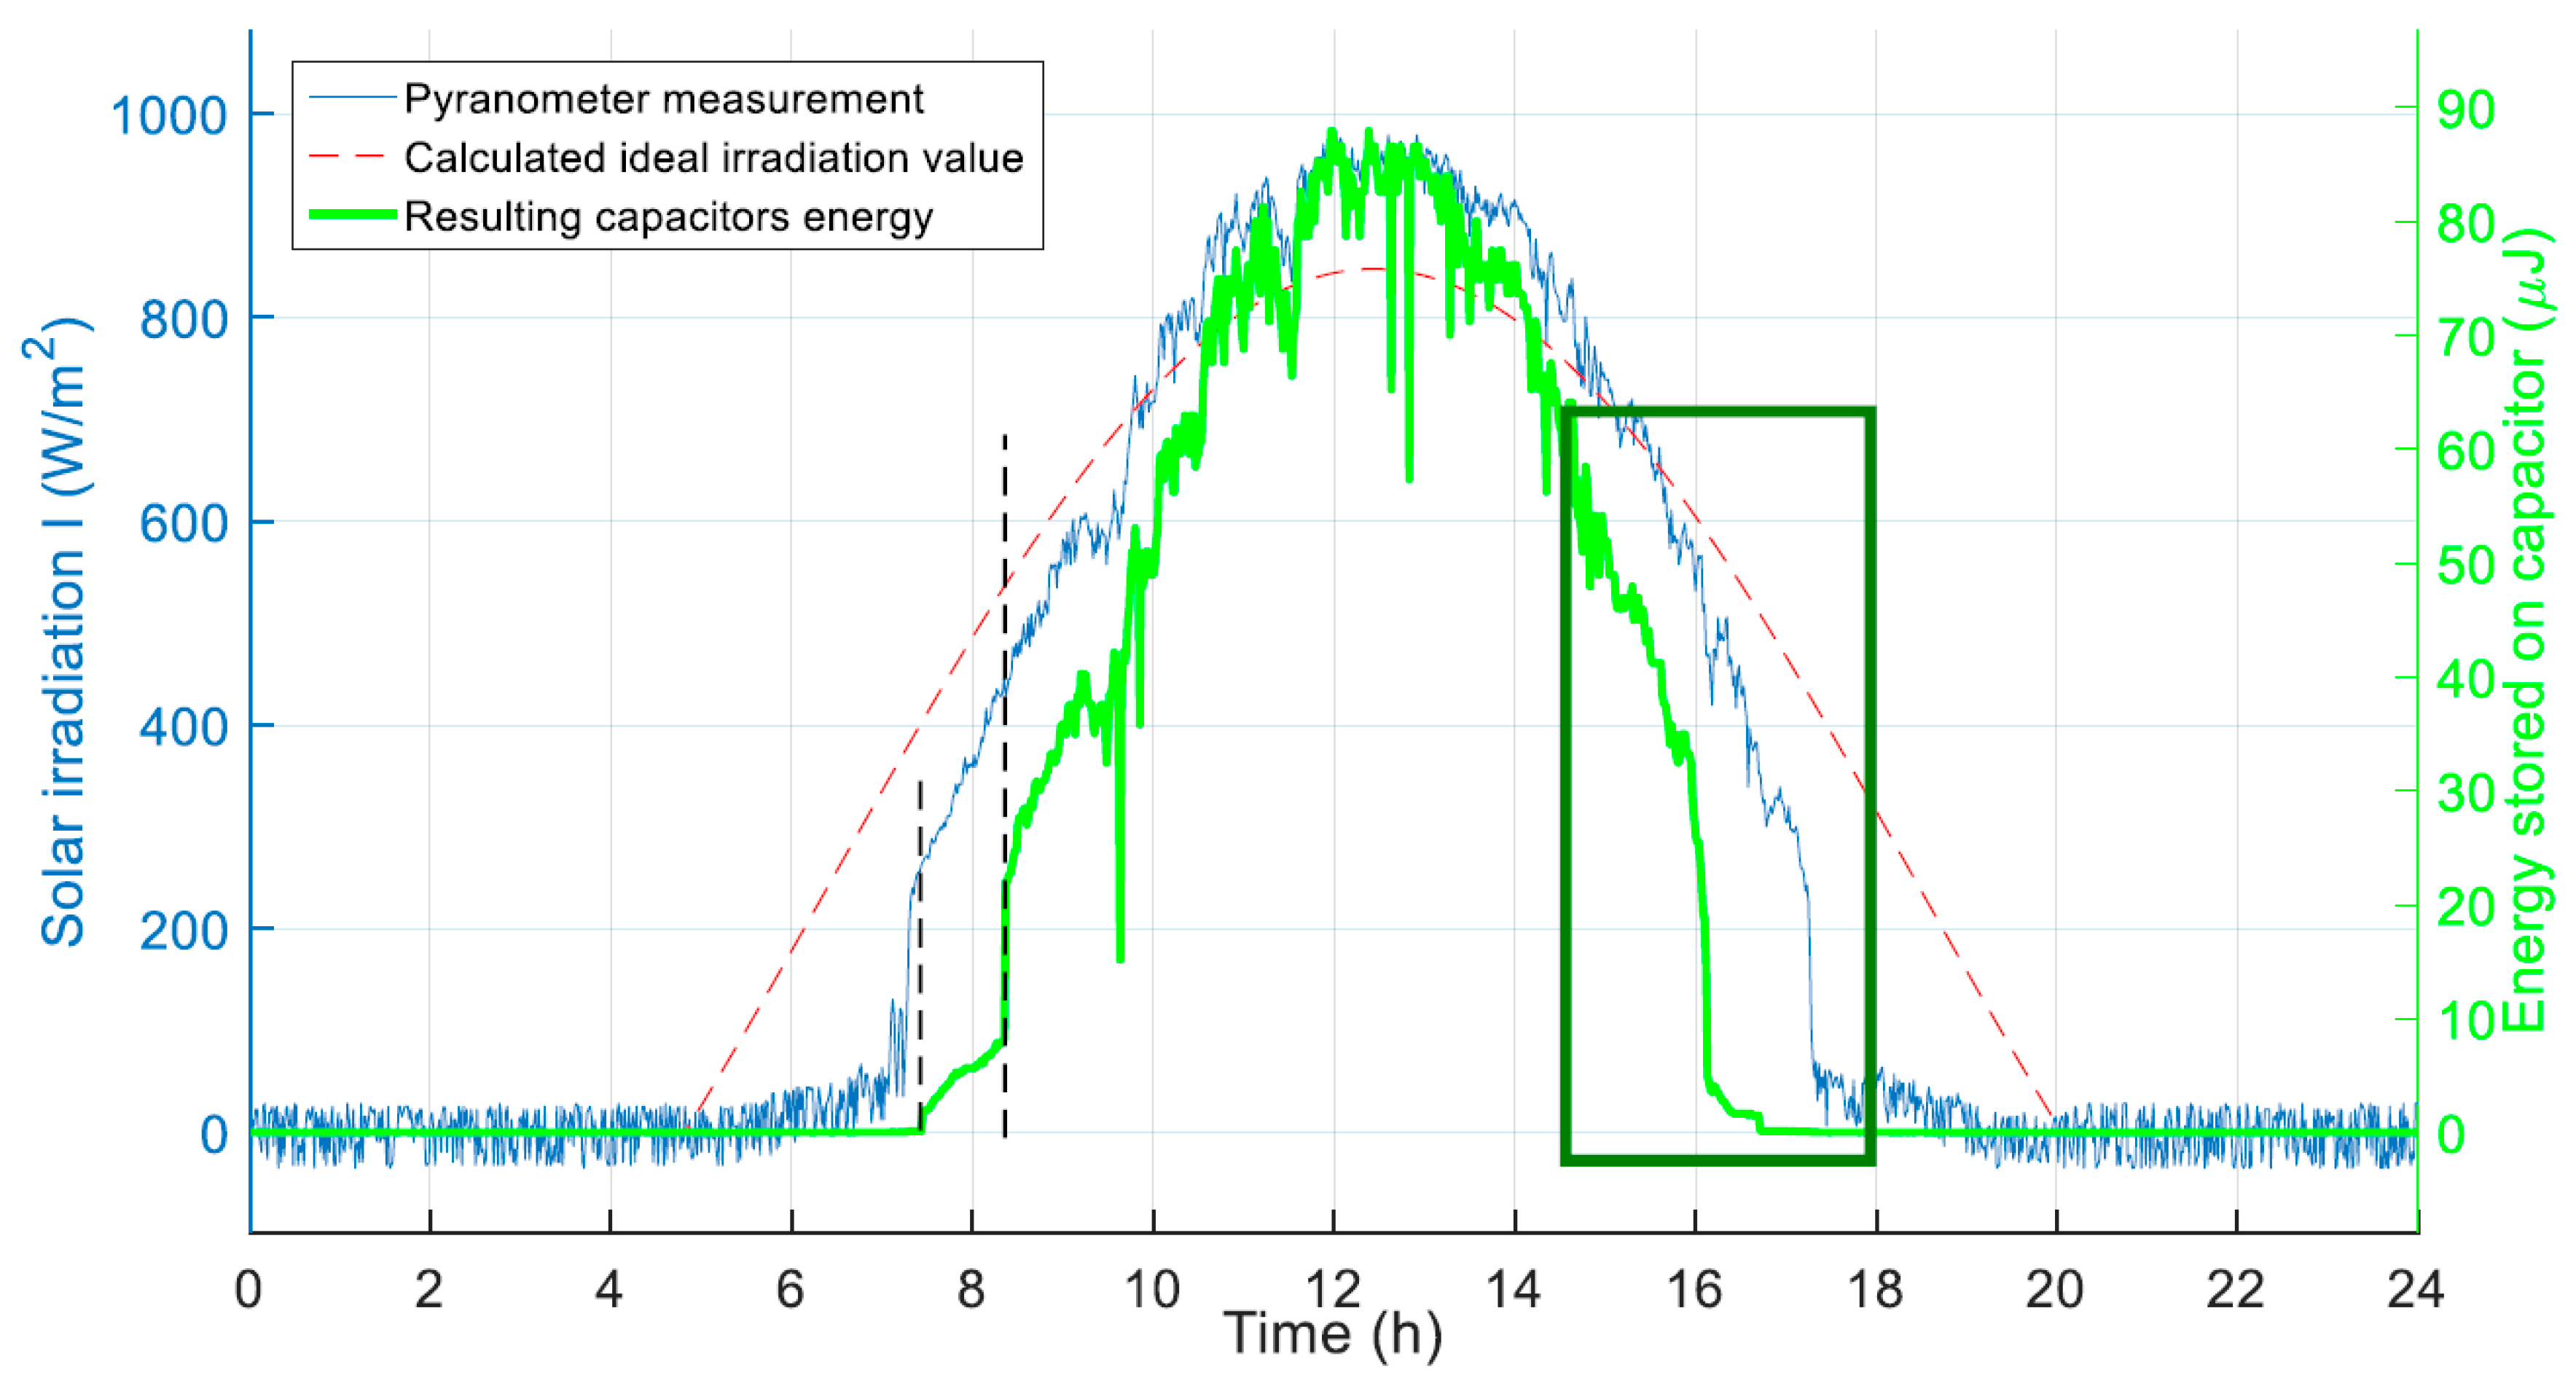
Measurement results for a full day are shown in
Figure 5, with the ideal energy income is calculated based on the actual sun position. A value is recorded every minute. The pyranometer values (left
y-axis) are starting to increase later than expected due to shadow effects of the building close to the measurement site. Also, reflections from the building wall and windows are leading to a higher peak radiation up to 990 W/m
2. With Equation (1) the resulting energy on the capacitor is calculated. The values are following the pyranometer measurement. At the beginning and the end of the day (box), a larger difference is visible between pyranometer values and the capacitor measurements. This is due to the fact that the DC-DC converter requires a certain start-up voltage for resuming operation. Taking into account by a calculation, that the efficiency of DC-DC conversion (η
DC ≈ 60%) and PV cell (η
solar ≈ 8%), the actual energy income is only about 10–15% of the expected energy available from solar radiation at the effective cell area. Further influences arise from the realistic sun angle, calculated by the ideal coarse of the sun, from the resulting effective area of the PV cells and more effects. Especially the delayed start-up and earlier drop-out of DC-DC conversion is an important influence parameter reflected in the measurement results. This effect does also show the importance of measuring energy income at the appropriate power transfer point, here the output of the DC-DC converter, to gain realistic data.
4. Discussion
The results of the measurements are representing the desired properties. Not only the shadowing of the PV cells is viewable in its effect, also the start-up voltage of the DC-DC converter, which allows, in this set up, effective energy harvesting only above an irradiation of 400 W/m2 takes severe influence on the actually harvested energy. Both is important information for a realistic estimation of the energy income. The difference between the expected energy income when calculated from datasheet values of the components and calculated from the capacitive energy measurement has to be further examined, since here are still deviations detected. Nevertheless, the idea of sensing the energy income works and is adaptable to different types of energy harvesting systems.
Author Contributions
The programming and measurements are part of a Bachelor Thesis of D.L. P.M. conceived and designed the experiments, designed the electrical components, analyzed the data and wrote the paper. The research was conducted in the Laboratory for Design of Microsystems under the supervision of and with scientific input and discussions by P.W.
Acknowledgments
The authors acknowledge the funding of the German Research Foundation (DFG), (GRK 1322).
Conflicts of Interest
The authors declare no conflict of interest. The founding sponsors had no role in the Design of the study; in the collection, analyses, or interpretation of data; in the writing of the manuscript, and in the decision to publish the results.
References
- Kansal, A.; Hsu, J.; Zahedi, S.; Srivastava, M.B. Power management in energy harvesting sensor networks. ACM Trans. Embed. Comput. Syst. 2007, 6, 32. [Google Scholar] [CrossRef]
- Viehweger, C. Modellbasiertes Energiemanagement für die Intelligente Steuerung Solarversorgter Drahtloser Sensorsysteme. Ph.D. Thesis, TU Chemnitz, Chemnitz, Germany, 2016. [Google Scholar]
- Vračar, L.; Prijić, A.; Nešić, D.; Dević, S.; Prijić, Z. Photovoltaic energy harvesting wireless sensor node for telemetry applications optimized for low illumination levels. Electronics 2016, 5, 26. [Google Scholar] [CrossRef]
- Product specification, Solar Cell Module YH-39x35, Conrad Electronic SE, 2015. Available online: http://www.produktinfo.conrad.com/datenblaetter/175000-199999/191308-da-01-en-SOLARZELLE_4V_35_MA.pdf (accessed on 10 January 2019).
- LTC3105, 400 mA Step up DC/DC Converter with Maximum Power Control and 250 mV Start-up; Linear Technology: Milpitas, CA, USA, 2010; datasheet, LT 1115 REV B, 010.
- Instruction Sheet, CMP3—Pyranometer & Ampbox; Kipp&Zonen B.V.: Delft, the Netherlands, 2016; V1603.
| Publisher’s Note: MDPI stays neutral with regard to jurisdictional claims in published maps and institutional affiliations. |
© 2019 by the authors. Licensee MDPI, Basel, Switzerland. This article is an open access article distributed under the terms and conditions of the Creative Commons Attribution (CC BY) license (https://creativecommons.org/licenses/by/4.0/).
