1. Introduction
In recent years, efforts to develop devices to assist helpless elderly people living alone have been increasing. In 2010, an estimation of over 35 million people with dementia was reported worldwide [
1]. Facing this reality, scientists have evaluated alarming systems for dementia patients at home [
2]. In the last decade, several products have been introduced to the market. They claim to be capable of measuring respiration and cardiac frequencies, among other parameters. However, all of them with the exception of one [
3], are not classified as medical devices, which indicates that they do not fulfil minimal requirements to reach such classification. Some of the reasons could include financial interests or market shares. However, it was clear that the flexibility in placing the devices was a major factor in the design of these commercial products because they can simply be placed below or over the mattress. Unfortunately, this flexibility does not make use of the measuring direction which the cardiac component of the BCG signal is the strongest. Therefore, they require more elaborate signal processing and signals with less distinctive waveforms. This statement is made based on an investigation that displays measurements in different axes for different postures [
4]. According to their results, the largest cardiac component was measured in the head-foot (HF) axis and it was about twice the magnitude of the one measured in the antero-posterior (AP) axis.
Different than the devices in the market, our measurement setup was placed at the head of the mattress. Other than larger cardiac signals, the respiration component decreases in the proposed axis. Thus, splitting both components becomes an easier task than those treated from available setups. Such a system could determine restlessness, bed attendance and then alarm medical assistance.
2. Measurement Technique, Signal Processing, and Machine Learning
BCG first known records date back to 1877 [
5]. Due to the complex filtering and analysis required, the technique was left aside. Nowadays, such signals can be easily filtered and their analysis can be carried out using different techniques. In practice, BCG measurements contain all body movements including respiration and cardiac activity. The latter can be measured along three primary body axes: HF, AP and left-right. The different movement components can be relatively maximized or minimized depending on the measurement principle and sensor position. This was observed in a study involving measurements of 23 piezoelectric stripes equally spaced along a mattress [
6]. Both cardiac and respiratory magnitudes were the largest right below the chest. For measurements below the head, the cardiac component reduces to half while the respiratory component practically vanishes.
Respiratory and cardiac components are separated by one order of magnitude in the frequency domain: 0.2–0.3 Hz and 1–4 Hz, respectively. In fact, BCG cardiac components extend to even higher frequencies. Therefore, their separation is easily done by digital filters before further data processing. Values from previous works were considered to define the filters’ boundaries [
7,
8].
Both cardiac and respiration signals are periodic, however, the morphological periodicity of the former is more complex. Thus, an unsupervised pattern recognition algorithm was implemented to detect its cycles. The algorithm clusters feature vectors in a hierarchy of nested clusters based on the dissimilarity measure between them. Each vector contains a portion of the signal, following a local maximum (i.e., a peak) and covers a temporal length of 0.66 s, which corresponds to a heartbeat cycle interval of 90 bpm, a mid-range heart rate [
9]. The dissimilarity function
d(
x,
y), which is based on the angle between vectors, is calculated using an arccosine function [
10]. The used conditions were
α = 3 and
tmin = 0.33 (see Equation (1)), which suit this application and decrease computation. Note that allows
tmin a maximum heart rate detection of 180 bpm. The angular dissimilarity ignores the differences in amplitude among feature vectors and compares their waveforms [
9].
where
x and
y are the two vectors being compared,
x1 and
y1 are their first respective elements.
The signal is divided successively in epochs of 10 s and they are processed independently. The dissimilarity d is calculated among all vectors in an epoch and the hierarchy is generated, in which most similar vectors (least dissimilar) are grouped together one after the other. To conclude the hierarchy in a useful manner, a dissimilarity threshold, selected after some experimentation, is used to provide a final clustering. The most appropriate cluster to represent the heart cycles is the one with the largest number of elements. If two clusters have the same number, the one with the least dissimilarity average is chosen. A sample epoch of 5 s and a dendrogram of the corresponding clustered vectors are shown in
Figure 1, the dissimilarity threshold here is π/4, and the dendrogram is displayed accordingly.
3. Experimental
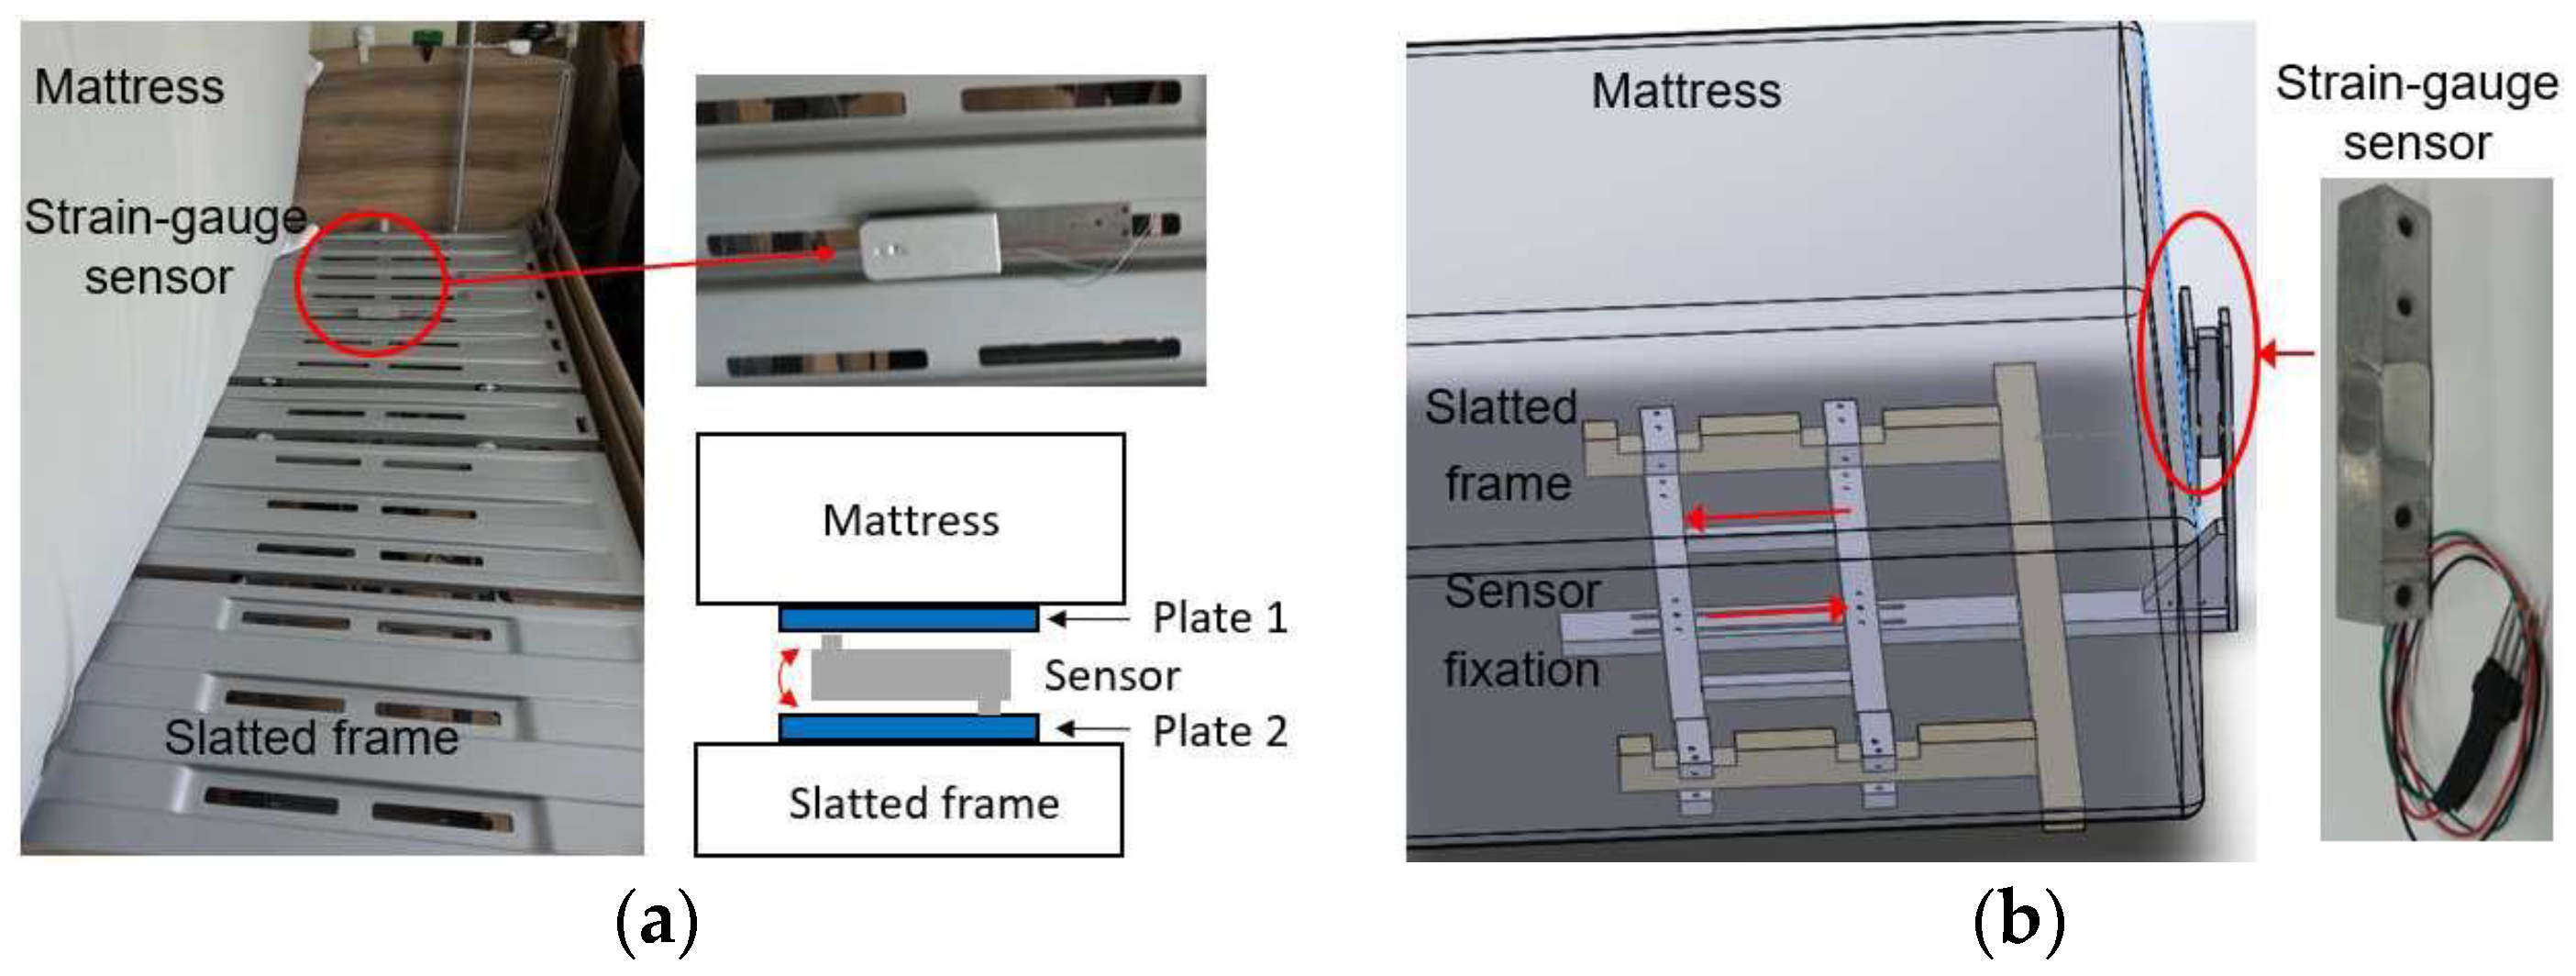
The experiments had the target of determining the most appropriate position to place the sensor and its efficiency. The measurements were realized using a low-cost strain-gauge sensor normally used in weighing scales up to 5 Kg. The electronic circuit was based on an AVIA Semiconductor 24-bit HX711 analog-to-digital converter, and an Arduino Uno was used to collect the measurement data. The sensor was placed below (see
Figure 2a) and at the center at the head of a mattress (see
Figure 2b) to monitor the signals from a single male patient during 60 s.
BCG measurements were synchronized with ECG from an AD8232 Heart Rate Monitor (SparkFun Electronics, Niwot, CO, USA). The measurements were realized with three different patients in four body postures: prone, supine on their right and left sides. The respiratory and cardiac signals were extracted using Digital Signal Processing (DSP) from Matlab 9.5 (The MathWorks, Inc. Natick, MA, USA). The former signal was obtained using a Butterworth band-pass filter with cutoff frequencies of 0.05 and 0.5 Hz. The latter was done by a low-pass and a high-pass Finite Impulse Response (FIR) filters with cutoff frequencies of 20 Hz and 0.5 Hz, and orders of 80 and 540, respectively. Afterwards, the cardiac signal was processed with the previously mentioned algorithm in Matlab, while respiratory cycles were obtained using peak detection.
4. Results and Discussions
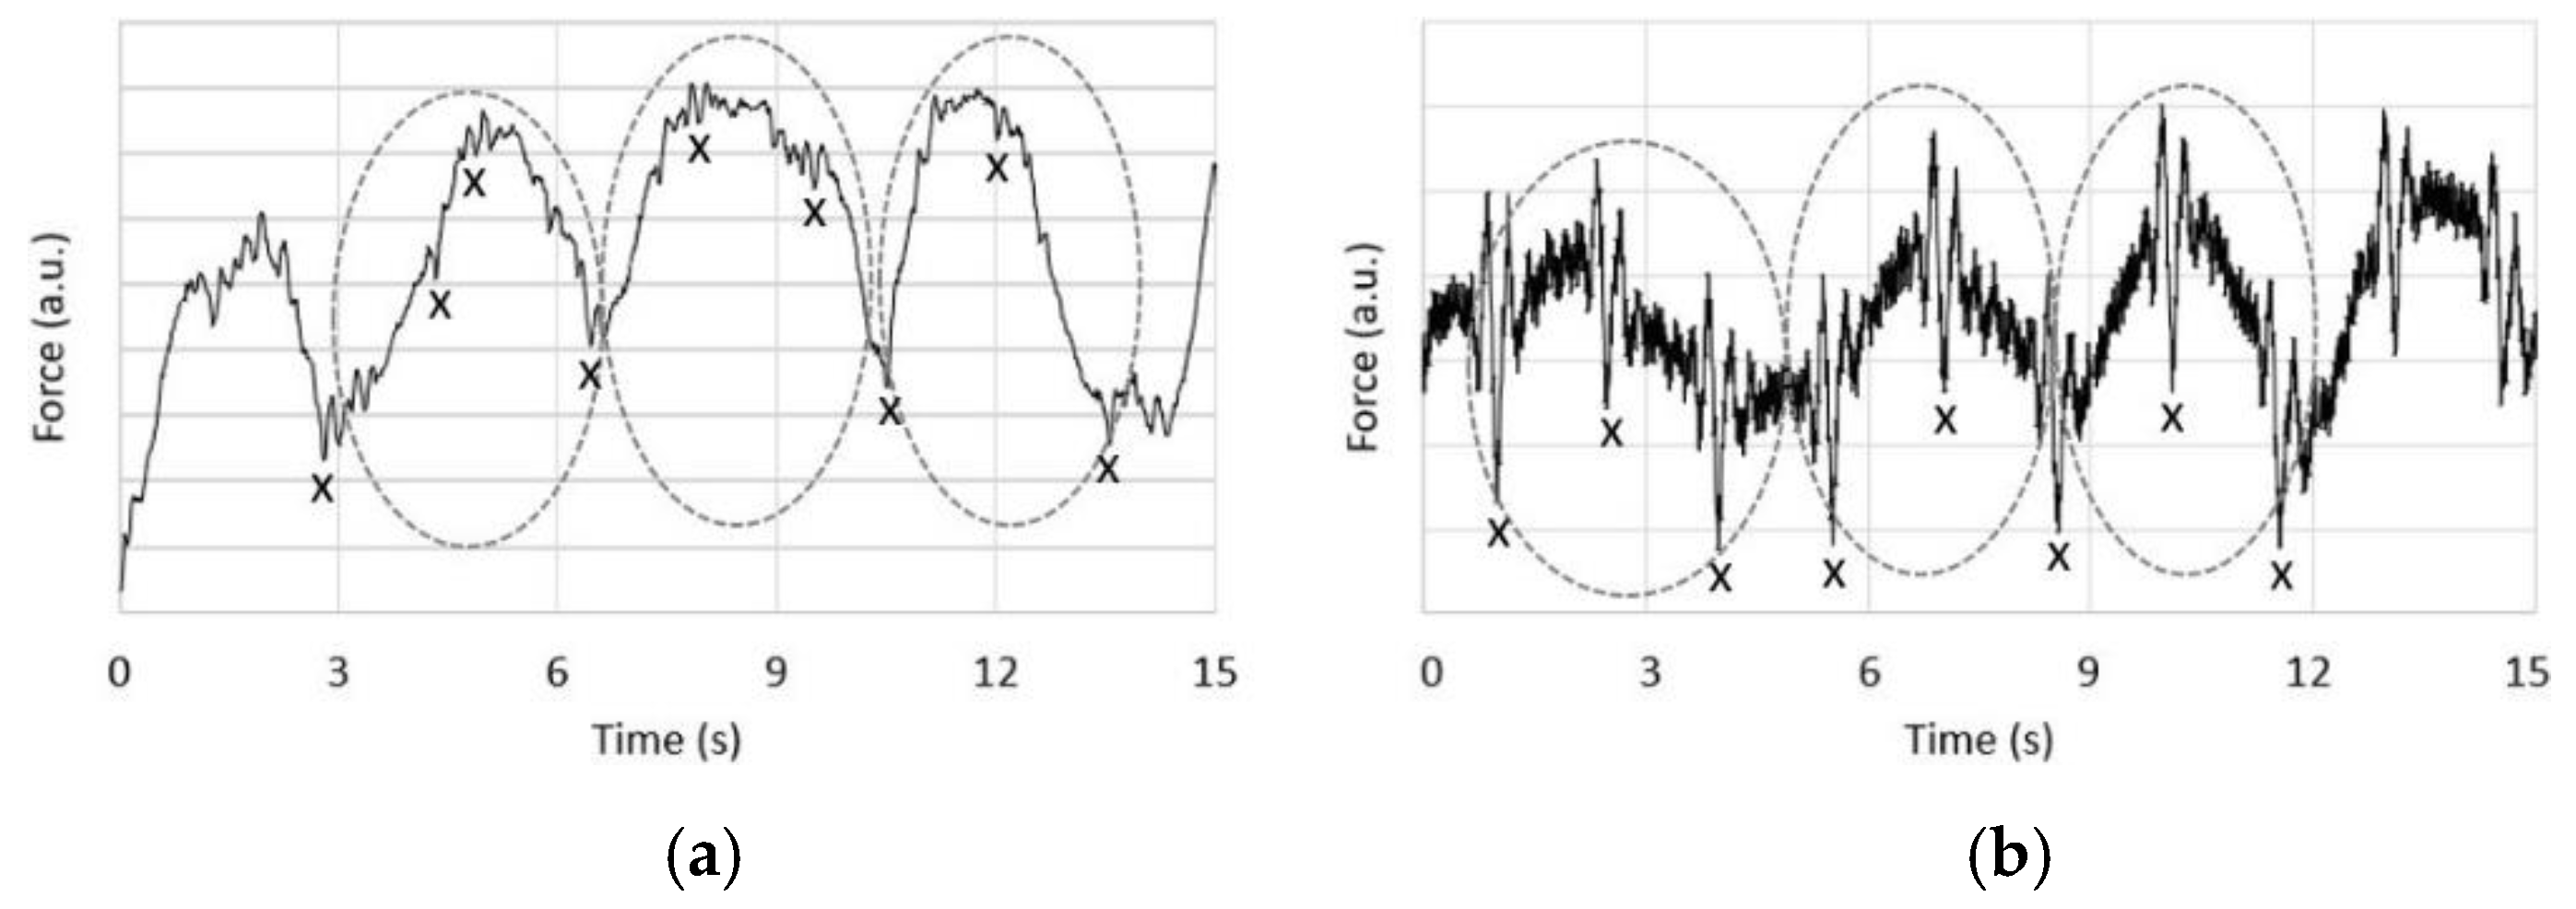
Measurements below and at the head of the mattress were carried out using the same sensor for comparison. Both sensor positions allow measurements of respiration and heartbeat. However, the cardiac component is easier observed from the measurements at the head of mattress (see
Figure 3).
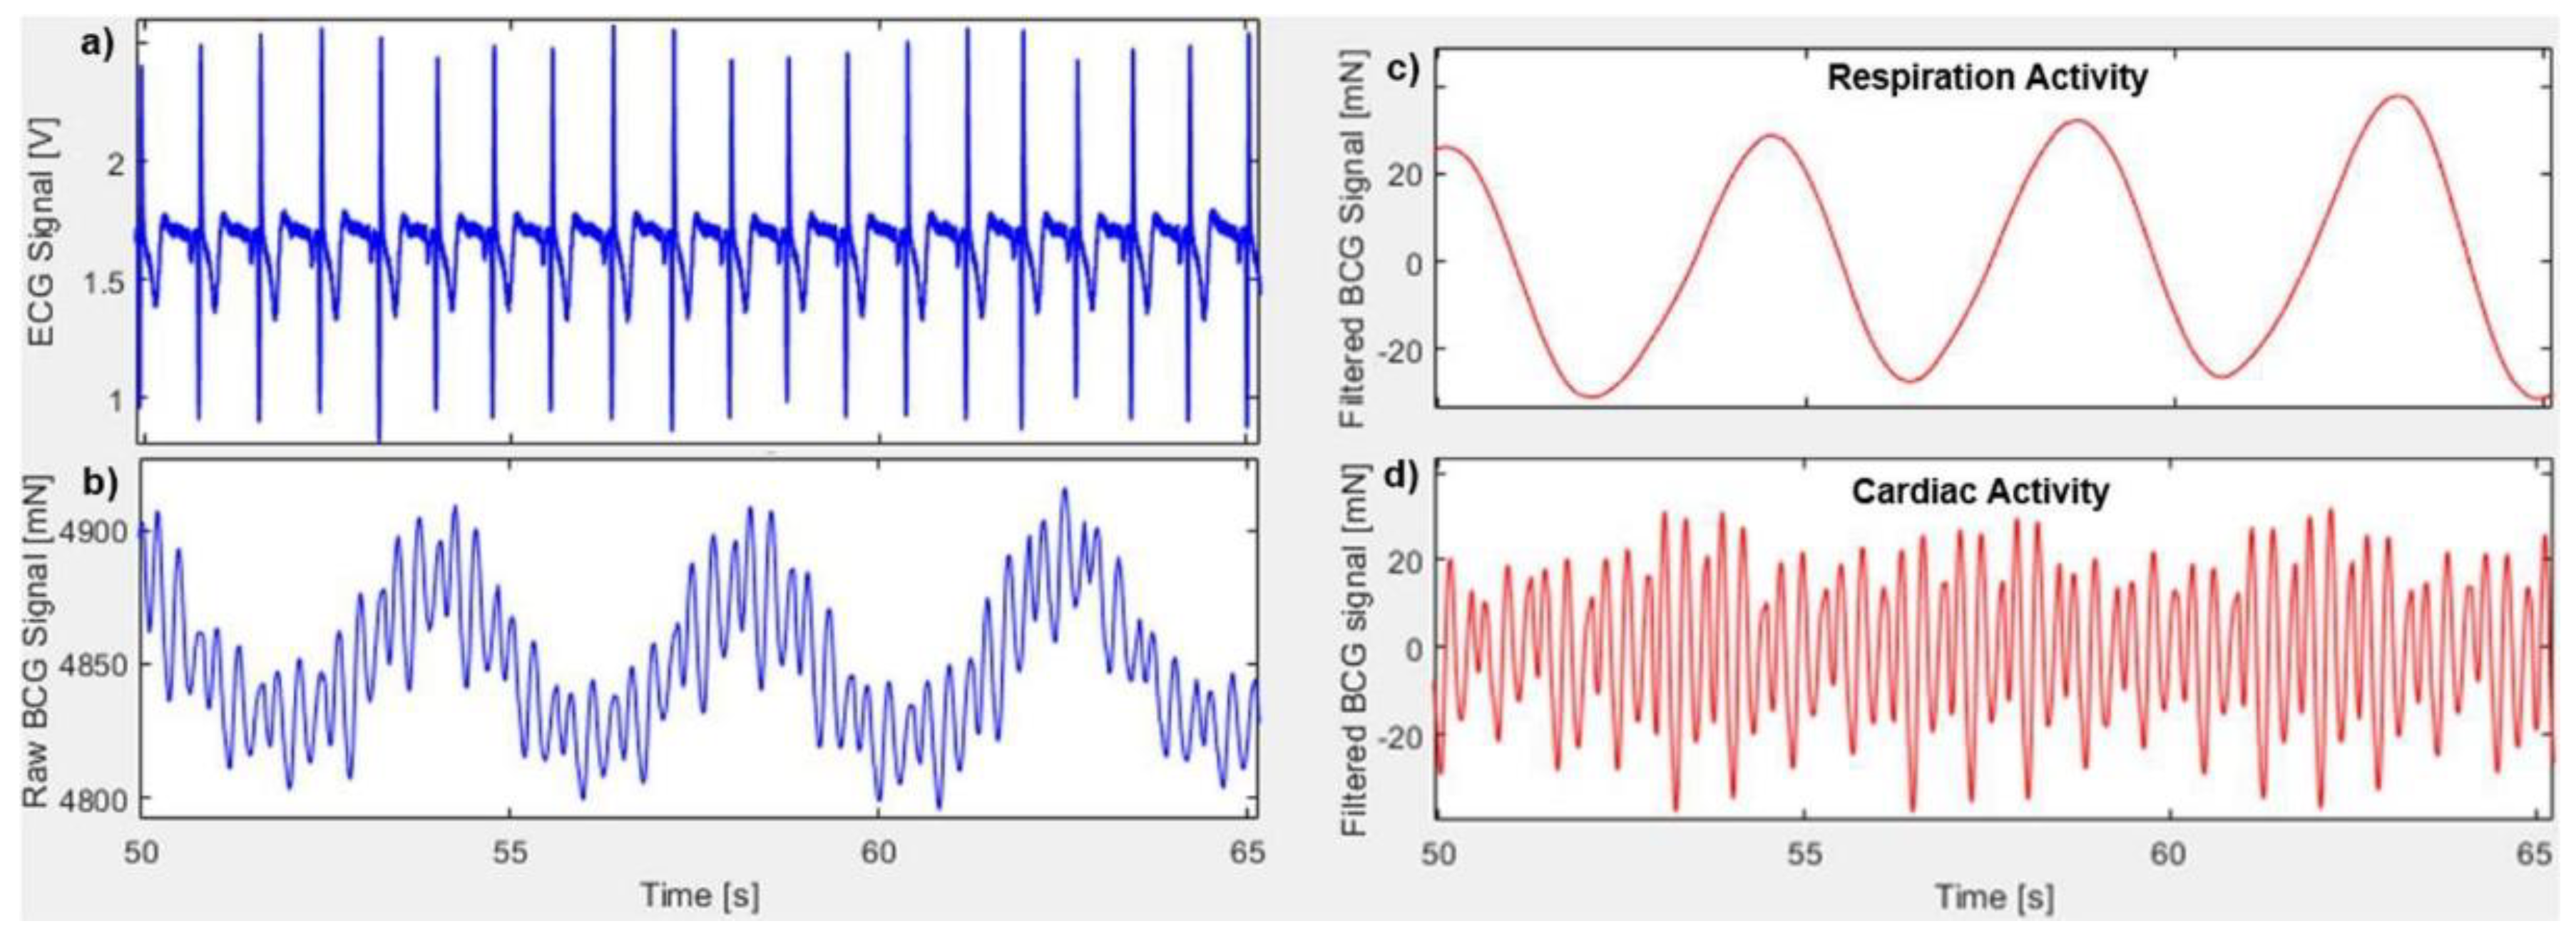
Synchronized ECG and BCG measurements, extracted respiration and cardiac signals with the sensor positioned at the top of the mattress are shown in
Figure 4. Cardiac signal peaks were identified, clustered (see
Figure 1) and beat-to-beat heart rate was calculated through the best cluster, with a dissimilarity threshold of 1 rad in this case.
An overview of the results reached with our setup is displayed in
Table 1. The highest recognition rate was reached for patients laying in a supine posture. The most unclear signals were acquired when the patients lay on their sides and, consequently, a lower heartbeat recognition. Apparently, there is a correlation between heartbeat recognition rate and body type. However, further investigation is required to draw conclusions regarding this matter.
5. Conclusions
This work presented a non-contact respiration and cardiac measurement setup consisting of an inexpensive sensor used in scales. The setup and sensor position were chosen to obtain stronger and high-quality signals, which simplifies signal processing. The main intention was to maximize the cardiac component to improve cycle detection efficiency. Therefore, more precise and trustable setups can be built. Recognition rates above 75% of heartbeats could be reached irrespective of patient and body posture.
Author Contributions
R.Z. designed the setup; A.A. handled DSP and algorithm; R.Z., F.L. and A.A. performed experiments and their analysis; U.M. had the initial idea and supervision.
Acknowledgments
This work was financed by the Federal Ministry of Education and Research of Germany under the IKT2020—Innovations in Care for People with Dementia. The authors are grateful for the support from Alexander Bejan and the Future Care Lab staff at the Furtwangen University.
Conflicts of Interest
The authors declare no conflict of interest.
References
- Wimo, A.; Prince, M. World Alzheimer Report 2010: The Global Economic Impact of Dementia; Alzheimer’s Disease International: London, UK, 2010. [Google Scholar]
- Nijhof, N.; van Gemert-Pijnen, L.J. An evaluation of preventive sensor technology for dementia care. J. Telemed. Telecare 2013, 19, 95–100. [Google Scholar] [CrossRef] [PubMed]
- Helfand, M.; Christensen, V.; Anderson, J. Technology Assessment: Early Sense for Monitoring Vital Signs in Hospitalized Patients; VA Evidence-Based Synthesis Program Evidence Briefs; Department of Veterans Affairs: Washington, DC, USA, 2016. [Google Scholar]
- Soames, R.W.; Atha, J. Three-dimensional ballistocardiographic responses to changes of posture. Clin. Phys. Physiol. Meas. 1982, 3, 169–177. [Google Scholar] [CrossRef] [PubMed]
- Gordon, J.W. Certain molar movements of the human body produced by the circulation of blood. J. Anat. Physiol. 1877, 11, 533–536. [Google Scholar] [PubMed]
- Vehkaoja, A.; Kontunen, A.; Lekkala, J. Effects of sensor type and sensor location on signal quality in bed mounted ballistocardiographic heart rate and respiration monitoring. In Proceedings of the 2015 37th Annual International Conference of the IEEE Engineering in Medicine and Biology Society (EMBC), Milan, Italy, 25–29 August 2015. [Google Scholar] [CrossRef]
- Paalasmaa, J.; Leppäkorpi, L.; Partinen, M. Quantifying respiratory variation with force sensor measurements. In Proceedings of the 2011 Annual International Conference of the IEEE Engineering in Medicine and Biology Society, Boston, MA, USA, 30 August–3 September 2011. [Google Scholar] [CrossRef]
- Gomez-Clapers, A. Serra-Rocamora, A.; Casanella, R.; Pallas-Areny, R. Towards the standardization of ballistocardiography systems for J-Peak timing measurement. Measurement 2014, 58, 310–316. [Google Scholar] [CrossRef]
- Paalasmaa, J.; Ranta, M. Detecting heartbeats in the ballistocardiogram with clustering. In Proceedings of the ICML/UAI/COLT 2008 Workshop on Machine Learning for Health-Care Applications, Helsinki, Finland, 9 July 2008. [Google Scholar]
- Theodoridis, S.; Koutroumbas, K. Pattern Recognition, 4th ed.; Elsevier/Acad Press: Amsterdam, The Netherlands, 2009. [Google Scholar]
| Publisher’s Note: MDPI stays neutral with regard to jurisdictional claims in published maps and institutional affiliations. |
© 2018 by the authors. Licensee MDPI, Basel, Switzerland. This article is an open access article distributed under the terms and conditions of the Creative Commons Attribution (CC BY) license (https://creativecommons.org/licenses/by/4.0/).


