Proceeding Paper

Optical Ammonia Sensor for Continuous Bioprocess Monitoring †

Institute of Analytical Chemistry and Food Chemistry, Graz University of Technology, 8010 Graz, Austria
*
Author to whom correspondence should be addressed.
Presented at the Eurosensors 2018 Conference, Graz, Austria, 9–12 September 2018.
Proceedings 2018, 2(13), 1041; https://doi.org/10.3390/proceedings2131041
Published: 19 November 2018
(This article belongs to the Proceedings of EUROSENSORS 2018)

Abstract

:
We present an optical ammonia sensor suitable for bioprocess monitoring. A fluorescent dye is physically entrapped in a polyurethane hydrogel forming an emulsion system with vinylterminated polydimethylsiloxane (PDMS). The sensing layer is covered by a hydrophobic porous membrane which excludes hydrophilic substances. Ammonia, diffuses through this barrier and PDMS to the protonated dye, whereby it deprotonates the dye and switches off its emission. Readout is performed with a miniaturized phase fluorimeter combined with optical fibers. Dual-lifetime referencing (DLR) acts as detection method and Egyptian blue as reference material.

1. Introduction

As ammonia is toxic for most animals and humans even in low concentrations, it is an analyte of high interest [1]. Since this compound is often a by-product in bioprocessing, online monitoring is desired. In continuous mammalian cell lines (CCLs), which are important hosts for the production of biological pharmaceuticals [2], ammonia is generated during the cell-metabolism. To gain enough energy in form of adenosine-5′-triphosphate (ATP), CCLs consume high amounts of glutamine to form α-ketoglutarate, which is further degraded in the mitochondria, and ammonia [3]. Accumulation of ammonia yields first to inhibition of cell growth and then to cell death [4]. The required sensor performance in the range of total ammonia concentration (TAC, NH3 + NH4+) from 1 to 100 mmol L−1 is demanded. We present an optical ammonia sensing system based on a BF2-chelated tetraarylazadipyrromethene dye (aza-BODIPY). Our optical sensor system relies on an acid-base concept, whereby ammonia diffuses through a hydrophobic layer to the protonated dye, deprotonates the hydroxyl group of the dye inducing fluorescence quenching. By varying the pKa of the fluorescent dye, we can shift the sensitivity of our system [5]. The aim is continuously monitoring the ammonia concentration besides other key parameters like pH, temperature and oxygen concentration in bioprocessing.

2. Materials and Methods

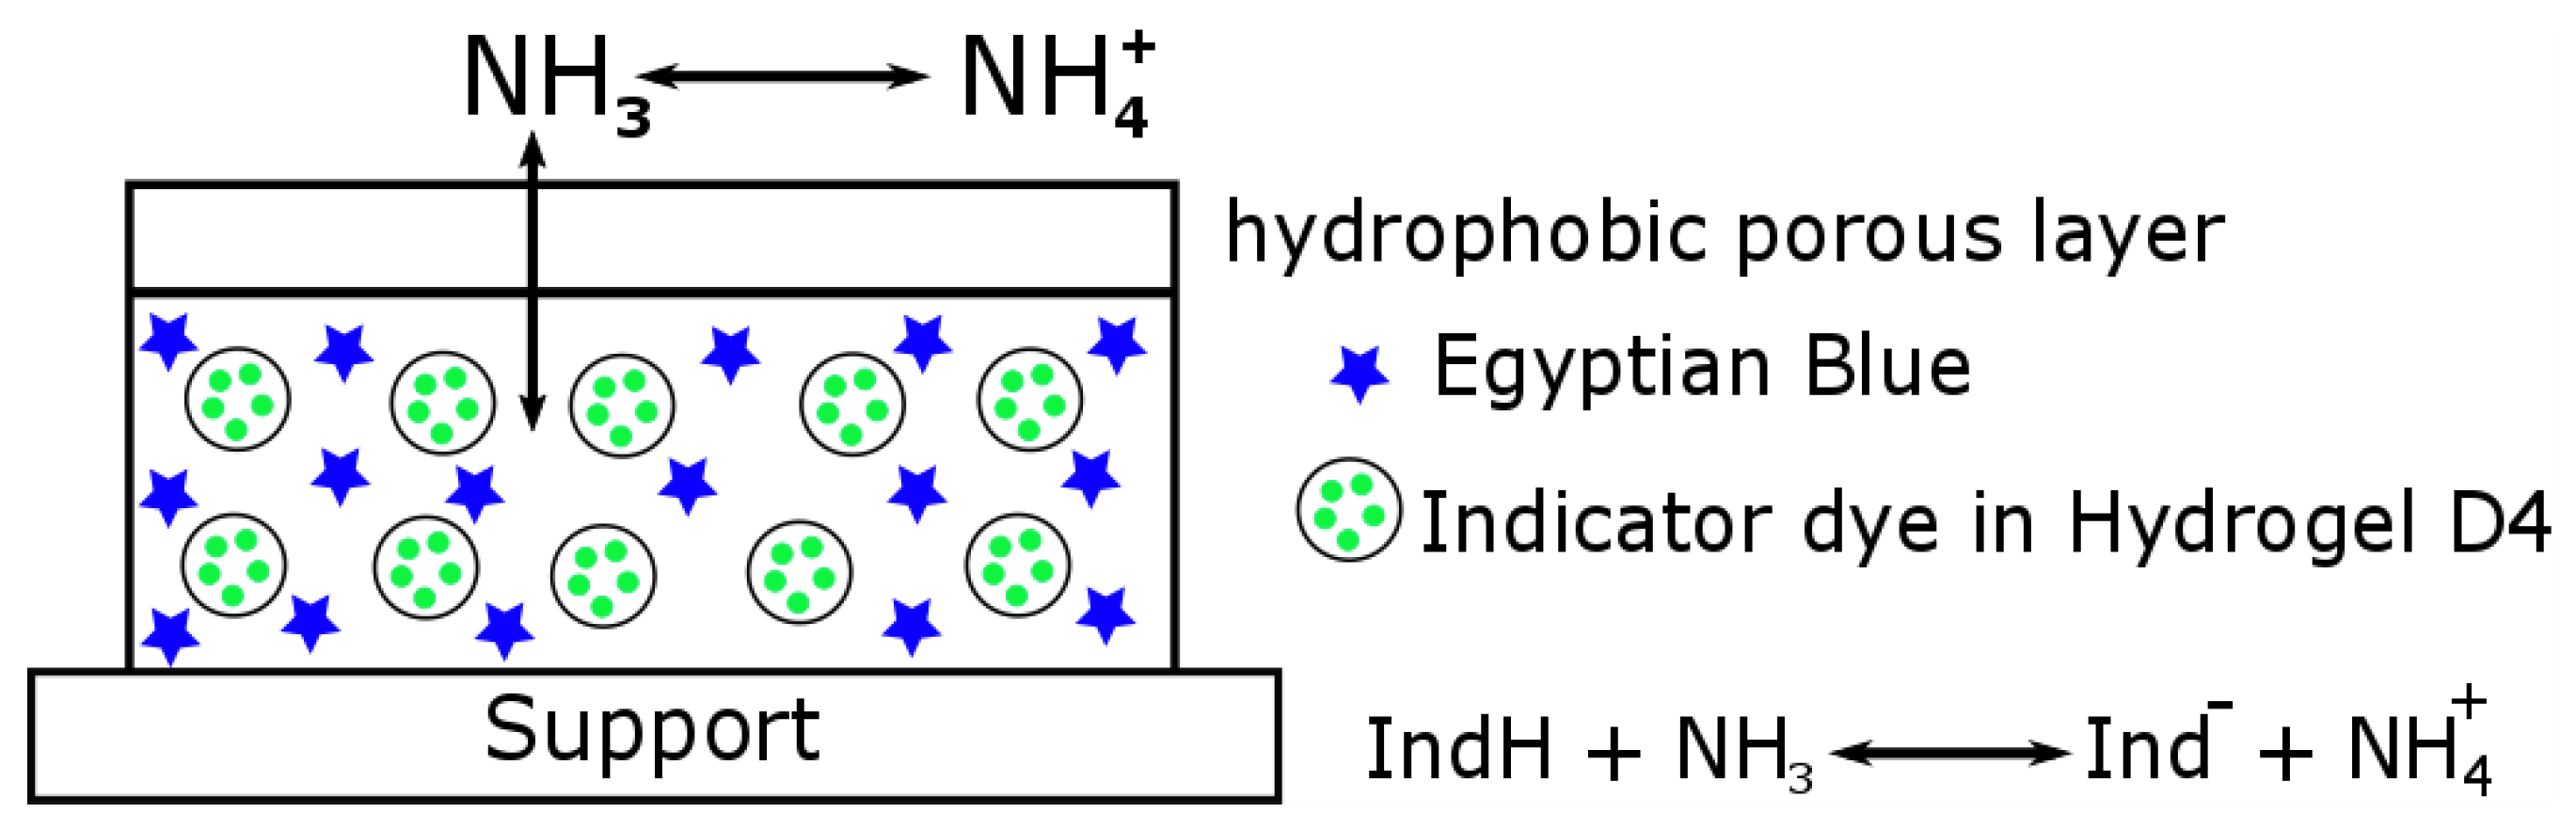
2.1. Sensor Preparation

The fluorescent aza-BODIPY dye is dissolved in Hydrogel D4. This is homogeneously dispersed in vinyl-terminated polydimethylsiloxane (PDMS) and Egyptian Blue as inert reference is added. Then acid is added to the emulsion to protonate the dye. The dye is now in its “on state”. Copolymer, Pt(0)-catalyst and restrainer are mixed to the sensor cocktail which is knife-coated (25 μm wet film) on a dust free PEN support. Finally, a Fluoropore membrane PTFE is laid onto the wet sensor film acting as a hydrophobic porous barrier (Figure 1).

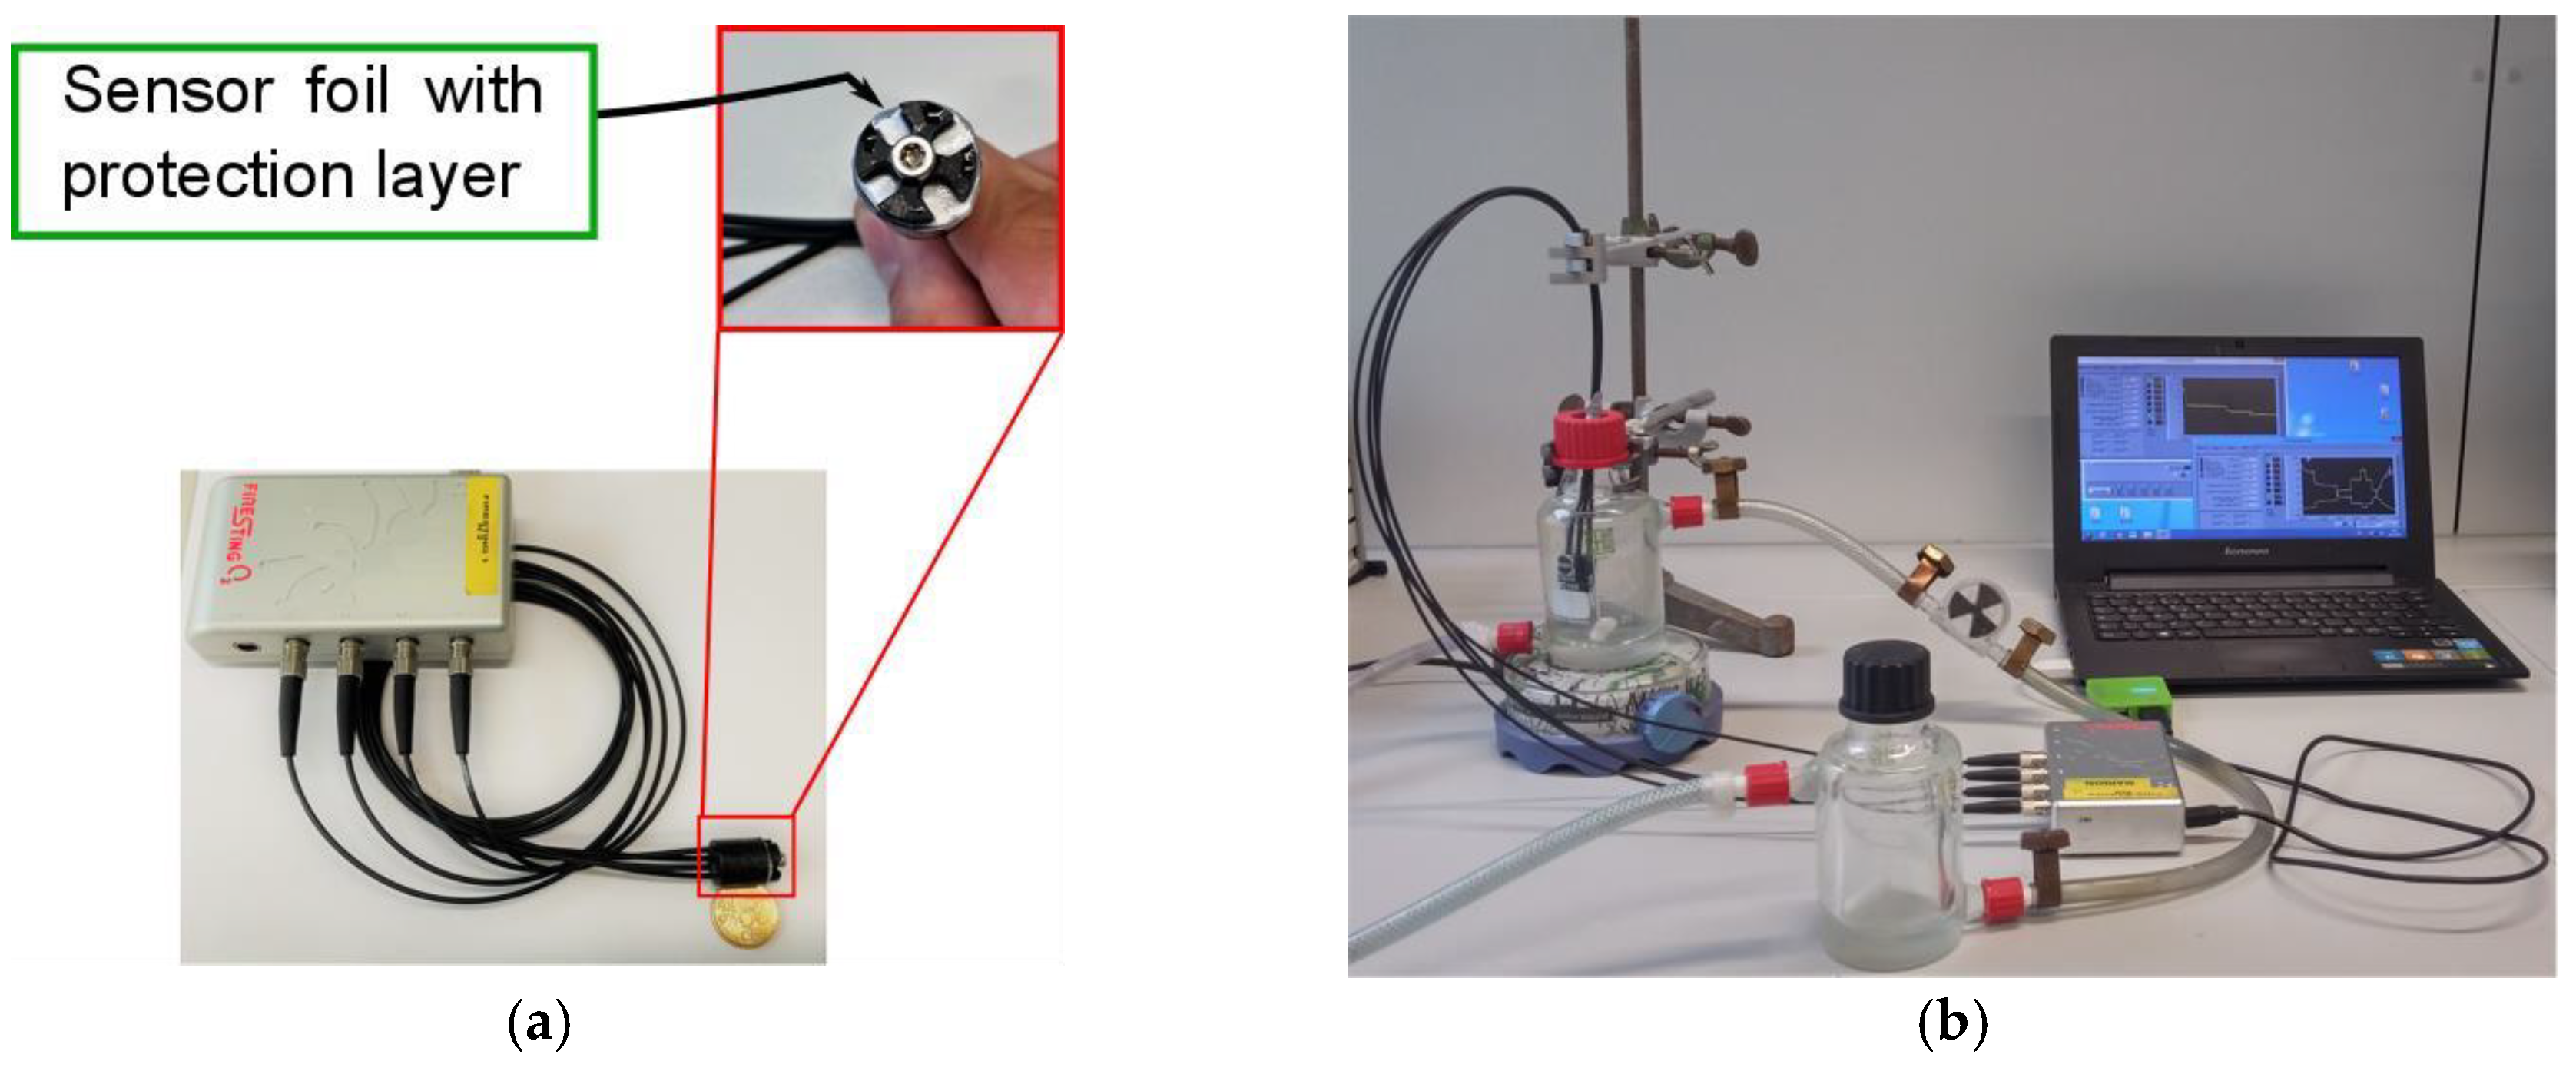
2.2. Measurement Set-Up

Dual-lifetime referenced (DLR)-measurements were performed with the measurement set-up shown below (Figure 2b). The sensor foil was attached to a plastic head which was connected via four optical fibers to a readout device (Figure 2a).

3. Results

All measurements were performed in aqueous buffer solutions (100 mM phosphate buffer prepared at 25 °C, pH = 7.00) with varying concentrations of free ammonia (0.03–100 mg L−1). The free ammonia concentration was calculated by the Henderson-Hasselbalch equation. The temperature dependency of the ammonia-ammonium equilibrium was calculated by the Gibbs free energy.

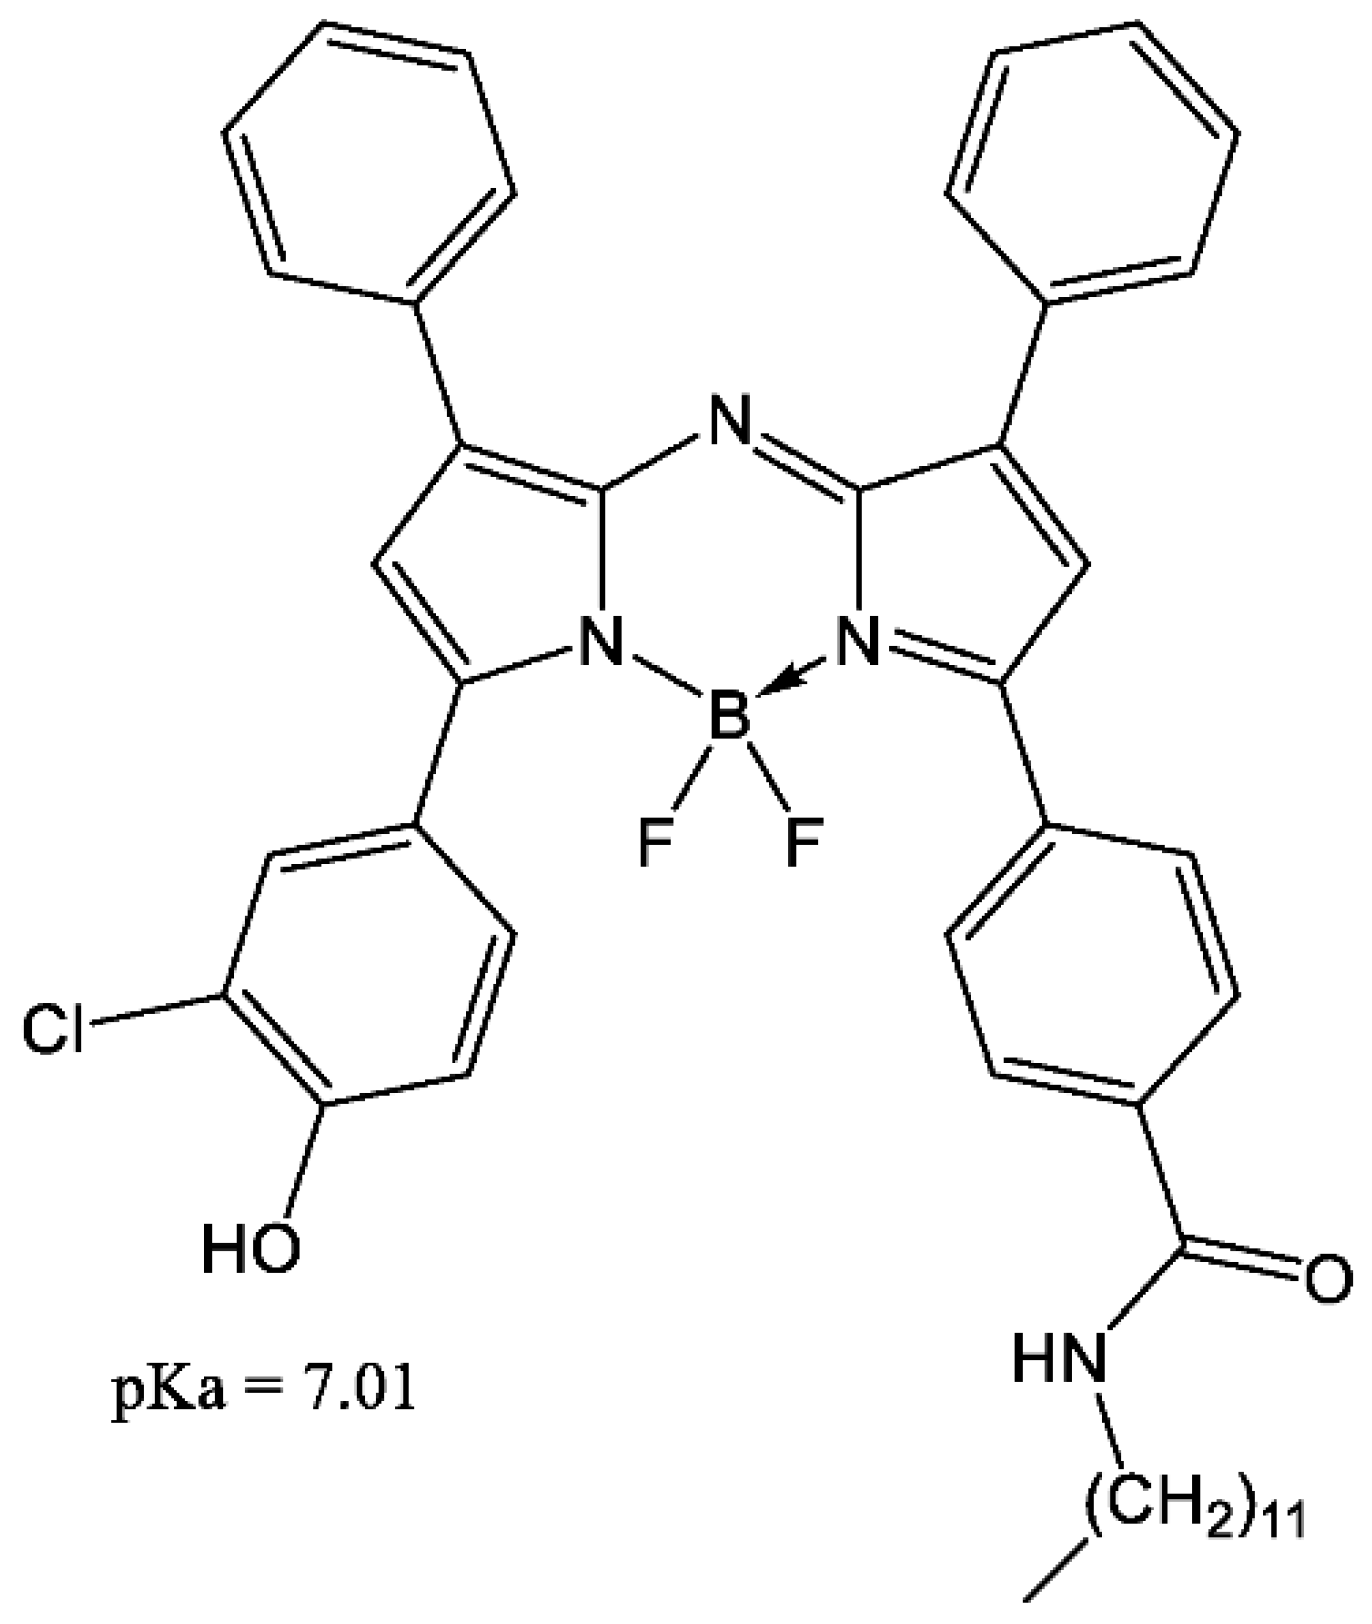
3.1. Choice of the Dye

By using the dye shown below (Figure 3), we achieve the desired dynamic range of the TAC (1–100 mmol L−1, Figure 4b). The hydroxyl group of the dye has a pKa value of 7.01.

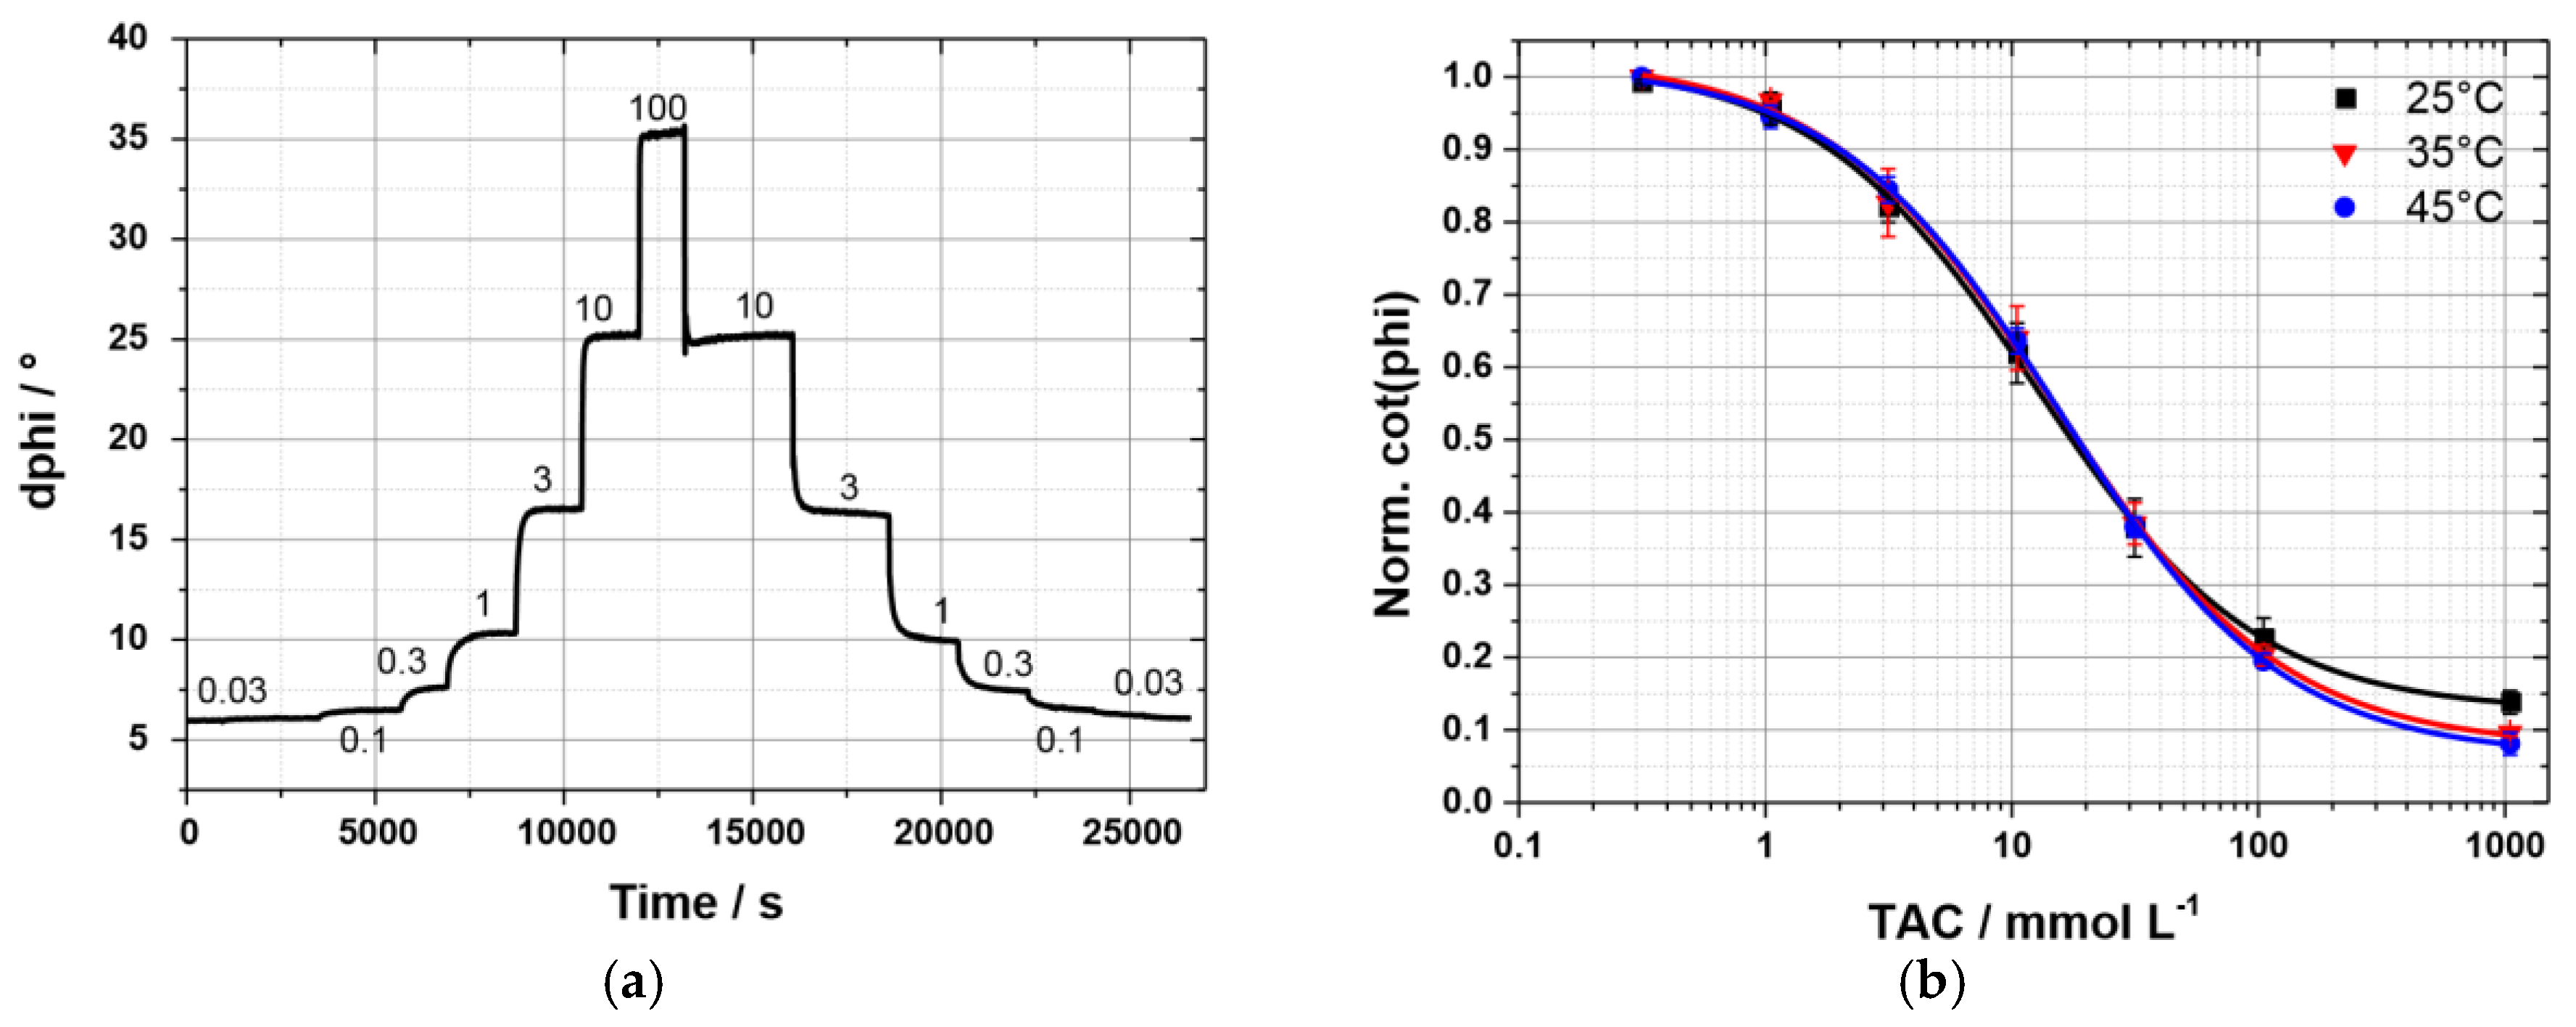
3.2. Sensor Calibation and Response Time

Figure 4a shows the sensor response to different free ammonia concentrations at 25 °C. No significant signal drift is detected. Additionally, the sensor is fully reversible for these concentrations. Response and recovery times, ranging from 0.5–4 min, depending on the ammonia concentration, are significantly decreased to similar systems [6].
For the most biotechnological applications TAC is the parameter of interest. Therefore, calibrations at three temperatures (25, 35 and 45 °C) relevant for biotechnological reactions were monitored. Plotting cot(phi) against the logarithm of TAC yields in a sigmoidal curve (Figure 4b) which is described by a Boltzmann equation. The sensor performance does not suffer drastically from increasing temperature. Only at the highest concentration (1000 mmol L−1 TAC) a significant deviation for 25 °C is visible.

4. Discussion and Conclusions

We present a new ammonia sensor based on a highly photostable aza-BODIPY dye which covers a concentration range for free ammonia from 100 mg L−1 down to 0.03 mg L−1. Therefore, this system is suitable for different applications in biotechnology. The entrapment of the dye containing Hydrogel D4 in form of an emulsion into cross-linked PDMS results in an increased stability of the sensor. The DLR sensor uses Egyptian Blue as inert reference material and is read-out with a phase fluorimeter. Crosstalk experiments with varying pH and other amines are planned. In future, different applications like measurements with Chinese Hamster Ovary cells and as described above mammalian cell cultures as well as monitoring certain biocatalytic reactions are thinkable.

References

  1. Timmer, B.; Olthuis, W.; van den Berg, A. Ammonia sensors and their applications—A review. Sens. Actuators B Chem. 2005, 107, 666–677. [Google Scholar] [CrossRef]
  2. Irani, N.; Wirth, M.; van den Heuvel, J.; Wagner, R. Improvement of the primary metabolism of cell cultures by introducing a new cytoplasmic pyruvate carboxylase reaction. Biotechnol. Bioeng. 1999, 66, 238–246. [Google Scholar] [CrossRef]
  3. Reitzer, L.J.; Wice, B.M.; Kennell, D. Evidence that glutamine, not sugar, is the major energy source for cultured HeLa cells. J. Biol. Chem. 1979, 254, 2669–2676. [Google Scholar] [CrossRef]
  4. Newland, M.; Greenfield, P.F.; Reid, S. Hybridoma growth limitations: The roles of energy metabolism and ammonia production. Cytotechnology 1990, 3, 215–229. [Google Scholar] [CrossRef] [PubMed]
  5. Strobl, M.; Rappitsch, T.; Borisov, S.M.; Mayr, T.; Klimant, I. NIR-emitting aza-BODIPY dyes—New building blocks for broad-range optical pH sensors. Analyst 2015, 140, 7150–7153. [Google Scholar] [CrossRef] [PubMed]
  6. Strobl, M.; Walcher, A.; Mayr, T.; Klimant, I.; Borisov, S.M. Trace Ammonia Sensors Based on Fluorescent Near-Infrared-Emitting aza-BODIPY Dyes. Anal. Chem. 2017, 89, 2859–2865. [Google Scholar] [CrossRef] [PubMed]
Figure 1. Sensor composition; sensing principle based on an acid-base concept.
Proceedings 02 01041 g001
Figure 2. (a) Four optical fibers connecting the sensing layer with a commercially available FirestingO2 reader; (b) measurement set-up components: laptop, compact 4-channel phase fluorimeter, two isolated environments at controlled temperature and a magnetic stirrer.
Proceedings 02 01041 g002
Figure 3. Chemical structure of the fluorescent aza-BODIPY dye.
Proceedings 02 01041 g003
Figure 4. (a) Sensor response at 25 °C at seven different ammonia concentrations in mg L−1; (b) calibration plots of ammonia sensor monitored at three different temperatures for TAC in mmol L−1.
Proceedings 02 01041 g004
Publisher’s Note: MDPI stays neutral with regard to jurisdictional claims in published maps and institutional affiliations.

