Proceeding Paper

Investigating Intense Rainfall Influence on Distance Measurement with a Time-of-Flight Camera Sensor Using Optical Ray-Tracing Simulation Technique †

1
Photonic Systems, CTR Carinthian Tech Research AG, 9524 Villach, Austria
2
Development Center Graz, Infineon Technologies Austria AG, 8020 Graz, Austria
*
Author to whom correspondence should be addressed.
Presented at the Eurosensors 2018 Conference, Graz, Austria, 9–12 September 2018.
Proceedings 2018, 2(13), 1056; https://doi.org/10.3390/proceedings2131056
Published: 20 November 2018
(This article belongs to the Proceedings of EUROSENSORS 2018)

Abstract

:
Robust, fast and reliable examination of the surroundings is essential for further advancements in autonomous driving and robotics. Time-of-Flight (ToF) camera sensors are a key technology to measure surrounding objects and their distances on a pixel basis in real-time. Environmental effects, like rain in front of the sensor, can influence the distance accuracy of the sensor. Here we use an optical ray-tracing based procedure to examine the rain effect on the ToF image. Simulation results are presented for experimental rain droplet distributions, characteristic of intense rainfall at rates of 25 mm/h and 100 mm/h. The ray-tracing based simulation data and results serve as an input for developing and testing rain signal suppression strategies.

1. Introduction

Assisted and autonomous driving vehicles are currently under heavy development. Robust, fast and reliable examination of the surroundings is essential for safe operation of such vehicles even in complex situations. Time-of-Flight (ToF) camera sensors (Figure 1) are among the technologies that can deliver this information. Small atmospheric particles, like rain, fog or haze, can significantly decrease the measurement accuracy for many distance measurement principles. In real-world situations, camera-based ToF measurement errors arise from many different sources and the contribution of a single effect on the overall inaccuracy might be difficult to determine. Optical simulations allow quantitative examination of single effects and can overcome the aforementioned limitations. In this publication, we investigate how intense rainfall influences distance measurements and their accuracy on Time-of-Flight (ToF) camera sensors using ray-tracing methods.

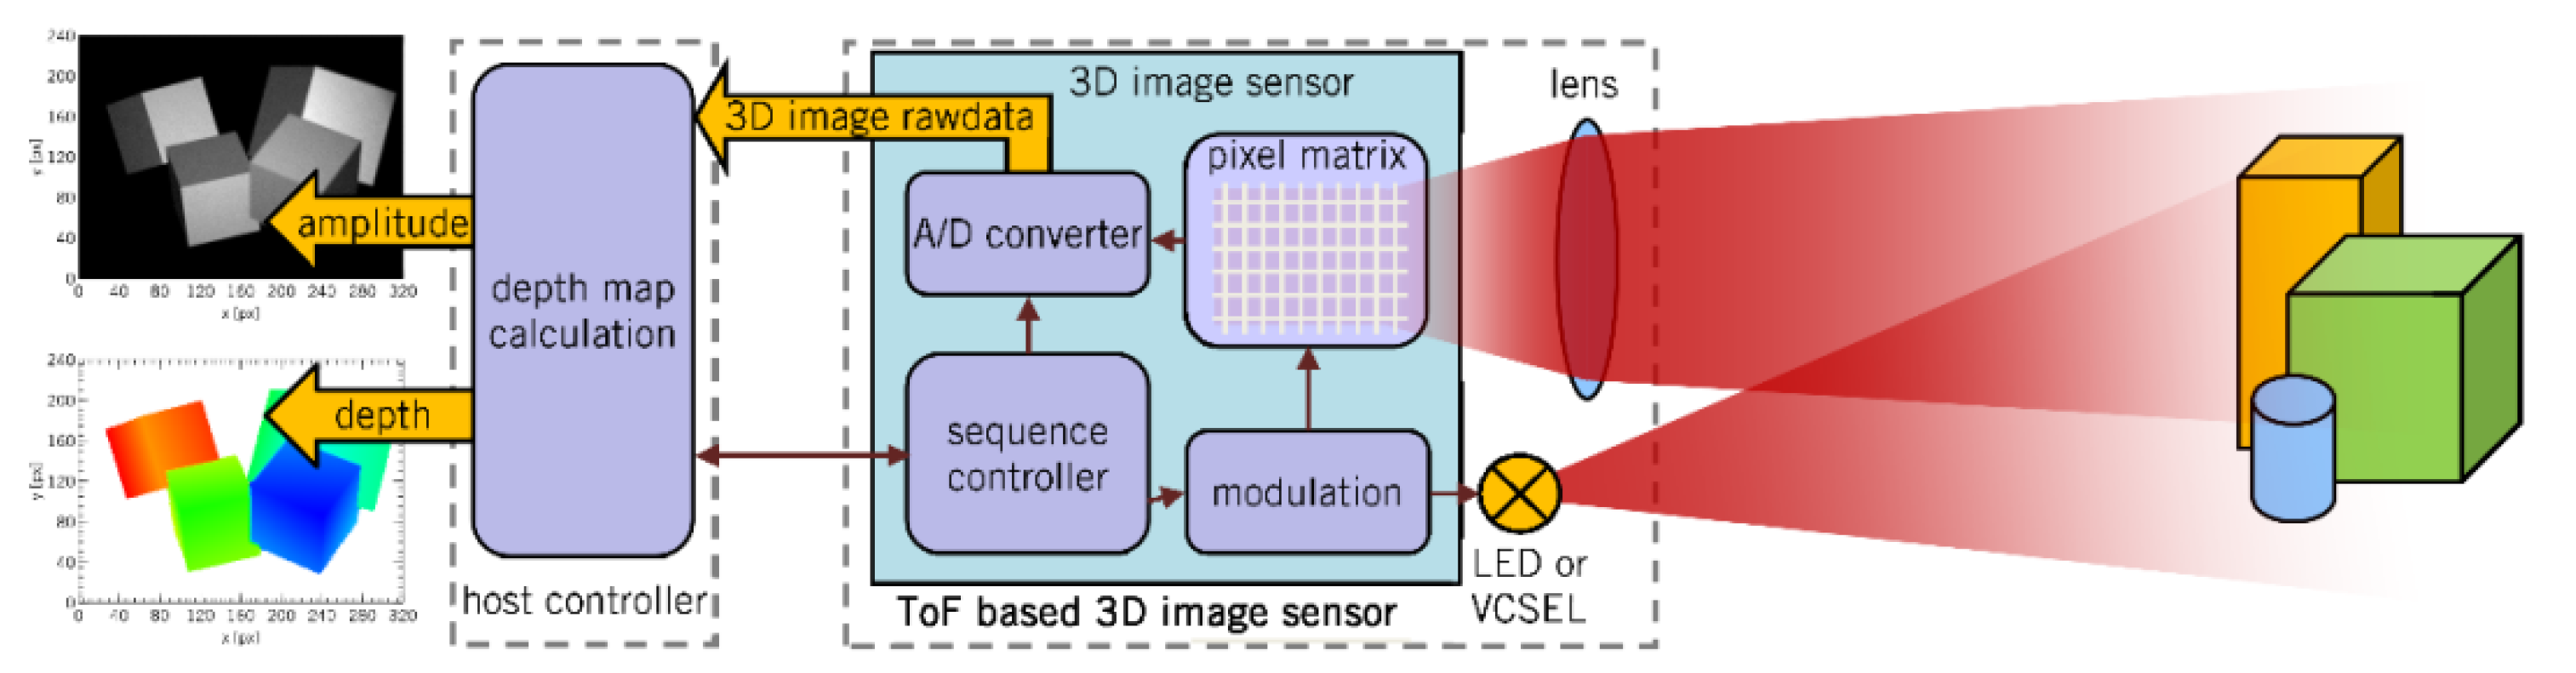
2. Simulation Method and Considered Effects

Optical ray-tracing with Monte-Carlo methods based ray generation is used to obtain the ToF sensor’s intensity and depth signals. Ray-tracing is performed with the commercial software Zemax OpticStudio©. The model comprises the ToF sensor, including the source, the detector and the receiving optics, the scenery, composed by several cubes with scattering surfaces, and the rain droplets, modeled as water spheres (Figure 2). Upon raytracing, the intensity and travelled distance associated with each ray reaching the detector is stored for further analysis. The optical path length of each ray can be used to reconstruct the measured depth for different sensor implementations or readout schemes (e.g., Direct-ToF and Correlation-ToF). This simulation approach—out of the box—supports multiple and extended light sources and allows accounting for all effects within the geometrical optics model. Especially global illumination (e.g., multi-object reflection/scattering ray-paths, translucent objects) and aberration effects (e.g., distortion caused by the ToF sensor’s lens) are supported. Further details about the simulation procedure can be found in [2]. In the following, the Direct-ToF implementation is used to reconstruct the depth signals.

3. Results

Figure 3a–c show the intensity and depth signals of the scenery presented in Figure 2 in absence of rain. Figure 3d–i show the influence of droplet distributions at 25 mm/h and 100 mm/h rates (intense rainfall model) on the ToF sensor accuracy. Different from our previous work, where rain was modeled as a collection of water spheres homogeneous in size [3], here the droplet distributions (number and size distribution per unit volume) are modeled according to a modified Gamma distribution [4]. The rainfall rate dependent input parameters were taken from the intense rainfall model given in [5]. A rainfall rate of 24 mm/h applies to 0.5% of the rainiest month in the Northern Hemisphere tropics according to [5]. The depth accuracy of the ToF sensor is affected mostly by back-reflection of the rays from the rain droplets (Figure 3d–g). Therefore, the depth estimation results mainly in too short object distances. The 100 mm/h rate shows a larger distance error, since it roughly contains twice the number of droplets of the 25 mm/h rate. Additionally, the influence of a raindrop increases with smaller distance towards the ToF sensor.
The two histograms in Figure 3h,i give a more detailed analysis of the distance error distribution. The non-cumulative plot (Figure 3h) shows the distribution of the relative distance errors, which shows a pronounced asymmetry towards shorter distances. The positive error component amounts to 0.13% at a rainfall rate of 25 mm/h and 0.14% at a rate of 100 mm/h. Figure 3i shows the cumulative error distribution, obtained by summing up all errors from a depth difference of −30% to 0. The analysis shows that 22% of all pixels are affected by a distance error larger than 1% at the 25 mm/h rain rate, whereas this value increases to 28% of all pixels at the 100 mm/h rain rate.

4. Discussion and Conclusions

The ranging errors on ToF camera signals caused by rain are due to different ray paths which end at the same sensor pixel. There are two main interaction ray paths for rain droplets influencing the distance measurement. The first includes direct reflection or scattering from the rain droplets without further interaction with other objects. As the rain droplets are typically in front of the surrounding objects, this ray path will generate too short distance information. The second contribution arises from rays that interact with the rain after a first interaction with the scene, and are either reflected or scattered back towards the scene. This results in a too long distance estimation of the scenery. The simulation results clearly show that the first effect outweighs the second.
The comparison of the two rainfall rates shows that intense rainfall significantly lowers the accuracy of the ToF camera’s scene depth estimation. The higher examined rainfall rate shows a stronger impact on the distance reconstruction. This dependence is expected, as the higher rainfall rate comprises a larger number of droplets with larger diameters per volume unit, resulting in a larger cross-section for light-droplet interaction.
Each cube in the test scene has surfaces forming different angles with the optical axis of the ToF sensor. The Gaussian scattering model implemented on all these surfaces enables the investigation of directional influences. Surfaces with a large angle between optical axis and surface normal vector appear less bright. Hence, the relative contribution from rays interacting with rain droplets is higher for these surfaces as compared to surfaces with a high scattering coefficient towards the ToF sensor, and the rain perturbation is larger. This can be notably seen on cube edges in Figure 3d,f.
The rainfall analysis presented here serves as useful input for developing rain-perturbation suppression strategies.

Author Contributions

All authors contributed evenly to the content of this publication; M.B. wrote the paper.

Acknowledgments

This project has received funding from the Electronic Component Systems for European Leadership Joint Undertaking under grant agreement No. 692480. This Joint Undertaking receives support from the European Union’s Horizon 2020 research and innovation programme and Germany, Saxony, Spain, Austria, Belgium, Slovakia. Austrian co-funding comes from the Federal Ministries of Transport, Innovation and Technology (BMVIT) and Digital and Economic Affairs (BMDW), managed on their behalf by the Austrian Research Promotion Agency (FFG).

Conflicts of Interest

The authors declare no conflict of interest. The founding sponsors had no role in the design of the study; in the collection, analyses, or interpretation of data; in the writing of the manuscript, and in the decision to publish the results.

References

  1. Druml, N.; Fleischmann, G.; Heidenreich, C.; Leitner, A.; Martin, H.; Herndl, T.; Holweg, G. Time-of-flight 3D imaging for mixed-critical systems. In Proceedings of the IEEE 13th International Conference on Industrial Informatics (INDIN), Cambridge, UK, 22–24 July 2015; pp. 1432–1437. [Google Scholar] [CrossRef]
  2. Baumgart, M.; Druml, N.; Consani, C. Procedure Enabling Simulation and In-depth Analysis of Optical Effects in Camera-based Time-of-Flight Sensors. Int. Arch. Photogramm. Remote Sens. Spat. Inf. Sci. 2018, 42, 83–89. [Google Scholar] [CrossRef]
  3. Baumgart, M.; Dielacher, M.; Druml, N.; Consani, C. Simulating Rain Droplets Influence on Distance Measurement with a Time-of-Flight Camera Sensor. Proceedings 2017, 1, 287. [Google Scholar] [CrossRef]
  4. Deirmendjian, D. Form and Properties of the Distribution Function. In Electromagnetic Scattering on Spherical Polydispersions; RAND Corporation: Santa Monica, CA, USA, 1969; pp. 75–83. Available online: https://www.rand.org/content/dam/rand/pubs/reports/2006/R456.pdf (accessed on 20 November 2018).
  5. Willis, P.T.; Tattelman, P. Drop-size distributions associated with intense rainfall. J. Appl. Meteorol. 1989, 28, 3–15. [Google Scholar] [CrossRef]
Figure 1. Measurement principle of a camera-based ToF sensor using the phase measurement technique (REAL3TM 3D Image Sensor scheme based on description given in [1]).
Proceedings 02 01056 g001
Figure 2. (a) Complete 3D scenery with ToF camera, test scene and rain volume; (b) Enlarged view of the optically relevant ToF camera components comprising light source, receiver optics and detector array.
Proceedings 02 01056 g002
Figure 3. Intense rainfall influence on ToF sensor’s intensity and depth signal; (ac) Calculated intensity and depth from the optical path length for the test scene without rain for a Direct-ToF sensor implementation; (d,e) Rain influence @ 25 mm/h: (d) Distance difference between 25 mm/h rain rate and no rain for test scene; (e) 3D plot of calculated intensity and distance (a pixel intensity of less than 0.24‰ of the maximum pixel intensity equals zero intensity, which corresponds to the resolution of a 12 bit ADC converter); (f,g) Rain influence @ 100 mm/h: (f) Distance difference between 100 mm/h rain rate and no rain for test scene; (g) 3D plot of calculated intensity and distance (12 bit digital filtered); (h,i) Depth accuracy error due to presence of rain at rates of 25 mm/h and 100 mm/h; (h) Non-cumulative histogram showing the error per depth difference (errors < −30% not ploMed); (i) Cumulative (from neg. to pos.) histogram showing the cumulated error up to a certain depth difference.
Proceedings 02 01056 g003
Publisher’s Note: MDPI stays neutral with regard to jurisdictional claims in published maps and institutional affiliations.

