Abstract
This study proposes a new preprocessing technique that combines Chebyshev filtering with baseline correction technique Asymmetric Least Squares (ALS) and Savitzky-Golay transformation (SGT) to improve the prediction of Glucose from near Infrared (NIR) spectra through linear regression models Partial Least Squares (PLS) and Principal Component Regression (PCR). To investigate the performance of the proposed technique, a calibration model was first developed and then validated through prediction of Glucose from NIR spectra of a mixture of glucose, urea, and triacetin in a phosphate buffer solution where the component concentrations are within their physiological range in blood. Results indicate that the proposed technique improves the performance of both PLS and PCR and achieves standard error of prediction (SEP) as low as 12.76 mg/dL which is in the clinically acceptable level and comparable to the existing literature.
1. Introduction
Diabetes mellitus is a chronic disease that is associated with the abnormal metabolism of glucose. Regular monitoring of blood glucose level is necessary for those suffering from Diabetes. Conventionally, this monitoring is done by drawing blood several times per day and administer insulin manually. Existing methods involve collecting blood sample by breaking skin which is often painful and uncomfortable for patients. Researchers had been trying to find a noninvasive way of glucose level measurement to overcome this problem. The challenge here is to gain the measurement accuracy as no physical separation or use of chemical reagent is possible in noninvasive techniques.
NIR spectroscopy has been identified as the most popular technique among many others for noninvasive glucose monitoring [1,2,3,4]. It has a comparatively high signal to noise ratio and ensures less inference on water absorption. For isolating glucose from blood spectrum, multivariate calibration techniques are used. Spectra that is collected by the NIR instrument can contain unwanted frequency component or noise. Filtering method can remove those noises superimposed on high frequency signals [2,3,4,5]. Some of the studies used filtering technique coupled with PLS, while other applied different data correction techniques as a preprocessing step of PLS [1,2,3,4,5,6]. Methods like Scatter correction and spectral derivatives often help greatly to reduce the variability and baseline shifts in the samples [7].
2. Preparation of the Data
For simulation, a dataset of 87 NIR spectra was used. These spectra were collected with Fourier Transform spectrometer (FTIR cary 5000 version 1.09) for 30 mixtures prepared by dissolving glucose, urea, and triacetin in a phosphate buffer solution. The components concentrations were selected to span their physiological range in blood. The spectral region was from 2100 nm to 2400 nm. Details of these data were explained in the previous work [8].
3. Methodology
3.1. Preprocessing
Spectra can contain unwanted frequency component or noise which may reduce the accuracy of glucose prediction. To correct the spectra, different data correction techniques such as ALS, SGT, SNV, MSC were applied. SNV is a frequently used pre-treatment method which is used in NIR to remove the scatter and correct spectral baseline. With this approach, every data point of spectra is subtracted from mean and divided by the standard deviation [9]. MSC, on the other hand, is done by regressing a measured spectrum using a reference spectrum. This pretreatment method is effective in minimizing baseline offsets and multiplicative effect [9]. ALS method is another baseline correction method which is used to combine a smoother with an asymmetric weighting of deviations to get an effective baseline estimator. It keeps the analytical peak signal intact [9]. SGT is a spectral derivative technique which is popular for the numerical derivation of a vector. Both additive and multiplicative effects in the spectra can be removed by this derivative technique [7]. As for filtering purpose, Chebyshev filtering was chosen.
3.2. Regression
Regression analysis is a paramount system for statistics used to create a relationship between diverse variables. Here, two different multivariate regression analysis, PLS, and PCR were applied on the preprocessed spectra. PLS is a method of modeling relations between sets of observed variables by means of latent variables [9]. It comprises of regression and classification tasks as well as dimension reduction techniques. PCR, on the other hand, is a regression analysis technique based on the principal component analysis (PCA). In PCR, the input spectra or absorbance are decomposed into scores and loadings. Here, PCA is used to reduce the dimension before the concentration is used in regression [9].
4. Results and Discussion
4.1. Data Correction and Filtering
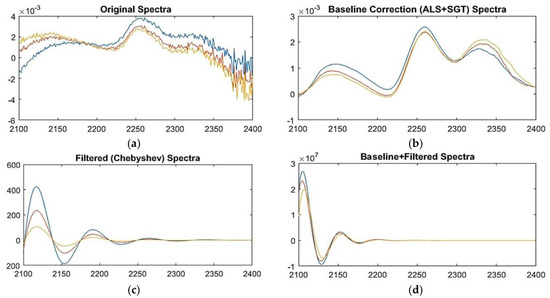
For removing issues such baseline variation from the spectra, four different data correction methods were applied on spectra before feeding them to PLS and PCR. MATLAB based Multivariate Data Analysis Tootbox has been used for this purpose. Among them ALS and SGT individually improved the standard error of prediction (SEP) significantly. ALS was tuned by changing the smoothness from 1000 to 100,000,000 and the penalty from 0.01 to 0.1 with an interval of 0.005. SGT was applied to three different polynomial order 1st, 2nd, and 3rd. Figure 1a shows three of the raw spectra that are very noisy, scattered and also have baseline issues. After observing the variability in the original spectra and the effectiveness of ALS and SGT, the raw spectra were first corrected through ALS and then through 2nd order SGT. This significantly corrected the variability present among the spectra (Figure 1b) collected from the mixtures having same level of glucose concentration.

Figure 1.
(a) Three raw near-infrared spectra of glucose with same concentration (b) after baseline (ALS + SGT) correction (c) after filtered through Chebyshev (d) after baseline correction and filtered.
4.2. Regression on the preprocessed data
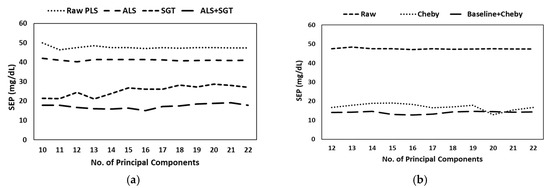
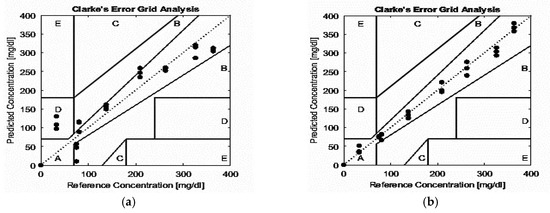
Chebyshev filtering was next applied on the ALS and SGT corrected spectra for removing unwanted high-frequency noises from the spectra and to improve the prediction accuracy. The optimum filter was identified to be the 3rd order Chebyshev filter with ripple = 0.7, center = 0.025, width = 0.03575. Figure 1c,d show the spectra corrected through Chebyshev filtering alone and through combine ALS + SGT + Chebyshev approach. It can easily be noticed that spectra could be well aligned with the combined approach than the Chebyshev filtering alone that are commonly followed in some literature [7]. This combined approach also reduced the overall SEP of glucose prediction to as low as 12.76 mg/dL when the analysis was done through PLS. Figure 2a shows the SEP vs. No. of Latent Variables for PLS regression applied on the spectra preprocessed through different data correction techniques. Figure 2b shows the prediction error received for PLS regression applied on the raw spectra only, the spectra processed through filtering (Chebyshev), and the spectra processed through data correction(ALS+SGT) and then filtering (Chebyshev). Figure 3 shows that the predicted glucose concentration has been plotted in Clarke’s error grid where all the predicted concentrations are placed in the A region which is clinically accepted zone.

Figure 2.
No. of latent variables vs standard error prediction for PLS Regression applied on (a) the spectra processed through different data correction methods (b) Raw spectra, Chebyshev filter spectra and baseline corrected + Chebyshev filtered spectra.

Figure 3.
Clarke’s error grid for the predicted concentration and reference concentration with (a) raw spectra (b) baseline corrected + Chebyshev filtered spectra analyzed through PLS.
4.3. Comparison of PLS vs. PCR
To further confirm of how well the preprocessed techniques and PLS worked in the predictions of glucose level, PCR regression was also done on the preprocessed spectra. All the results achieved through PLS and PCR coupled with different preprocessing techniques have been provided in Table 1 for comparison. It is clearly noticeable that PLS worked better in predicting glucose concentration for every preprocessing methods applied. Another key observation was that the Chebyshev filtering method applied on baseline corrected (ALS + SGT) spectra worked well for both PLS and PCR. Overall, the lowest SEP achieved to be 12.76 mg/dL.

Table 1.
Comparison of PLS and PCR for raw and different preprocessed spectra.
References
- Burmeister, J.J.; Arnold, M.A.; Small, G.W. Noninvasive blood glucose measurements by nearinfrared transmission spectroscopy across human tongues. Diabetes Technol. Ther. 2000, 2, 5–16. [Google Scholar] [CrossRef] [PubMed]
- Small, G.W.; Arnold, M.A.; Marquardt, L.A. Strategies for coupling digital filtering with partial leastsquares regression: Application to the determination of glucose in plasma by Fourier-transform nearinfrared spectroscopy. J. Anal. Chem. 1993, 65, 3279–3289. [Google Scholar] [CrossRef] [PubMed]
- Arnold, M.A.; Small, G.W. Determination of physiological levels of glucose in an aqueous matrix with digitally filtered Fourier transform near-infrared spectra. Anal. Chem. 1990, 62, 1457–1464. [Google Scholar] [CrossRef] [PubMed]
- Chalmers, J.M.; Everall, N.J.; Hewitson, K.; Chesters, M.A.; Pearson, M.; Grady, A.; Ruzicka, B. Fourier transform infrared microscopy: Some advances in techniques for characterization and structure-property elucidations of industrial material. Analyst 1998, 123, 579–586. [Google Scholar] [CrossRef]
- Cingo, N.A.; Small, G.W.; Arnold, M.A. Determination of glucose in a synthetic biological matrix with decimated time-domain filtered near-infrared interferogram data. Vib. Spectrosc. 2000, 23, 103–117. [Google Scholar] [CrossRef]
- Rahaman, T. Strategies for Coupling Filtering with Principal Component Regression Analysis for Determination of Glucose Concentration. Unpublished. Master’s Thesis, University of Sheffield, Sheffield, UK, 2009. [Google Scholar]
- Rinnan, Å.; van den Berg, F.; Engelsen, S.B. Review of the most common pre-processing techniques for near-infrared spectra. TrAC Trends Anal. Chem. 2009, 28, 1201–1222. [Google Scholar] [CrossRef]
- Al-Mbaideen, A.; Rahman, T.; Benaissa, M. Determination of glucose concentration from near-infrared spectra using principle component regression coupled with digital bandpass filter. In Proceedings of the 2010 IEEE Workshop on Signal Processing Systems (SiPS 2010), San Francisco, CA, USA, 6–8 October 2010; pp. 243–248. [Google Scholar]
- Eilers, P.H.C.; Boelens, H.F.M. Baseline Correction with Asymmetric Least Squares Smoothing. Life Sci. 2005, 1, 5. [Google Scholar]
Publisher’s Note: MDPI stays neutral with regard to jurisdictional claims in published maps and institutional affiliations. |
© 2018 by the authors. Licensee MDPI, Basel, Switzerland. This article is an open access article distributed under the terms and conditions of the Creative Commons Attribution (CC BY) license (https://creativecommons.org/licenses/by/4.0/).