1. Introduction
There is a growing interest on achieving a better understanding on the interactions between land use and climate and their effect on water resources and people’s livelihoods, with the aim of improving long-term sustainable water use [
1]. This is even more relevant in areas such as Mediterranean region, which is a major climate change hotspot due to water scarcity, concentration of activities, and reliance on climate-sensitive resources [
2].
Traditionally, water managers and decision makers have focused on just one part of the continental water cycle, i.e., on how existing surface and groundwater bodies could be managed, e.g., by designing and optimizing storage and supply infrastructure. The full land-water cycle, however, can be explicitly considered in water resources planning and management, constituting the base of the Integrated Water Resources Management (IWRM) paradigm [
3].
Hydrological models are fundamental to forecast and predict the quantity and quality of water for decision makers [
4,
5] setting the base for proper IWRM once social, economic, legal, and environmental aspects are considered [
6].
The long-term data sets provided by experimental watersheds are key factors that significantly foster the validation of hydrological models, especially in headwater mountain watersheds that despite their importance in providing freshwater resources to lowland areas, are complex hydrological systems needing investigation [
7,
8].
In this paper we present a comparison of infiltration equations to compute infiltration and runoff in the Bonis river basin, a small forested watershed in south Italy. The basin is a case study of the INNOMED project (Innovative Options for Integrated Water Resources Management in the Mediterranean) funded by ERA-NET COFUND WATERWORKS 2015 call.
2. Materials and Methods
2.1. The Bonis Experimental River Basin
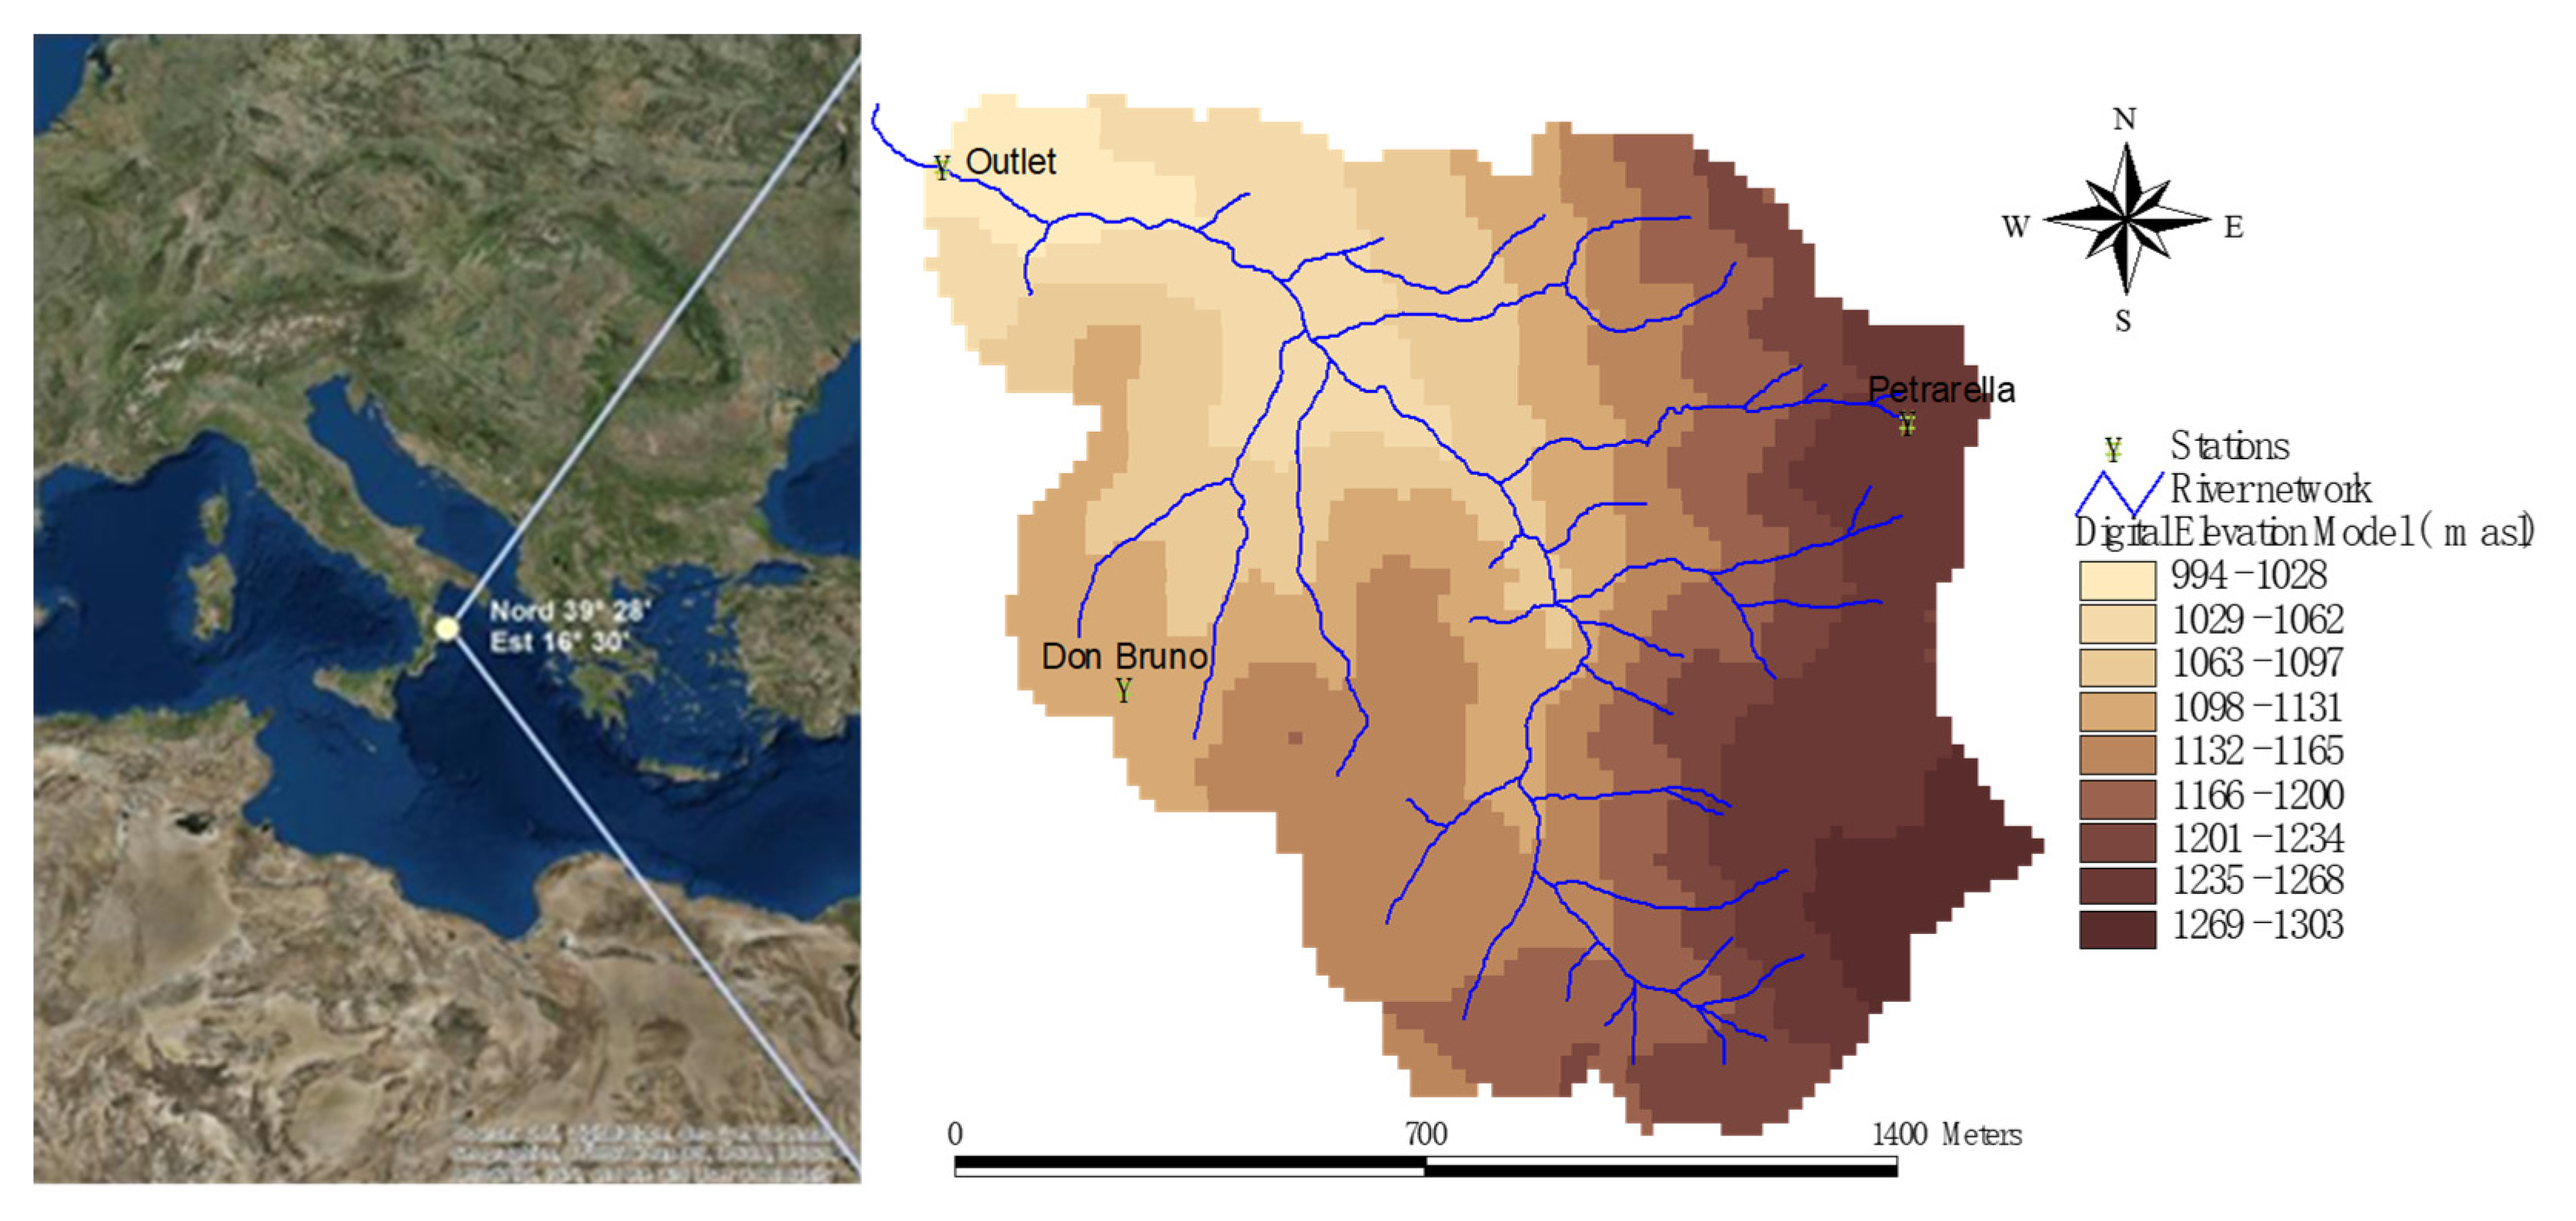
The Bonis watershed is a 1.39 km
2 experimental watershed located in the mountain area of Sila Greca in The Calabria region (southern Italy). Almost 93% of the total area is covered with forest [
9]. This study site has been instrumented and monitored since 1986. Meteorological data were collected from three meteorological stations (
Figure 1) in the study site located at the basin outlet (Outlet: 975 m a.s.l), at northeastern (Petrarella: 1258 m a.s.l) and at southwestern (Don Bruno: 1157 m a.s.l). The average recorded annual precipitation was 915 mm, the mean temperature of the coldest month was about 0.1 °C and of the hottest month was 18.3 °C. The runoff is measured at the outlet of the watershed using a gauging structure.
Soil in the study site is a sandy loam. Soil hydraulic properties used for simulations were estimated taken from [
10]. We used data collected for the period 1997–1998 to carry out hydrological model simulations within which four events were selected for model calibration and performance evaluation. The calibration of the model was carried out manually by initially implementing soil parameters reported in
Table 1. To evaluate simulations against measurements relative error was calculated.
2.2. The Hydrological Model FEST
We simulate the hydrological response of the Bonis river basin by using the FEST model [
11,
12,
13,
14,
15]. FEST is physically-based and accounts for evapotranspiration, infiltration, surface runoff, subsurface flow, flow routing and snow melt and accumulation. The computational domain is discretized with a regular-squared mesh. The hydrological model computes soil moisture fluxes by solving the water balance equation at each grid-point. In particular, the evolution of the soil moisture,
, for the generic point at (
i,
j) is:
where
P is the precipitation rate,
R is the runoff flux,
D is the drainage flux,
ET is the evapotranspiration rate and
Z is the soil depth. Infiltration is computed with two alternative methods: a modified Soil Conservation Service-Curve Number method extended for continuous simulation [
16] or the Green-Ampt equation [
17]. The SCS-curve number is one of widely implemented models for the calculation of surface runoff. The SCS-CN approach has been subjected to several modifications in order to adopted for various land uses and climatic conditions. A modified version of SCS-CN method was implemented within FEST model that takes into account rainfall rate at each time step (for this study at an hourly time step) instead of its cumulative value.
Green and Ampt method is also commonly used within hydrological models. This equation simplifies the infiltration process as a piston like movement of a sharp wetting front. Several modifications have been suggested in order to adapt Green and Ampt model to address situations beyond the assumptions of its development.
The actual evapotranspiration (
ET) is calculated as a fraction of the potential rate tuned by the beta function that, in turn, depends on soil moisture content. Potential evapotranspiration is computed according to a modified version of the Hargreaves- Samani equation [
18]. The surface and subsurface flow routing is based on the Muskingum-Cunge method in its non-linear form with the time variable celerity [
19].
2.3. Sensitivity Analysis
Model outputs depend not only on the model structure but also on the input parameters. The sensitivity analysis measures the effect of changes of input parameters on the model outputs. This step allows to detect the importance of each input parameter on the model outputs that should be taken into consideration during the calibration and validation [
20]. For this study we carried out sensitivity analysis of the soil related parameters for the two infiltration models. The procedure was carried out by varying a given parameter individually by a given percentage. For this study we fixed a Δ
x of 20% regardless the potential range of variation of the tested parameters. The sensitivity of model outputs to the changes of the input parameters is expressed by a dimensionless sensitivity index. The base value is changed by
with
and
. The model output resulting from the implementation of these values are
y1 and
y2. The sensitivity index is computed as follows
This index should be normalized to be dimensionless:
If this index is positive that means that the increase of the input parameter yields an increase of the model input while its negative that reflects that the increase of this input yields a decrease of the output. The sensitivity of the model output to each tested input parameter was ranked according to [
21] (
Table 2).
3. Results and Discussions
3.1. Sensitivity Index
Results of sensitivity analysis on infiltration simulated with Curve Number and Green-Ampt equations are reported in
Table 3. They show that the Curve Number equation is very sensitive to Curve Number parameter, followed by saturated hydraulic conductivity, and less to saturated water content, field capacity and poresize distribution index, and it is no sensitive to residual water content and wilting point. Green-Ampt denotes high sensitivity to saturated hydraulic conductivity and saturated water content, medium sensitivity to field capacity and pore size distribution index, and negligible sensitivity to residual water content and wilting point.
3.2. Hydrological Simulation
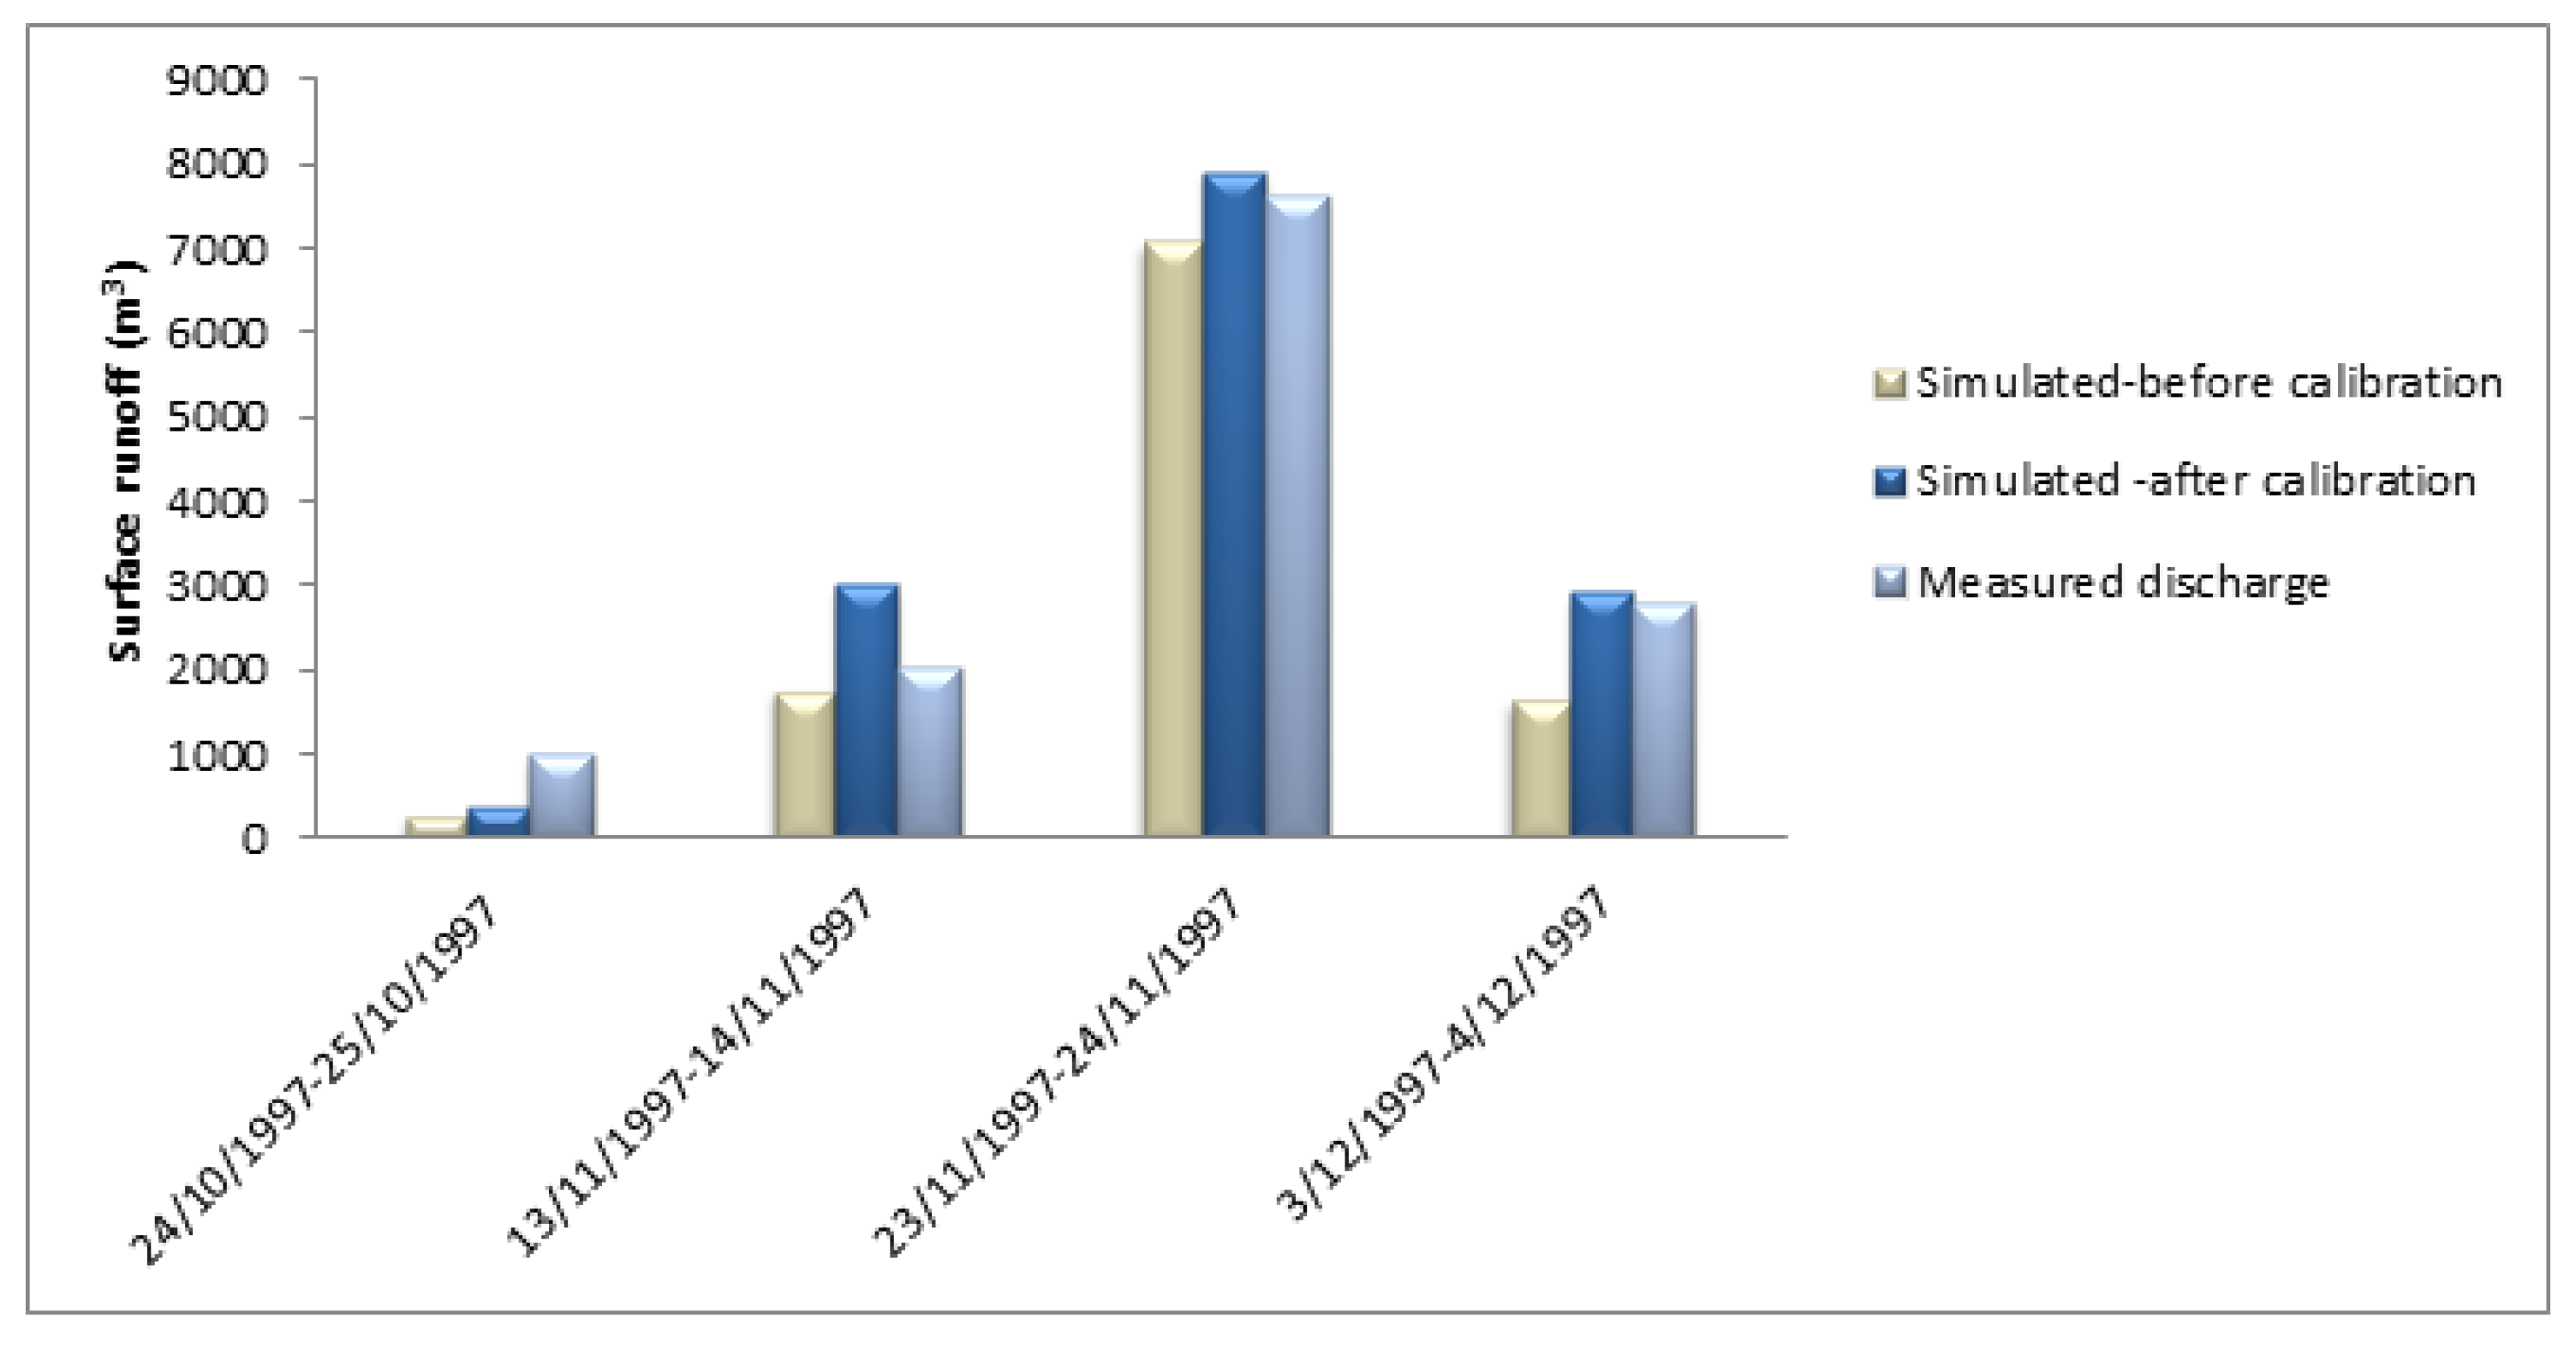
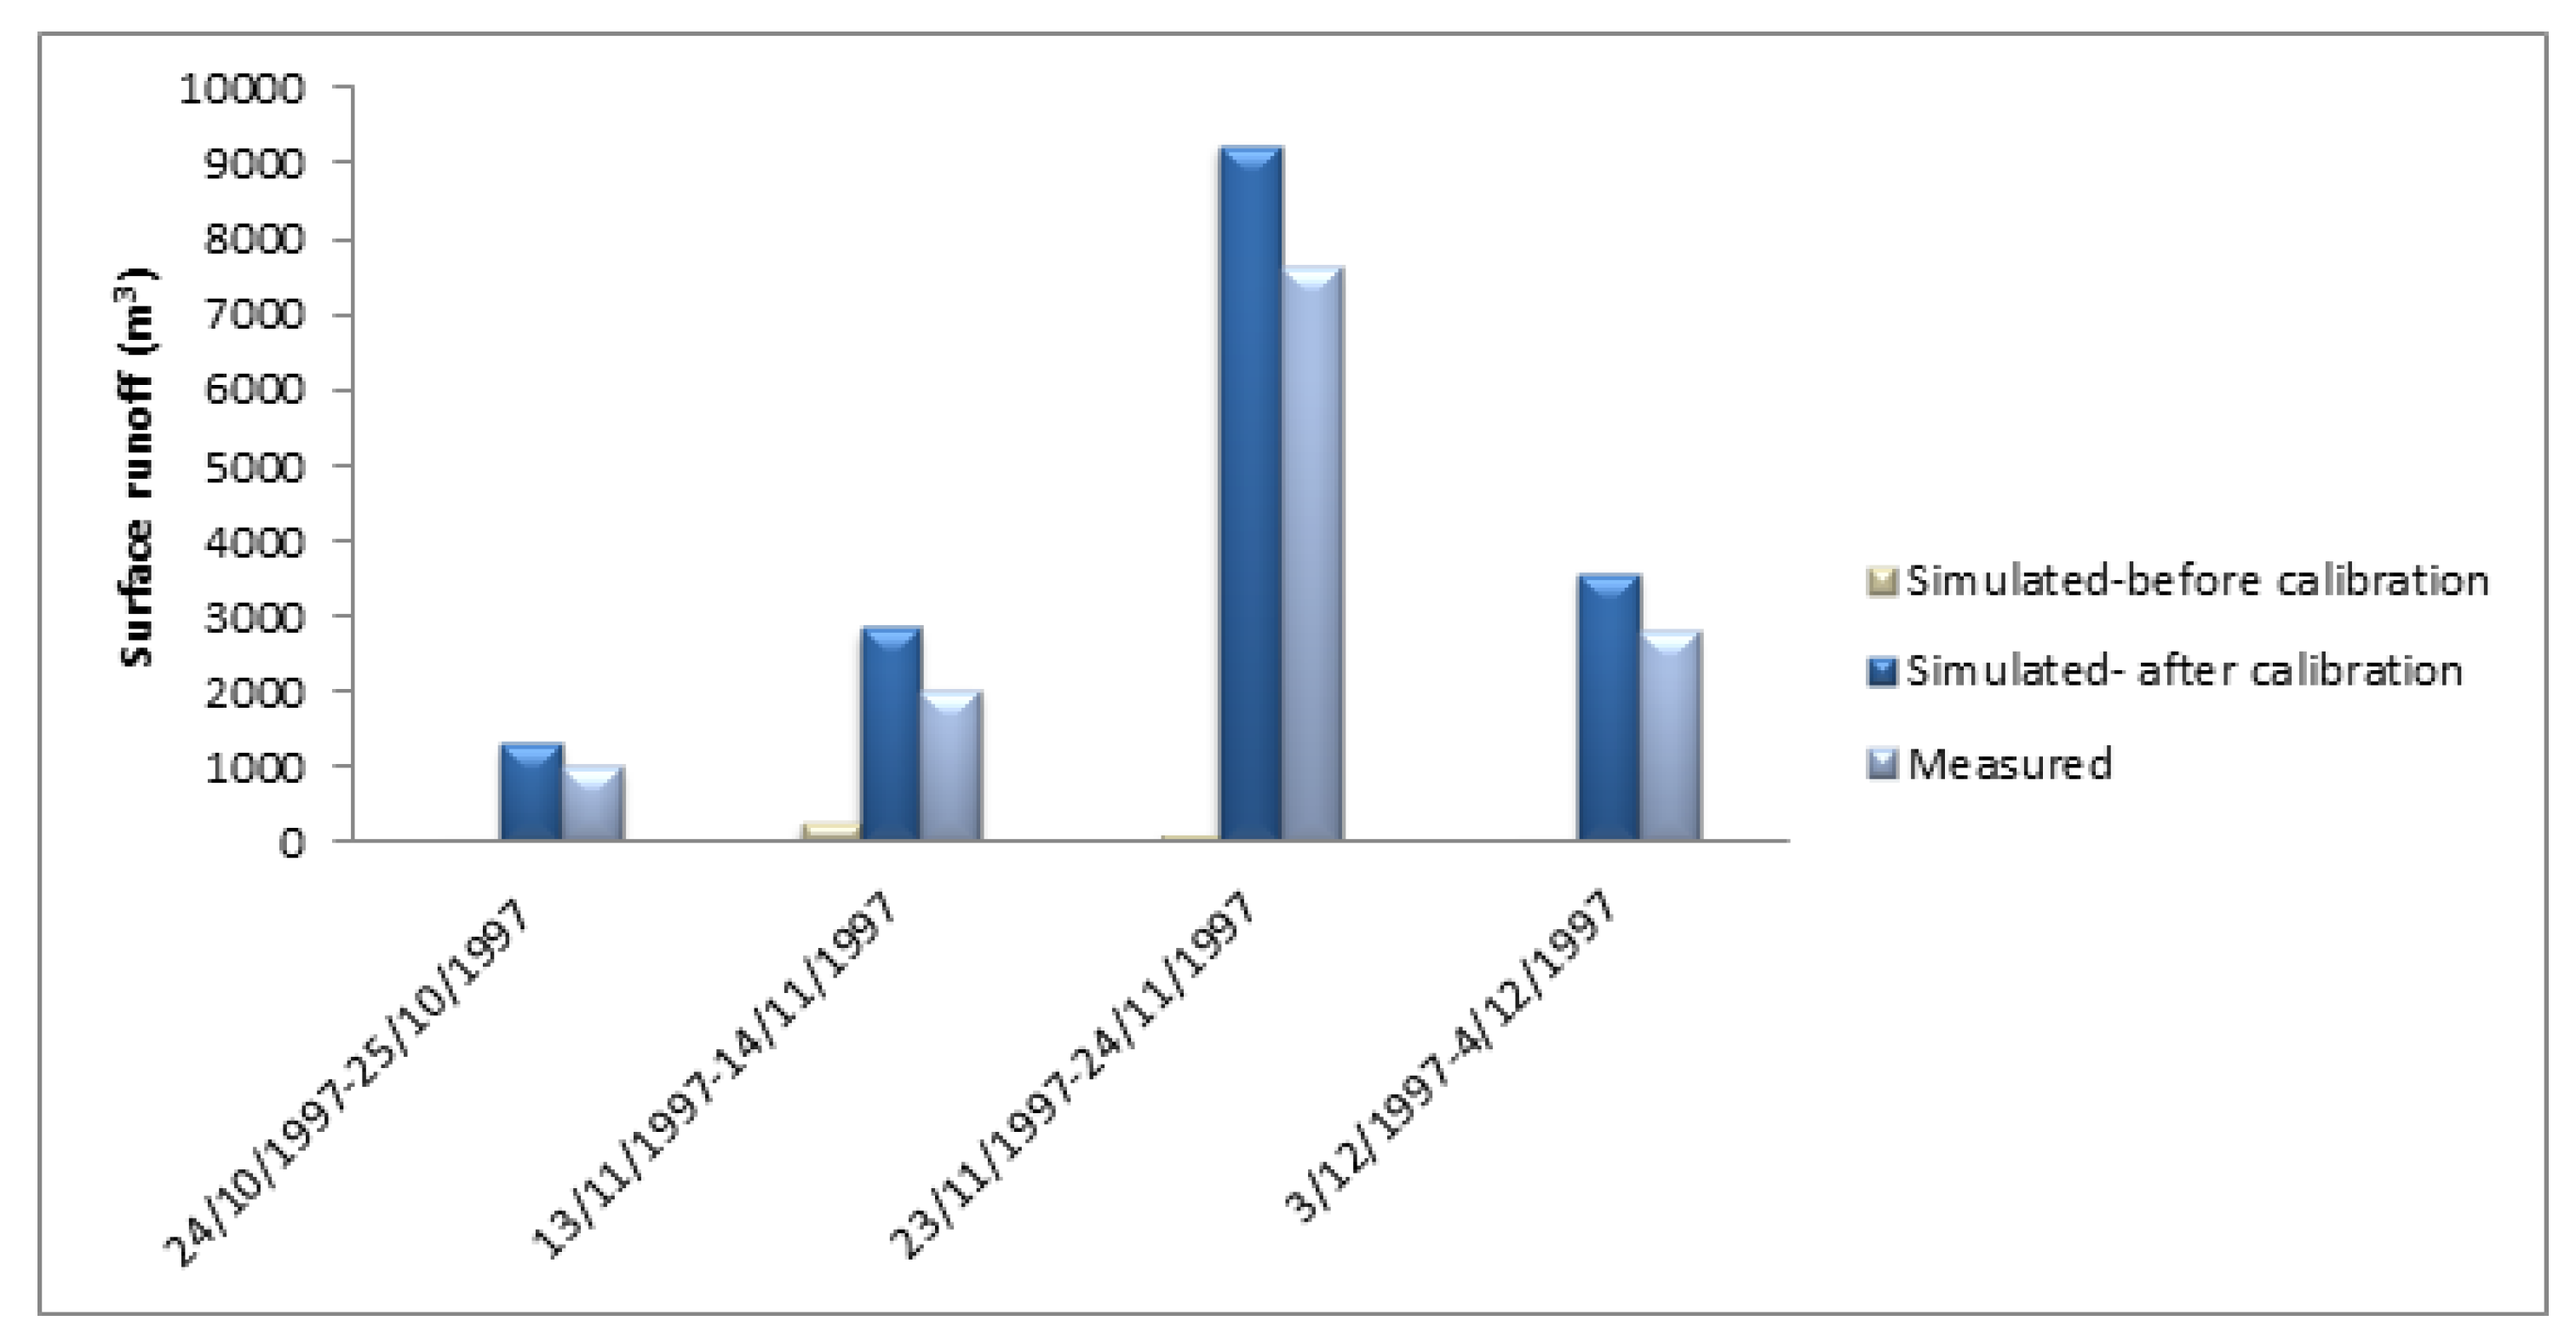
The FEST hydrological model was used to simulate the hydrological balance of the Bonis basin with an hourly time step for the period 1997–1998. Subsequently, the hydrological model was calibrated with the aim of improving the simulation of the runoff volume during the flood events, by tuning parameters according to sensitivity analysis results.
Figure 2 and
Figure 3 show a comparison between the observed and the simulated flood volumes before and after calibration using the Curve Number and Green-Ampt methods, respectively.
Table 4 shows the relative error in simulating runoff volume with Curve Number and Green-Ampt methods for the four selected events and average values.
The results show that the Curve Number method provides a sufficiently accurate estimate of the flood volume even before parameter calibration. Parameter calibration allows to further reduce the error that decreases from −0.33 to −0.02. Simulations using the Green-Ampt method before parameter calibration show a runoff value close to zero, thus with very high errors. Only after the calibration of the parameters, satisfactory results are achieved.
4. Conclusions
In this paper we presented a comparison of two infiltration equations implemented within a distributed hydrological model for simulation of four flood events occurred in the period 1997–1998 in the Bonis river basin.
Sensitivity analysis shows that Curve Number equation is very sensitive to Curve number parameter, followed by saturated hydraulic conductivity. Green-Ampt denotes high sensitivity to saturated hydraulic conductivity and saturated water content. These parameters are thus the most important as far as model calibration is concerned.
Hydrological simulation of the four main floods occurred in the Bonis river in the period 1997–1998, shows that the Curve Number method provides a sufficiently accurate estimate of the flood volume even before parameter calibration. Parameter calibration allows to further reduce the error. Simulations using the Green-Ampt method before parameter calibration show a runoff value close to zero, thus with very high errors. Only after the calibration of the parameters satisfactory results are achieved.
These conclusions imply important consequences for application of hydrological model in ungauged basins. In fact, when river discharge observations are not available to calibrate model, the Curve Number seems to be a better choice to simulate flood runoff.
More simulations for the Bonis river and further applications to other basins are required to confirm results.
Author Contributions
G.R. and M.F. conceived and designed the experiments; T.C. and G.P. provided and prepared input data; M.F. performed the experiments; M.F. and G.R. analyzed the data; G.R. and M.F. wrote the paper.
Acknowledgments
This work was supported by INNOMED project “Innovative Options for Integrated Water Resources Management in the Mediterranean” [
http://innomed.csic.es/] funded by EU Water Joint Programming Initiative.
Conflicts of Interest
The authors declare no conflict of interest. The founding sponsors had no role in the design of the study; in the collection, analyses, or interpretation of data; in the writing of the manuscript, and in the decision to publish the results.
References
- Ravazzani, G.; Barbero, S.; Salandin, A.; Senatore, A.; Mancini, M. An integrated hydrological model for assessing climate change impacts on water resources of the Upper Po river basin. Water Resour. Manag. 2015, 29, 1193–1215. [Google Scholar] [CrossRef]
- Caloiero, T.; Coscarelli, R.; Ferrari, E.; Sirangelo, B. Trend analysis of monthly mean values and extreme indices of daily temperature in a region of southern Italy. Int. J. Climatol. 2017, 37, 284–297. [Google Scholar] [CrossRef]
- Global Water Partnership-Technical Committee (GWP-TEC). Integrated Water Resources Management (IWRM) and Water Efficiency Plans by 2005, Why, What and How? TEC Background Papers No. 10; TEC: Stockholm, Sweden, 2004. [Google Scholar]
- Ravazzani, G.; Corbari, C.; Ceppi, A.; Feki, M.; Mancini, M.; Ferrari, F.; Gianfreda, R.; Colombo, R.; Ginocchi, M.; Meucci, S.; et al. From (cyber) space to ground: New technologies for smart farming. Hydrol. Res. 2017, 48, 656–672. [Google Scholar] [CrossRef]
- Ceppi, A.; Ravazzani, G.; Corbari, C.; Salerno, R.; Meucci, S.; Mancini, M. Real time drought forecasting system for irrigation management. Hydrol. Earth Syst. Sci. 2014, 18, 3353–3366. [Google Scholar] [CrossRef]
- Silva-Hidalgo, H.; Martín-Domínguez, I.R.; Alarcón-Herrera, M.T.; Granados-Olivas, A. Mathematical Modelling for the Integrated Management of Water Resources in Hydrological Basins. Water Resour. Manag. 2009, 23, 721–730. [Google Scholar] [CrossRef]
- Cornelissen, T.; Diekkrüger, B.; Bogena, H.R. Using High-Resolution Data to Test Parameter Sensitivity of the Distributed Hydrological Model HydroGeoSphere. Water 2016, 8, 202. [Google Scholar] [CrossRef]
- Muñoz, E.; Arumí, J.L.; Wagener, T.; Oyarzún, R.; Parra, V. Unraveling complex hydrogeological processes in Andean basins in south-central Chile: An integrated assessment to understand hydrological dissimilarity. Hydrol. Process. 2016, 30, 4934–4943. [Google Scholar] [CrossRef]
- Caloiero, T.; Biondo, C.; Callegari, G.; Collalti, A.; Froio, R.; Maesano, M.; Matteucci, G.; Pellicone, G.; Veltri, A. Results of a long-term study on an experimental watershed in southern Italy. Forum Geogr. 2016, XV (Suppl. 2), 55–65. [Google Scholar] [CrossRef]
- Carsel, R.F.; Parrish, R.S. Developing joint probability distributions of soil water retention characteristics. Water Resour. Res. 1988, 24, 755–769. [Google Scholar] [CrossRef]
- Ravazzani, G.; Gianoli, P.; Meucci, S.; Mancini, M. Assessing downstream impacts of detention basins in urbanized river basins using a distributed hydrological model. Water Resour. Manag. 2014, 28, 1033–1044. [Google Scholar] [CrossRef]
- Ravazzani, G.; Gianoli, P.; Meucci, S.; Mancini, M. Indirect estimation of design flood in urbanized river basins using a distributed hydrological model. J. Hydrol. Eng. 2014, 19, 235–242. [Google Scholar] [CrossRef]
- Ravazzani, G. MOSAICO, a library for raster based hydrological applications. Comput. Geosci. 2013, 51, 1–6. [Google Scholar] [CrossRef]
- Pianosi, F.; Ravazzani, G. Assessing rainfall-runoff models for the management of Lake Verbano. Hydrol. Process. 2010, 24, 3195–3205. [Google Scholar] [CrossRef]
- Rabuffetti, D.; Ravazzani, G.; Corbari, C.; Mancini, M. Verification of operational Quantitative Discharge Forecast (QDF) for a regional warning system—The AMPHORE case studies in the upper Po River. Nat. Hazards Earth Syst. 2008, 8, 161–173. [Google Scholar] [CrossRef]
- Ravazzani, G.; Mancini, M.; Giudici, I.; Amadio, P. Effects of soil moisture parameterization on a real-time flood forecasting system based on rainfall thresholds. In Quantification and Reduction of Predictive Uncertainty for Sustainable Water Resources Management, Proceedings of the Symposium HS2004 at IUGG2007, Perugia, Italy, 7–13 July 2007, IAHS Publication: Wallingford, UK, 2007; Volume 313, pp. 407–416.
- Green, W.H.; Ampt, G. Studies of soil physics, part I—The flow of air and water through soils. J. Agric. Sci. 1911, 4, 1–24. [Google Scholar]
- Ravazzani, G.; Corbari, C.; Morella, S.; Gianoli, P.; Mancini, M. Modified Hargreaves-Samani equation for the assessment of reference evapotranspiration in Alpine river basins. J. Irrig. Drain. Eng. 2012, 138, 592–599. [Google Scholar] [CrossRef]
- Montaldo, N.; Ravazzani, G.; Mancini, M. On the prediction of the Toce alpine basin floods with distributed hydrologic models. Hydrol. Process. 2007, 21, 608–621. [Google Scholar] [CrossRef]
- Moriasi, D.N.; Arnold, J.G.; Van Liew, M.W.; Bingner, R.L.; Harmel, R.D.; Veith, T.L. Model evaluation guidelines for systematic quantification of accuracy in watershed simulations. Trans. ASABE 2007, 50, 885–900. [Google Scholar] [CrossRef]
- Lenhart, T.; Eckhardt, K.; Fohrer, N.; Frede, H.-G. Comparison of two different approaches of sensitivity analysis. Phys. Chem. Earth J. 2002, 27, 645–654. [Google Scholar] [CrossRef]
| Publisher’s Note: MDPI stays neutral with regard to jurisdictional claims in published maps and institutional affiliations. |
© 2018 by the authors. Licensee MDPI, Basel, Switzerland. This article is an open access article distributed under the terms and conditions of the Creative Commons Attribution (CC BY) license (https://creativecommons.org/licenses/by/4.0/).


