Proceeding Paper

Comparative Assessment of Various Water Quality Indices (WQIs) in Polyphytos Reservoir-Aliakmon River, Greece †

by
Ioanna Zotou
1,*,
Vassilios A. Tsihrintzis
1 and
Georgios D. Gikas
2
1
Centre for the assessment of Natural Hazards and Proactive Planning & Laboratory of Reclamation Works and Water Resources Management, School of Rural and Surveying Engineering, National Technical University οf Athens, Zografou, 157 80 Athens, Greece
2
Laboratory of Ecological Engineering and Technology, Department of Environmental Engineering, School of Engineering, Democritus University of Thrace, 67100 Xanthi, Greece
*
Author to whom correspondence should be addressed.
Presented at the 3rd EWaS International Conference on “Insights on the Water-Energy-Food Nexus”, Lefkada Island, Greece, 27–30 June 2018.
Proceedings 2018, 2(11), 611; https://doi.org/10.3390/proceedings2110611
Published: 6 August 2018
(This article belongs to the Proceedings of EWaS3 2018)

Abstract

:
The present study attempts to examine the comparative performance of seven different WQIs, as they were computed for Polyphytos Reservoir-Aliakmon River in Greece, based on water quality monitoring data for the period between June 2004 and May 2005. The WQIs applied were: Prati’s Index of Pollution, Bhargava’s Index, Oregon WQI, Dinius’ Index, CCME WQI, NSF WQI and the Weighted Arithmetic WQI. Significant discrepancies were observed in classification results between the different methodologies. Among others, it was concluded that NSF and Bhargava indices classify the reservoir in higher quality classes, Prati’s and Dinius indices in medium, while CCME and Oregon in lower quality categories.

1. Introduction

The continuous pressures on the existing water systems, due to both natural and man-made causes, require systematic monitoring and evaluation of their quantitative and qualitative status. In particular, the qualitative assessment of water bodies constitutes a process whose importance has been recognized in the last decades. According to the EU 2000/60 Water Framework Directive, measures should be applied to improve the water quality of aquatic systems in Europe and, in particular, to ensure that all water bodies achieve “good” water quality by 2015. For this purpose, a prior assessment and classification of their ecological and chemical status needs to be implemented. However, the European framework only gives the general guidelines and does not provide any specific tools in order to evaluate and classify the aquatic systems. Undoubtedly, this has a negative effect on the compatibility between the methodologies that different member States utilize as well as on the ability of comparing classification results derived for different types of aquatic systems (i.e., lakes, rivers, groundwaters, coastal areas etc.) [1,2].
Based on the above, it becomes clear that an appropriate methodology must be established, which will evaluate and classify each water body, in a way uniform and compatible among all different aquatic systems and member states. In this context, the contribution of Water Quality Indices (WQIs) could be of determinant importance. WQIs constitute methodologies able to integrate a large number of water quality data, i.e., concentrations of quality parameters measured at a specific location and time in a particular water body, into a single value (score) which expresses the current quality status of the given body. Based on appropriate classification schemes, determined by each individual methodology, these scores correspond to specific quality classes (often from 1 to 5), each expressing a specific quality condition, such as “very bad”, “bad”, “medium”, “good”, or “excellent” water quality [3]. Thus, the main advantages arising from the application of WQIs are: (a) the attribution of a simple and comprehensible, even to non-experts, quality characterization to the water body under consideration, facilitating public information; and (b) the establishment of a common reference framework for the comparison of different water bodies [4]. Regardless of the specific characteristics of each individual method, WQI application includes: (a) the selection of a certain combination of quality parameters; (b) the normalization of their concentrations through a mathematical function (subindex function), in order to make them comparable; (c) the assignment of a weighting factor to each individual variable, depending on its relative importance to the overall water quality; and (d) the aggregation of the normalized values of individual quality variables to produce a single result (usually expressed on a scale from 1 to 100), which will reflect the overall quality status of the water body being examined.
Beginning with Horton’s Index (1965) [5], a large number of indices have been developed for the evaluation of the quality status of water bodies. Many researchers, on a global scale, have implemented WQI studies in order to investigate the reliance these tools provide under different local conditions [6,7,8,9,10,11,12,13,14,15,16,17,18]. At the same time, several scientists have attempted to apply different WQIs in a certain water body in order to evaluate their comparative performance [1,19,20].
The present study attempts to apply five different WQIs in a lacustrine water body in Greece, that of Polyphytos Reservoir-Aliakmon River, in Kozani, based on monitoring data for the period between June 2004 and May 2005. The indices which were applied were the: Prati’s Index of Pollution [21], Bhargava’s Index [22], Oregon WQI [23], Dinius’ Index [24], and the Weighted Arithmetic WQI [25]. Furthermore, the results of CCME and NSF WQI values, as derived for the same water body and monitoring period by Alexakis et al. [1], were used in order to obtain a more complete view of the comparative performance of the individual indices. The main objectives of this work were: (a) to assess the quality status of the given body; and (b) to draw conclusions regarding the effect of the selected methodology on the qualitative ranking.

2. Materials and Methods

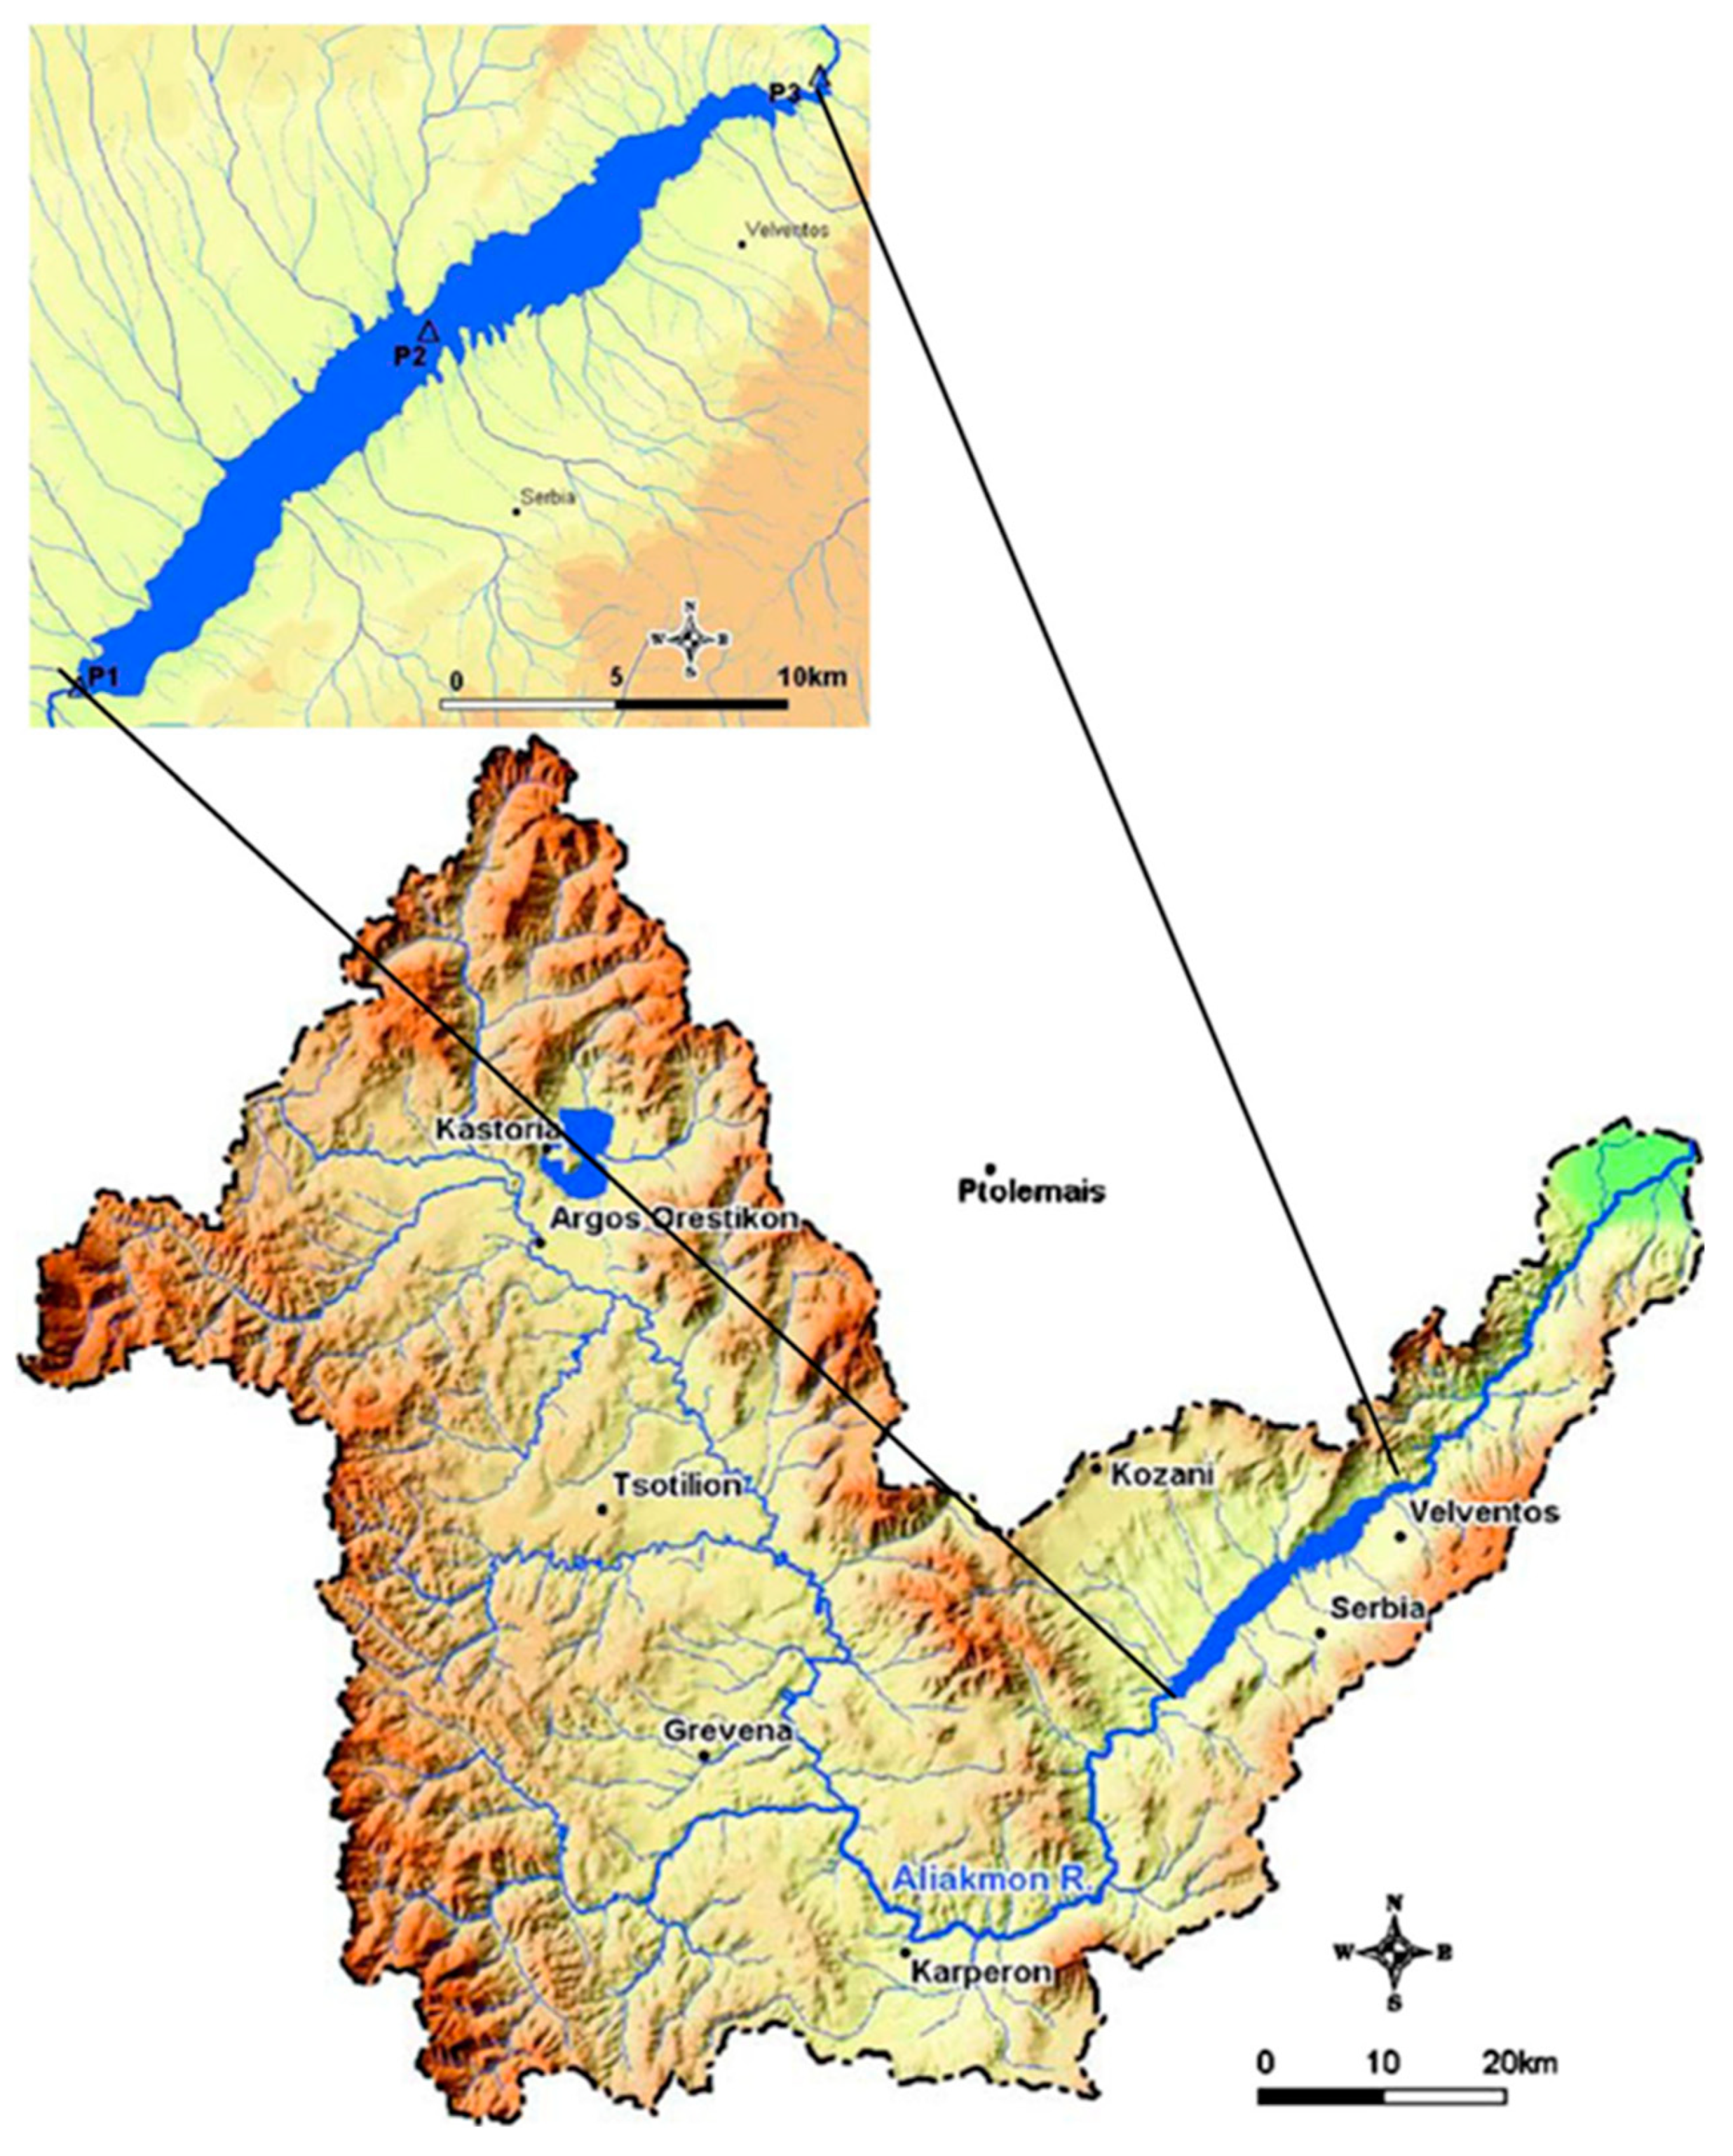
2.1. Area of Application

Polyphytos Reservoir is located in the Region of West Macedonia, Greece, and more specifically, in the Regional Unit of Kozani. Based on the administrative division of the latter into four municipalities, the reservoir falls into the administrative boundaries of the Municipalities of Kozani and Serbia-Velventos. The artificial lake was created in 1972 after the construction of the Polyphytos dam in Aliakmon River, with main objective to cover the water needs of the area for irrigation and hydropower. Other uses for which the reservoir is exploited today are fishing, recreation and potable water supply. Detailed descriptions of the reservoir and Aliakmon River are presented by Gikas et al. [26] and Alexakis et al. [1].
Potential point and non-point sources of pollution of the reservoir may be, among others, livestock and agricultural activities, the operation of small milk and meat processing industries, as well as the existence of thermal power plant and coal mining in the area between the cities of Kozani and Ptolemaida. In addition, many cities or villages in the area use the main reach of Aliakmon River upstream of the reservoir, as well as some torrents ending directly into the lake, as receivers of their municipal wastewater, part of which is untreated [1,26].

2.2. Water Quality Monitoring

In the present study, in order to apply the individual WQIs and assess the quality status of the water body being examined, thirteen water quality parameters were taken into account: temperature (T), dissolved oxygen (DO), pH, electrical conductivity (EC), turbidity, biochemical oxygen demand (BOD5), chemical oxygen demand (COD), total suspended solids (TSS), nitrite nitrogen (NO2-N), nitrate nitrogen (NO3-N), ammonia nitrogen (NH4+-N), total Kjeldahl nitrogen (TKN) and total phosphorus (TP). It is mentioned that the above parameters were used depending on the methodological framework of each individual methodology, as each index integrates a different combination and number of quality parameters. All the necessary data, i.e., monthly concentrations of the physico-chemical parameters at specific positions of the reservoir, were collected during a previous study [26]. A detailed description of the monitoring network is given by Gikas et al. [26]. Briefly, the sampling period lasted one year (from June 2004 to May 2005), during which water samples were collected on a monthly basis at three different monitoring stations (P1, P2, P3) along the reservoir and at two different depths, i.e., at the surface and close to the bottom. In particular, the monitoring station P1 (further upstream station) was installed at Rymnion bridge, where Aliakmon River drains into the reservoir, the second station (P2) at Serbia bridge, while the third one (P3) at Polyphytos dam. The exact locations of the three stations are presented in Figure 1.

2.3. Application of the Methodology

As mentioned, the five WQIs applied were the: (a) Prati’s Index of Pollution [21]; (b) Bhargava’s WQI [22]; (c) Oregon WQI [23]; (d) Dinius second index [24]; and (e) Weighted Arithmetic WQI [25]. Also, the results of the application of CCME (Canadian Council of Ministers of Environment) and NSF (National Sanitation Foundation) WQIs, for the same water body and the same monitoring dataset, presented by Alexakis et al. [1], were used. The selection of the above indices was made taking into account the compatibility of the type of water use they evaluate and the availability of the water quality data necessary for their computation. Among them, the Weighted Arithmetic WQI examines the water quality exclusively for drinking purposes and, consequently, its application in the present study has mostly a research character. Detailed descriptions of the calculating frameworks, as well as the classification schemes of the five indices utilized, are given in relevant publications [21,22,23,24,25]. For further details regarding the application of each individual methodology and the assumptions made in the present work one can refer to [27].
The water quality parameters included in each WQI are presented in Table 1. In addition, given that the calculation of the Weighted Arithmetic WQI requires the use of boundary concentration values defined by the user, the quality standards utilized in this study are also provided. These values were determined synthetically based on the guidelines of Directive 98/83/EC [28], Joint Ministerial Decision 46399/4352/86 [29], World Health Organization [30], and CCME [31].
Each WQI was calculated separately for each month during which a sampling campaign was undertaken and for each individual monitoring station (P1, P2 and P3) and depth (i.e., surface or bottom). According to the classification system of each methodology, the monthly WQI values were assigned to a certain water quality class from 1 to 5, where class 1 indicates the worst water quality level (e.g., poor or unacceptable water quality) and class 5 corresponds to the best one (e.g., excellent water quality). Based on this process, the variation of the quality class during the monitoring period, for each individual index, was determined (Figure 2).
In order to classify the reservoir according to its overall water quality, the worst quality scenario was taken into consideration, i.e., the overall quality of the water body was determined by the month and the monitoring station with the lowest quality class. The results of the final classification of Polyphytos reservoir based on ach index applied are presented in Table 2.

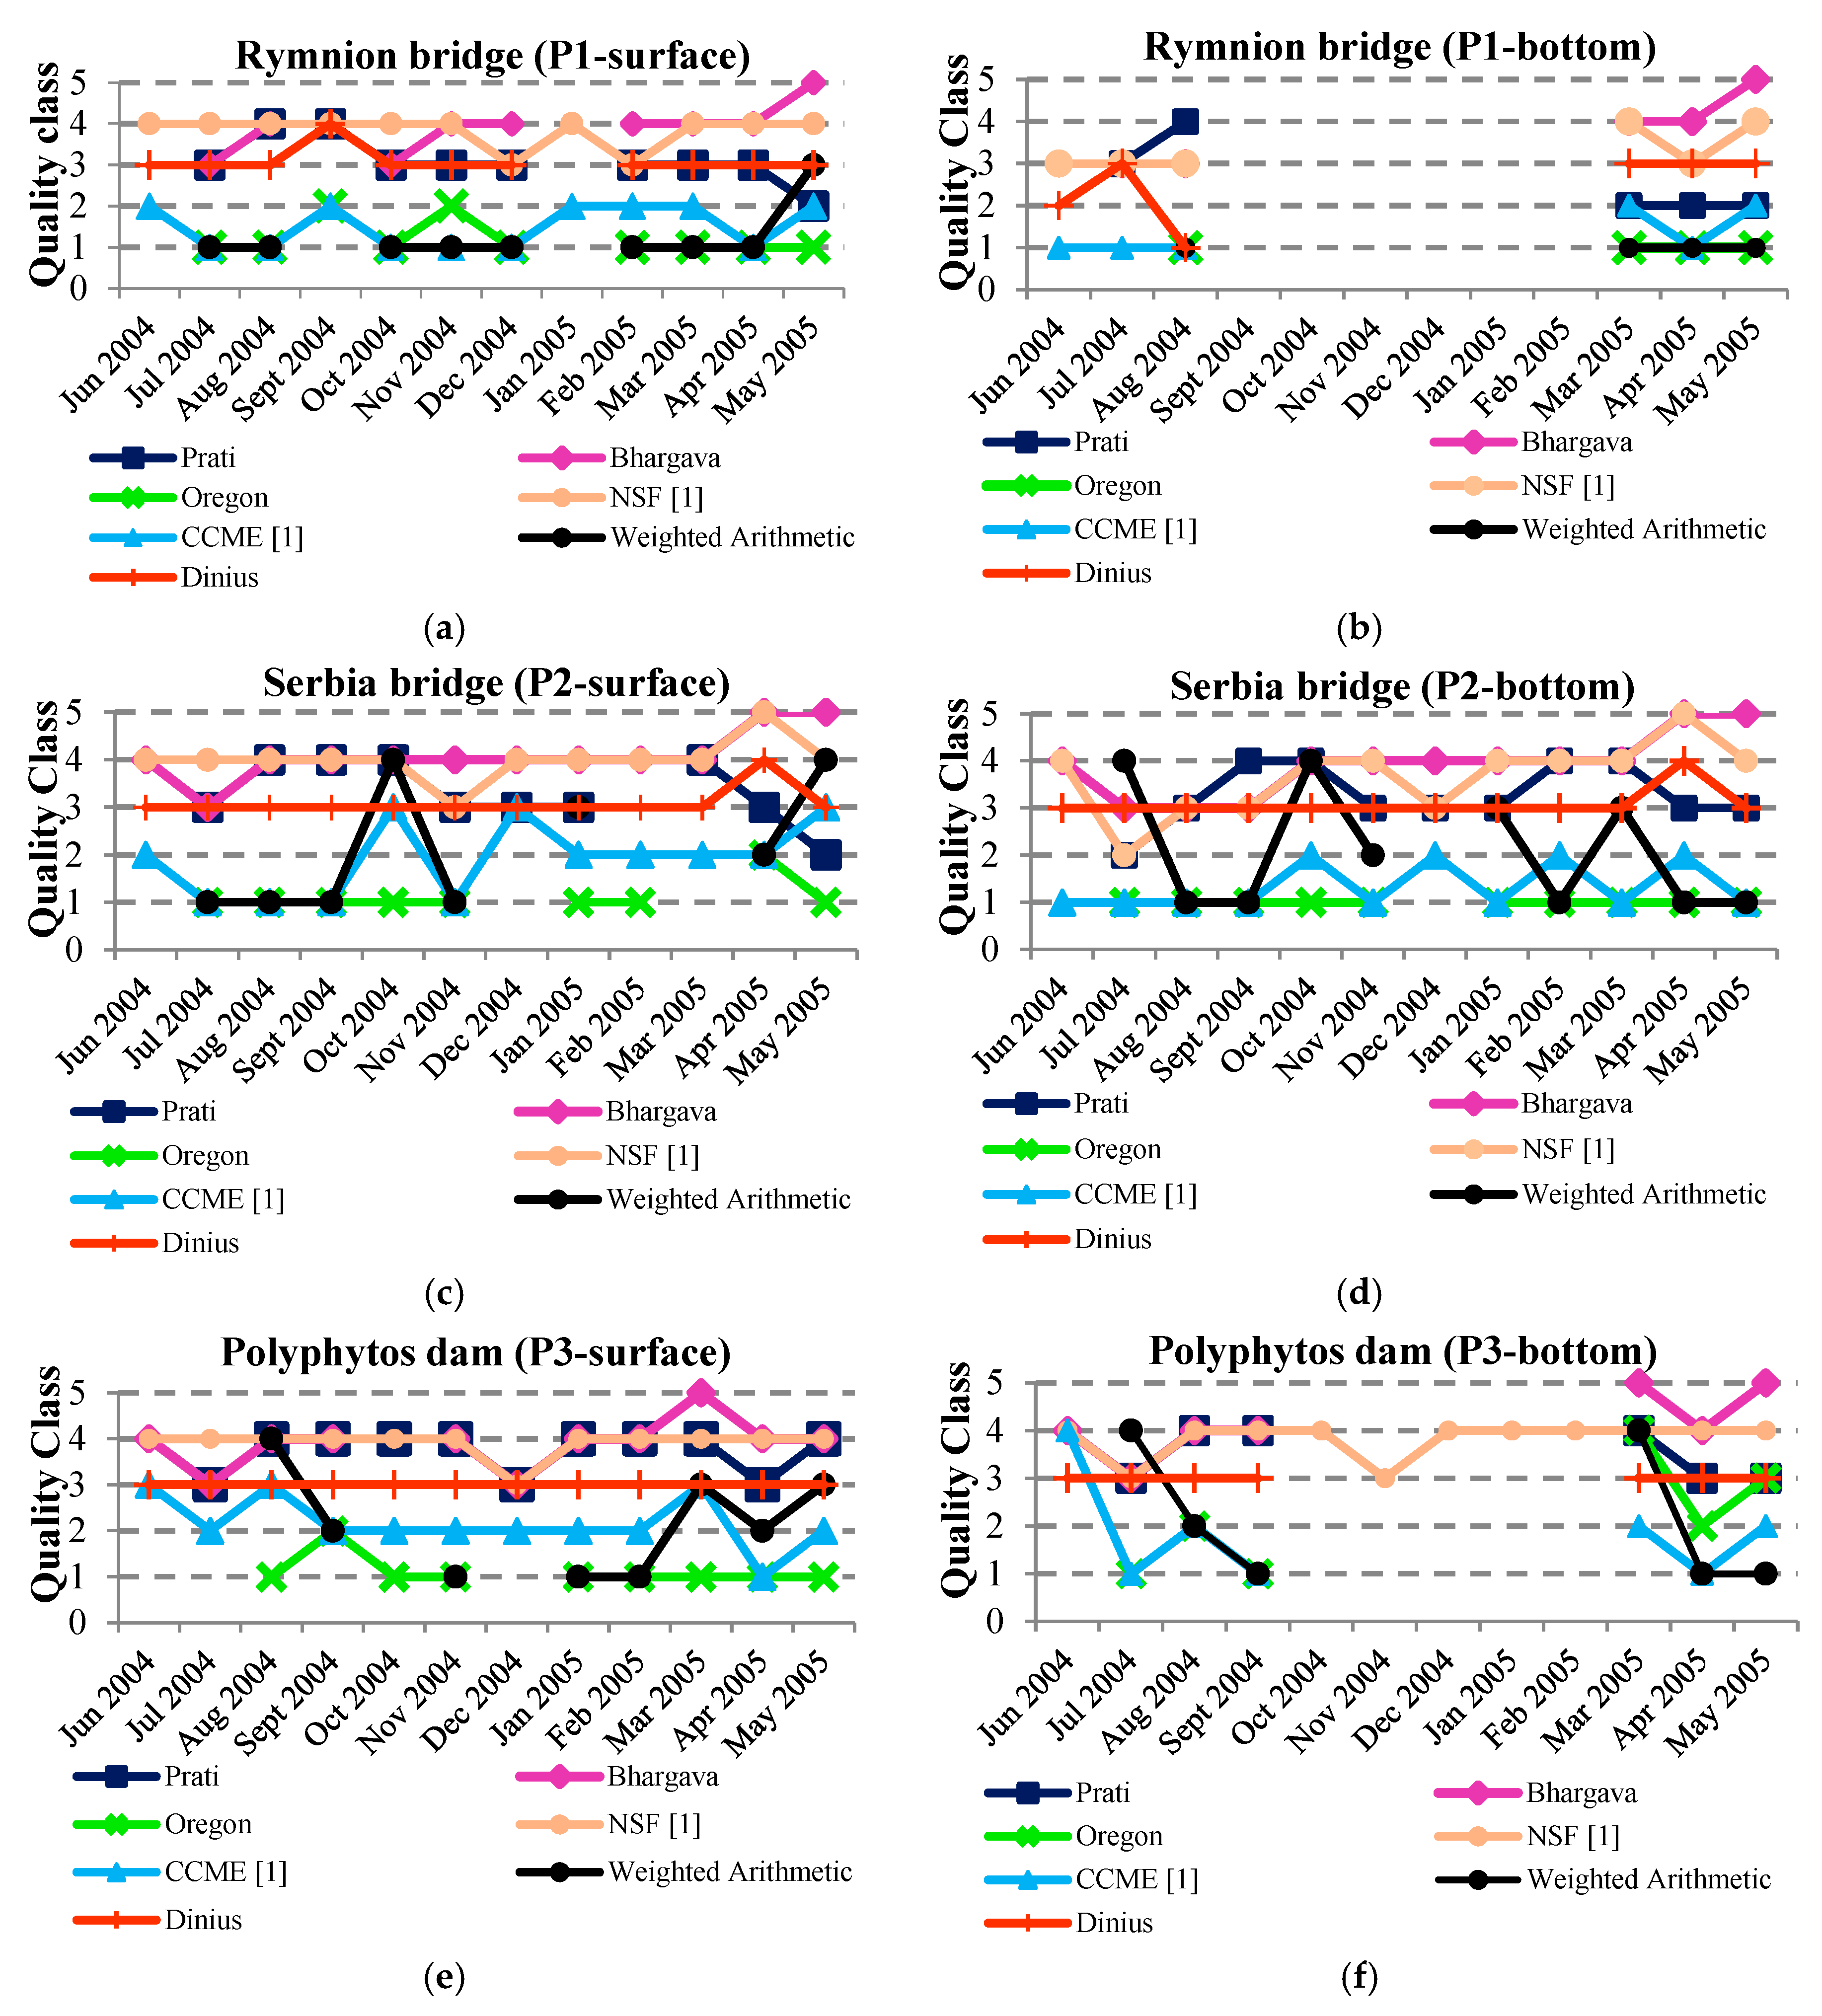
3. Results and Discussion

Figure 2 presents the variation of qualitative class (from 1 to 5) during the monitoring period in Polyphytos reservoir. Observing the following results, it becomes clear that significant discrepancies are recorded in the qualitative classification among the individual methodologies. More specifically, based on the quality class results (1 to 5) per sampling, it is seen that three distinct categories of indices are formed. In particular, Bhargava and NSF indices, for all the stations and depths being examined, range mainly between the superior quality classes 3 and 5.
It is also observed that Prati’s Index along with Dinius, range mostly between the middle classes of the quality ranking, since for the majority of the individual stations and depths they give results ranging between classes 2 and 4. Finally, CCME and Oregon WQIs could be characterized as “stricter”, given that their application leads to the classification of the reservoir mostly between the lowest quality categories 1 and 3. Regarding the Weighted Arithmetic WQI, it was found that the qualitative ranking results derived from its application present significantly higher variation compared to those derived from the rest of the methodologies, as for the majority of the positions under consideration it ranges between classes 1 and 4, occupying almost the entire range of the qualitative ranking.
Table 2 presents the qualitative classification of Polyphytos reservoir, as derived from each methodology, based on the worst quality scenario. In particular, for each methodology, the quality class, the corresponding quality characterization, as well as the monitoring station and depth at which the worst quality class was recorded are provided. It should be clarified that the last column refers exclusively to the position where the lowest (or the highest, in case of an ascending scale index) numerical value, i.e., the index value based on which the water body was classified, was recorded. Given this fact, only one station and depth are provided for each methodology, although more than one monitoring stations may have been categorized at least once in the corresponding quality class. It is seen that Bhargava’s WQI classifies the reservoir in higher quality category (quality class 3) compared to the other indices, while it is followed by Prati’s and NSF WQIs which categorize the water body one class lower, in quality class 2. For the rest of the methodologies, the reservoir falls into the lowest quality class, i.e., the 1st class.

4. Conclusions

WQIs are particularly useful tools, in the direction of the qualitative assessment of aquatic systems, as they provide the opportunity to evaluate existing quality conditions by classifying water bodies into certain quality categories. Furthermore, a common reference framework is provided for comparing different water bodies, as well as for detecting differences in quality conditions between different positions of the same body. Finally, the application of WQIs at different time periods allows for the identification of potential trends of deterioration or improvement of the existing conditions.
In this study, an attempt was made to implement five different WQIs in order to assess the quality status of Polyphytos reservoir-Aliakmon River in Greece. In addition, the results of two other indices (CCME and NSF), derived in a previous study, were used to obtain a more complete view of the comparative performance of the different methodologies. It is concluded that three individual categories of indices are formed based on the produced classification results. In particular, Bhargava and NSF indices tend to classify the reservoir into superior quality classes, Prati’s and Dinius indices fall mainly into the middle classes of the quality ranking, while CCME and Oregon could be considered as “stricter” since they give results which range steadily between the lower quality classes. Therefore, deviation in results of the various indices was observed, and the application of the above methodologies in an adequate number of water bodies is needed in order to draw more reliable conclusions regarding their comparative performance.

Author Contributions

I.Z. developed and implemented the methodologies and wrote the paper; V.A.T. conducted the field monitoring and provided the dataset, contributed to the writing, critically reviewed the final paper and supervised the work; G.D.G also conducted the field monitoring and critically reviewed the paper.

Conflicts of Interest

The authors declare no conflict of interest.

References

  1. Alexakis, D.; Tsihrintzis, V.A.; Tsakiris, G.; Gikas, G.D. Suitability of Water Quality Indices for application in lakes in the Mediterranean. Water Resour. Manag. 2016, 30, 1621–1633. [Google Scholar] [CrossRef]
  2. Tsakiris, G. The status of the European waters in 2015: A review. Environ. Process. 2015, 2, 543–557. [Google Scholar] [CrossRef]
  3. Tsakiris, V.; Alexakis, D.; Tsihrintzis, V.A. Assessing the quality of bottled water brands using a new water quality index. Eur. Water 2017, 58, 331–335. [Google Scholar]
  4. Abbasi, T.; Abbasi, S.A. Water Quality Indices; Elsevier: New York, NY, USA, 2012; p. 363. [Google Scholar]
  5. Horton, R.K. An index number system for rating water quality. J. Water Pollut. Control Fed. 1965, 37, 300–305. [Google Scholar]
  6. Pesce, S.F.; Wunderlin, A. Use of Water Quality Indices to verify the impact of Cordoba city (Argentina) on Suquia River. Water Res. 2000, 34, 2915–2926. [Google Scholar] [CrossRef]
  7. Jonnalagadda, S.B.; Mhere, G. Water quality of the Odzi River in the eastern highlands of Zimbabwe. Water Res. 2001, 35, 2371–2376. [Google Scholar] [CrossRef]
  8. Bordalo, A.A.; Nilsumranchit, W.; Chalermwat, K. Water quality of the Bangpakong River (Eastern Thailand). Water Res. 2001, 35, 3635–3642. [Google Scholar] [CrossRef]
  9. Debels, P.; Figueroa, R.; Urrutia, R.; Barra, R.; Niell, X. Evaluation of water quality in the Chillan River (Central Chile) using physicochemical parameters and a modified Water Quality Index. Environ. Monit. Assess. 2005, 110, 301–322. [Google Scholar] [CrossRef]
  10. Lumb, A.; Halliwell, D.; Sharma, T. Application of CCME Water Quality Index to monitor water quality: A case of the Mackenzie river basin, Canada. Environ. Monit. Assess. 2006, 113, 411–429. [Google Scholar] [CrossRef]
  11. Bordalo, A.A.; Teixeira, R.; Wiebe, W.J. A Water Quality Index applied to an international shared river basin: The case of the Douro River. Environ. Manag. 2006, 38, 910–920. [Google Scholar] [CrossRef]
  12. Sanchez, E.; Colmenarejo, M.F.; Vicente, J.; Rubio, A.; Garcia, M.G.; Travieso, L.; Borja, R. Use of the Water Quality Index and dissolved oxygen deficit as simple indicators of watersheds pollution. Ecol. Indic. 2007, 7, 315–328. [Google Scholar] [CrossRef]
  13. Haque, M.M.; Kader, F.; Kuruppu, U.; Rahman, A. Assessment of water quality in Hawkesbury-Nepean River in Sydney using Water Quality Index and multivariate analysis. In Proceedings of the 21st International Congress on Modelling and Simulation, Gold Coast, Australia, 29 November–4 December 2015. [Google Scholar]
  14. Ewaid, S.H. Water quality assessment of Al-Gharraf River, South of Iraq by Canadian Water Quality Index (CCME WQI). Iraqi J. Sci. 2016, 57, 878–885. [Google Scholar] [CrossRef]
  15. Moyel, M.S.; Hussain, N.A. Water quality assessment of the Shatt al-Arab River, Southern Iraq. J. Coast. Life Med. 2015, 3, 459–465. [Google Scholar] [CrossRef]
  16. Mitra, P.; Reddy, P.B. Application of Water Quality Index (WQI) as a tool for assessment of pollution status of Shivna River at Mandsaur, M.P. India. Trends Life Sci. J. 2016, 5. [Google Scholar] [CrossRef]
  17. Trikoilidou, E.; Samiotis, G.; Tsikritzis, L.; Kevrekidis, T.; Amanatidou, E. Evaluation of water quality indices adequacy in characterizing the physico-chemical water quality of lakes. Environ. Process. 2017, 4, 35–46. [Google Scholar] [CrossRef]
  18. Gikas, G.D. Water quantity and hydrochemical quality of Laspias River, North Greece. J. Environ. Sci. Health 2017, 52, 1312–1321. [Google Scholar] [CrossRef]
  19. Hashim, S.; Yuebo, X.; Hashim, I. Comparative indices evaluation to restore urban rivers water quality by using bacterial technology. Kasmera J. 2015, 43, 198–209. [Google Scholar]
  20. Darvishi, G.; Kootenaei, F.G.; Ramezani, M.; Lotfi, E.; Asgharnia, H. Comparative investigation of river water quality by OWQI, NSFWQI and Wilcox Indices (Case study: The Talar River-Iran). Arch. Environ. Prot. 2016, 42, 41–48. [Google Scholar] [CrossRef]
  21. Prati, L.; Pavanello, R.; Pesarin, F. Assessment of surface water quality by a single index of pollution. Water Res. 1971, 5, 741–751. [Google Scholar] [CrossRef]
  22. Bhargava, D.S. Use of water quality index for river classification and zoning of Ganga River. Environ. Pollut. 1983, 6, 51–67. [Google Scholar] [CrossRef]
  23. Dinius, S.H. Design of an index of water quality. JAWRA 1987, 23, 833–843. [Google Scholar] [CrossRef]
  24. Cude, C.G. Oregon water quality index a tool for evaluating water quality management effectiveness. JAWRA 2001, 37, 125–137. [Google Scholar] [CrossRef]
  25. Tyagi, S.; Sharma, B.; Singh, P.; Dobhal, R. Water quality assessment in terms of Water Quality Index. AJWR 2013, 1, 34–38. [Google Scholar] [CrossRef]
  26. Gikas, G.D.; Tsihrintzis, V.A.; Akratos, C.S.; Haralambidis, G. Water quality trends in Polyphytos reservoir, Aliakmon river, Greece. Environ. Monit. Assess. 2009, 149, 163–181. [Google Scholar] [CrossRef] [PubMed]
  27. Zotou, I. Comparative Assessment of Seven Water Quality Indices (WQIs) based on Measurements in Surface Water Systems of Greece. M.Sc. Thesis, School of Civil Engineering, National Technical University of Athens, Athens, Greece, 2017. (In Greek). [Google Scholar]
  28. Joint Ministerial Decision Υ2/2600/2001; Quality of water intended for human consumption in compliance with Council Directive 98/83/EC of 3 November 1998. National Printing House of Greece: Athens, Greece, 2001. (In Greek)
  29. 29. Joint Ministerial Decision 46399/4352/86; Quality Required for Surface Water Intended for the Abstraction of Drinking Water, Bathing, Fish Life in Freshwater and Shellfish, Methods of Measurement and Frequency of Sampling and Analysis of Surface Water Intended for the Abstraction of Drinking Water, in Compliance with Council Directives 75/440/EEC, 76/160/EEC, 78/659/EEC, 79/923/EEC and 79/869/EEC. National Printing House of Greece: Athens, Greece, 1986. (In Greek)
  30. World Health Organization. Guidelines for Drinking-Water Quality-Vol. 1-Recommendations, 2nd ed.; WHO: Geneva, Switzerland, 1993; p. 150. [Google Scholar]
  31. Canadian Council of Ministers of the Environment. Canadian water quality guidelines for the protection of aquatic life: CCME Water Quality Index 1.0, User’s Manual. In Canadian Environmental Quality Guidelines; Canadian Council of Ministers of the Environment: Winnipeg, MB, Canada, 1999. [Google Scholar]
Figure 1. Morphology of Aliakmon River Basin and positions of the monitoring stations P1, P2 and P3 in Polyphytos Reservoir.
Proceedings 02 00611 g001
Figure 2. Variation of the quality class in Polyphytos reservoir according to each WQI applied at each of the three stations and two depths: (a) monitoring station P1-surface; (b) monitoring station P1-bottom; (c) monitoring station P2-surface; (d) monitoring station P2-bottom; (e) monitoring station P3-surface; (f) monitoring station P3-bottom.
Proceedings 02 00611 g002
Table 1. Selected parameters taken into consideration in the computation of the individual WQIs.
VariablePrati’s IndexBhargava’s WQIOregon WQIDinius IndexWeighted Arithmetic WQI-Recommended Standard Values
T ---
DO√ 5 mg/L [28]
pH-√ 6.5–9.5 [28]
EC--√ 2500 μS/cm [28]
Turbidity---√ 5 NTU [30]
BOD5√ 3 mg/L [29]
COD---√ 30 mg/L [29]
TSS--√ 25 mg/L [29]
NO2-N----√ 3 mg/L [30]
NO3-N-1√ 50 mg/L [28]
NH4+-N1-√ 0.5 mg/L [28]
TKN----√ 1 mg/L [29]
TP---√ 0.05 mg/L [31]
1 In the computation of Oregon WQI, the sum of NO3-N and NH4+-N was taken as one quality parameter.
Table 2. Final classification of Polyphytos reservoir based on the worst quality scenario for each WQI applied.
WQIWorst Quality Class Scenario for Each Methodology (1–5)Quality CharacterizationPosition Where the Worst Scenario Was Recorded
Prati’s Index of Pollution2PollutionΡ1 (bottom)
Bhargava’s Index3Satisfactory water qualityΡ2 (bottom)
Oregon WQI1Very poor water qualityΡ1 (surface)
NSF WQI [1]2Bad water qualityΡ2 (surface)
CCME WQI [1]1Poor water qualityΡ1 (surface)
Weighted Arithmetic WQI1Unacceptable for drinking purposesΡ2 (surface)
Dinius Index1Unacceptable water qualityΡ1 (bottom)
Publisher’s Note: MDPI stays neutral with regard to jurisdictional claims in published maps and institutional affiliations.

