Proceeding Paper

Development of the Statistical Model for Monitoring Salinization in the Mekong Delta of Vietnam Using Remote Sensing Data and In-Situ Measurements †

Department of Environment and Resources, Ho Chi Minh City University of Technology, Vietnam National University Ho Chi Minh City, Ho Chi Minh City 700000, Vietnam
*
Author to whom correspondence should be addressed.
Presented at the 1st International Electronic Conference on Geosciences (IECG 2018), 15–30 June 2018; Available online: https://sciforum.net/conference/IECG_2018.
Proceedings 2018, 2(10), 565; https://doi.org/10.3390/IECG_2018-05362
Published: 18 June 2018
(This article belongs to the Proceedings of IECG 2018)

Abstract

:
This article presents the methodology for developing a statistical model for monitoring salinity intrusion in the Mekong Delta based on the integration of satellite imagery and in-situ measurements. We used Landsat-8 Operational Land Imager and Thermal Infrared Sensor (Landsat- 8 OLI and TIRS) satellite data to establish the relationship between the planetary reflectance and the ground measured data in the dry season during 2014. The three spectral bands (blue, green, red) and the principal component band were used to obtain the most suitable models. The selected model showed a good correlation with the exponential function of the principal component band and the ground measured data (R2 > 0.8). Simulation of the salinity distribution along the river shows the intrusion of a 4 g/L salt boundary from the estuary to the inner field of more than 50 km. The developed model will be an active contribution, providing managers with adaptation and response solutions suitable for intrusion in the estuary as well as the inner field of the Mekong Delta.

1. Introduction

The Mekong Delta is a major agricultural area, contributing to export as well as the food supply to the people of Vietnam. However, this hollow terrain area, located in the downstream Mekong basin, is being heavily impacted by sea level rise and climate change. This has made drought and salinization more severe and is expected to continue with negative developments in the near future [1].
The traditional measurement of water salinity requires in-situ sampling, which is a costly and time-consuming effort. Because of these limitations, it is impractical to cover the whole water body or obtain frequent repeat samples at a site. This difficulty in achieving successive water salinity sampling becomes a barrier to water salinity monitoring and forecasting [2].
Remote sensing techniques have the potential to overcome these limitations by providing an alternative means of studying and monitoring water salinity over a wide range of both temporal and spatial scales. Several studies have confirmed that remote sensing can meet the demand for the large sample sizes required for water salinity studies conducted on the watershed scale [3]. Hence, a significant amount of research has been conducted to develop remote sensing methods and indices. These methods range from semi-empirical techniques to analytical methods for estimating and producing quantitative water salinity maps [4].
This research aimed to assess the use of remote sensing data for estimating the Mekong Delta water salinity using statistical techniques. The work was based on developing an algorithm for estimation of water salinity using the Landsat-8 Operational Land Imager and Thermal Infrared Sensor (Landsat-8 Operational Land Imager (OLI) and Thermal Infrared Sensor (TIRS)) bands reflectance.

2. Materials and Methods
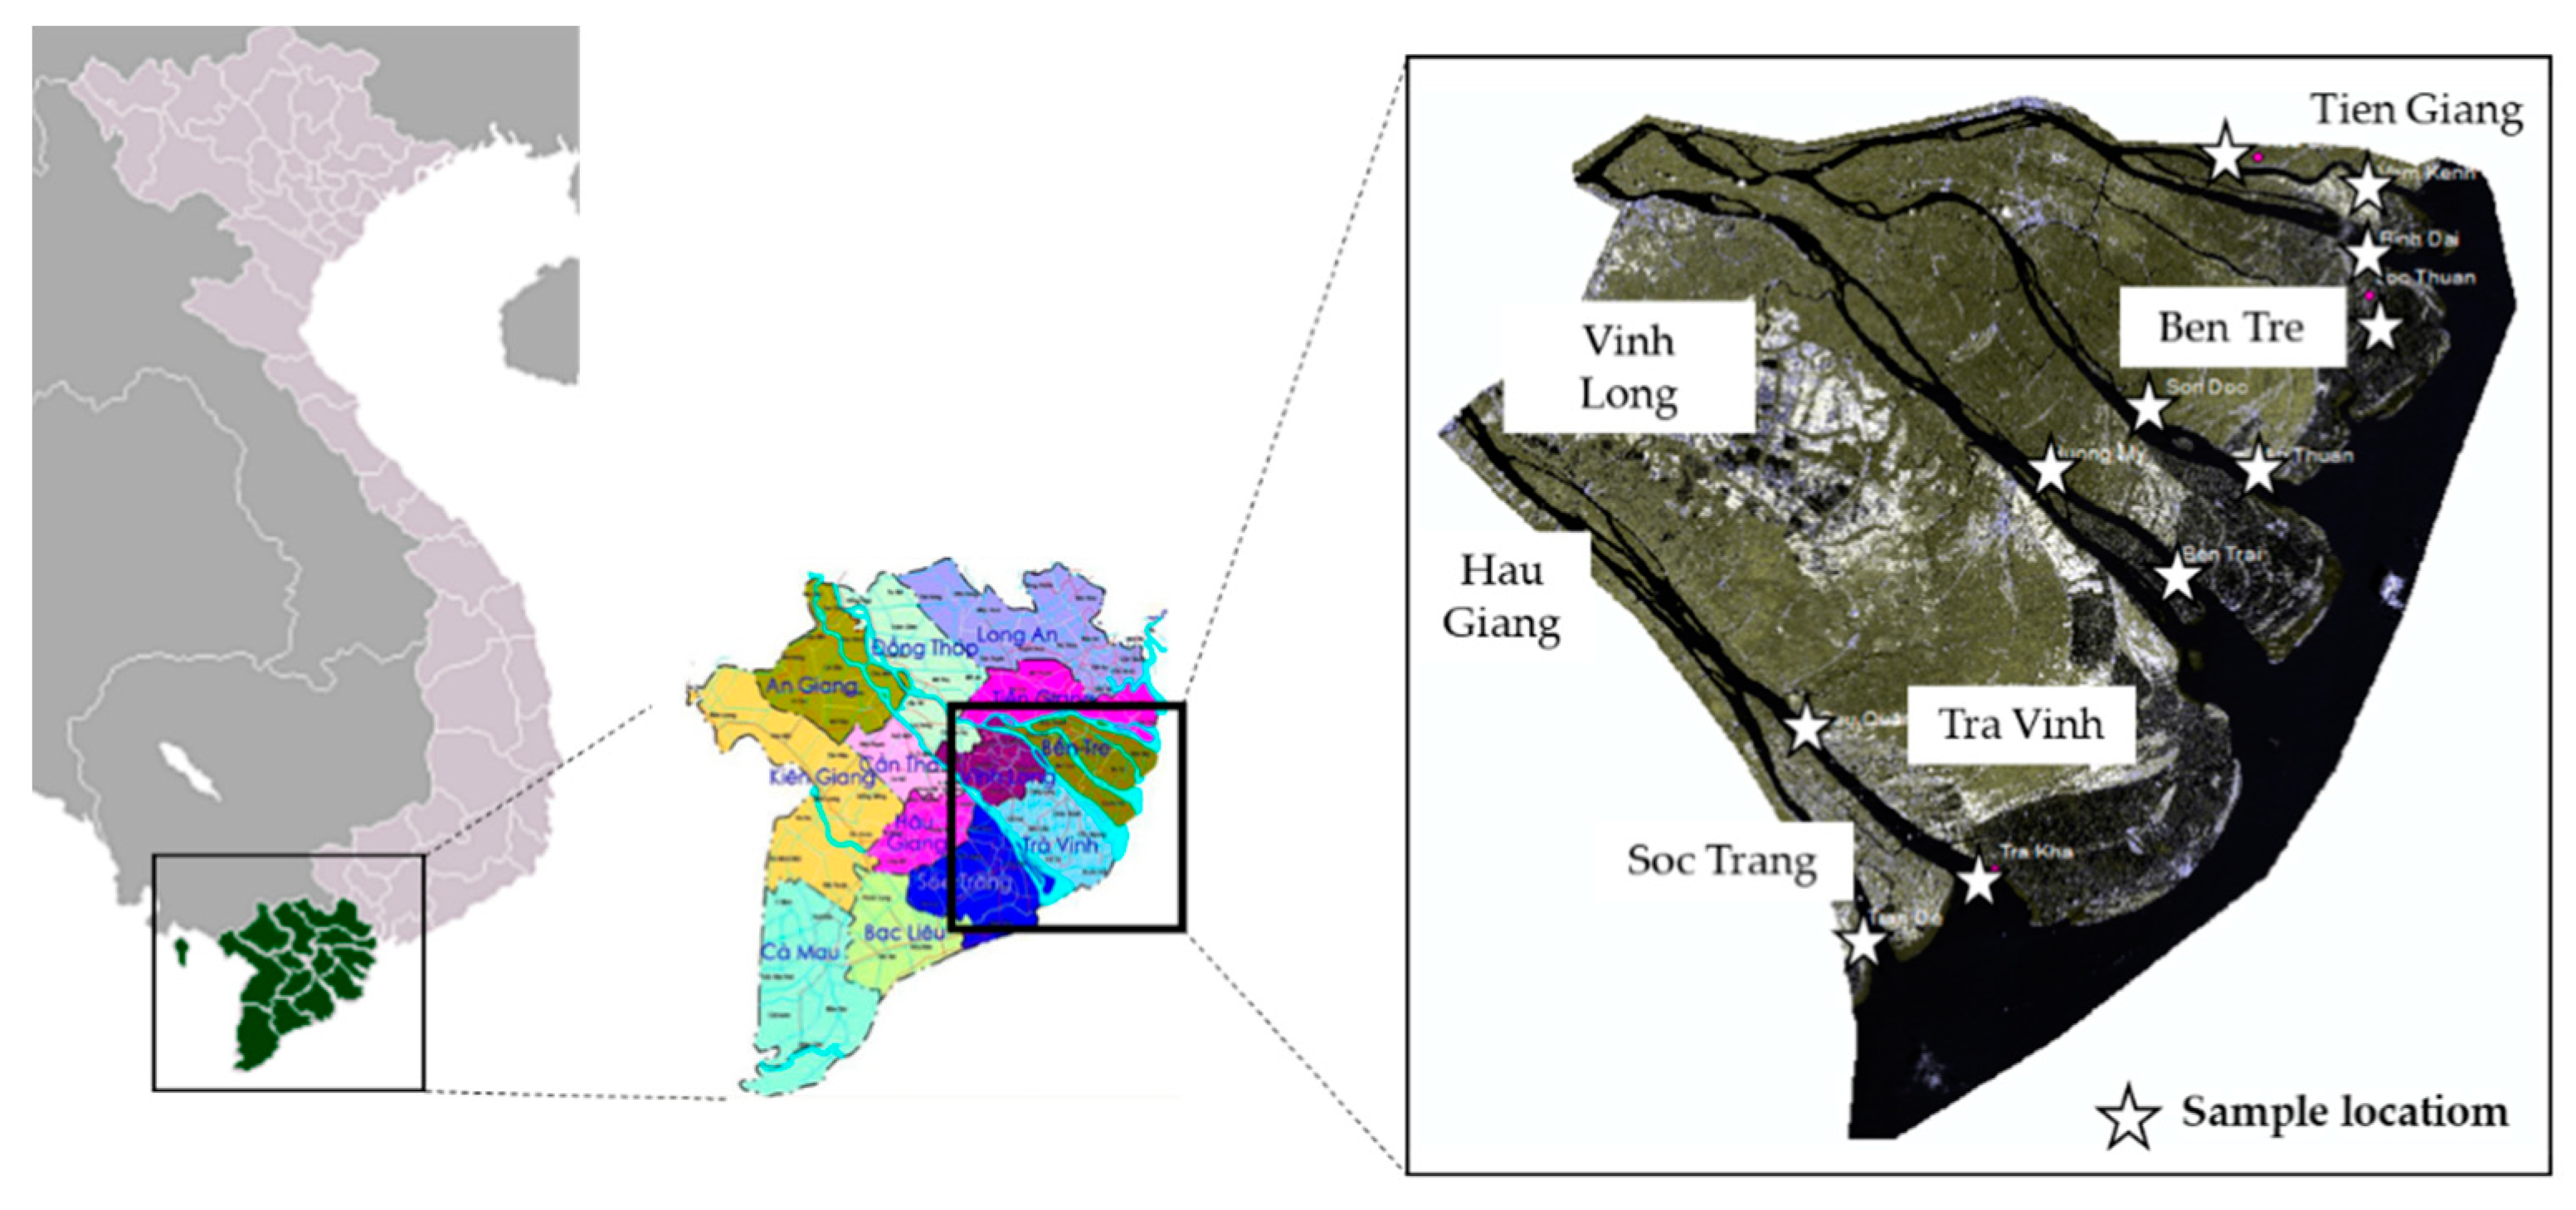
2.1. Study Area

The study area was located in the Mekong Delta of Vietnam, including main estuaries: Cua Tu, Cua Dai, Ba Lai, Ham Luong, Co Chien, Cung Hau, Dinh An, Tran De. The area lies between 105°46′16″ and 106°05′10″ E, 9°18′44″ and 10°21′48″ N. The total area was approximately 8407 km2 (Figure 1).

2.2. Satellite and Ground Measured Data

We used five scenes of Landsat-8 OLI and TIRS multispectral image data for the different dates in 2014 (22 February, 10 March, 26 March, 27 April, 13 May). The size of each scene was 185 km × 180 km. The spatial resolution for each of these spectral bands was 30 m. The satellite data was downloaded from the United States Geological Survey in GeoTIFF format with the Level 1T correction. Level 1T is the standard terrain correction in which systematic radiometric and geometric accuracy is provided using the ground control points and the topographic accuracy is obtained by using the digital elevation model. The scenes of Landsat-8 OLI and TIRS were selected on the basis of the least cloud cover on the sampling days. In total, we used ground measured data at eleven sampling locations of the study area in February 2014—May 2014 to develop and validate models using the planetary reflectance of the scenes of Landsat-8. The sampling locations and the dates for the ground measured data and Landsat-8 scenes are given in Table 1.

2.3. Image Processing

The satellite scenes were processed to make them workable for the purpose of this research. The operations applied for processing are briefly explained in the following sub-sections:

2.3.1. Conversion of Digital Numbers into Spectral Radiance

In the first step, we converted the raw digital numbers of all the Landsat-5 Thematic Mapper (Landsat-5 Thematic Mapper (TM)) images into spectral radiance using Equation (1) as follows:
Lλ = ML × Qcal + AL
where Lλ = spectral radiance at the sensor’s aperture (Wm−2 sr−1 μm−1), Qcal = quantized calibrated pixel value, ML = radiance_mult_band_x, AL = radiance_add_band_x.

2.3.2. Conversion from Spectral Radiance to Planetary Reflectance

In the second step, the spectral radiance was converted into planetary reflectance using Equation (2) as follows:
рλ = (Mр + Qcal + Aр)/cos(θSZ)
where рλ = unitless planetary reflectance, Qcal = quantized calibrated pixel value, Mр = reflectance_mult_band_x, Aр = reflectance_add_band_x, θSZ = solar zenith angle (degree).

2.3.3. Normalized Difference Vegetation Index (NDVI)

We calculated normalized difference vegetation index (NDVI)—a measure of vegetation greenness—using Equation (3) [5] as follow:
NDVI = (рNIRрRed)/(рNIR + рRed)
where рNIR = reflectance of NIR band, рRed = reflectance of red band.
Such NDVI calculations were performed over the study area in all scenes of Landsat-8. The negative NDVI values (between 0 and −1) indicated the presence of water in the pixels whereas positive NDVI values showed possible contamination due to other land uses [6]. In case of a positive NDVI value for any sampling site pixel, we considered the reflectance value of the nearest neighboring water pixel.

2.4. Investigating the Correlation between the Landsat-8 Satellite Image Data and the In-Situ Salinity Measurements

We investigated the correlation between the spectral bands of Landsat-8 images (except the panchromatic and cirrus bands) and the in-situ salinity measurements by calculating the Pearson correlation coefficient (Table 2).
Table 2 shows that the coastal aerosol, blue, green and red bands correlate well with the in-situ salinity measurements (r = 0.68–0.83). Therefore, these spectral bands can be used to develop the model for water salinity.
The principal component analysis technique is an algorithm that creates the principal components (PCs) to remove the overlap data on the image, highlighting the spectral characteristics of different objects on the Earth’s surface [7]. We also investigated the correlation between the principal components analyzed from the original Landsat-8 image bands (bands 1, 2, 3 and 4) and the in-situ salinity measurements. The first principal component correlated most strongly with the in-situ salinity measurements (r = 0.86) (Table 3).

2.5. Developing Models of Water Salinity from Planetary Reflectance of Landsat-8 Data

We used regression analysis technique to develop eight individual empirical models to determine salinity as a function of the blue, green and red bands, as well as PC1. We used 40 data records (Landsat-8 as well as the ground data) for the development of the models to obtain salinity from the planetary reflectance. The remaining 15 data records were used to validate the best selected models by calculating the root mean square error (RMSE). In all these models, the in-situ salinity measurements were the dependent variable, whereas the spectral bands and PC1 band were the independent variables. The strength of the correlations between the planetary reflectance and in situ salinity for the development and validation of the models were obtained based on the co-efficient of determination (R2) and RMSE. On the basis of R2 values, RMSE, we identified the significant empirical models for salinity.

2.6. Spatial Analysis for the Study Area

The NDVI was calculated for the study area to extract the pixels with water and remove the pixels contaminated with other land use types. We selected the most suitable empirical models for salinity on the basis of R2 values. The selected salinity model was applied on the scenes of Landsat-8 to obtain the spatial distribution along the study area. The salinity values were divided into four classes which are: (1) Low salinity: less than 4 g/L, (2) Moderate salinity: 4–7 g/L; (3) High salinity: 7–10 g/L, (4) Severely salinity: greater than 10 g/L.

3. Results and Discussion

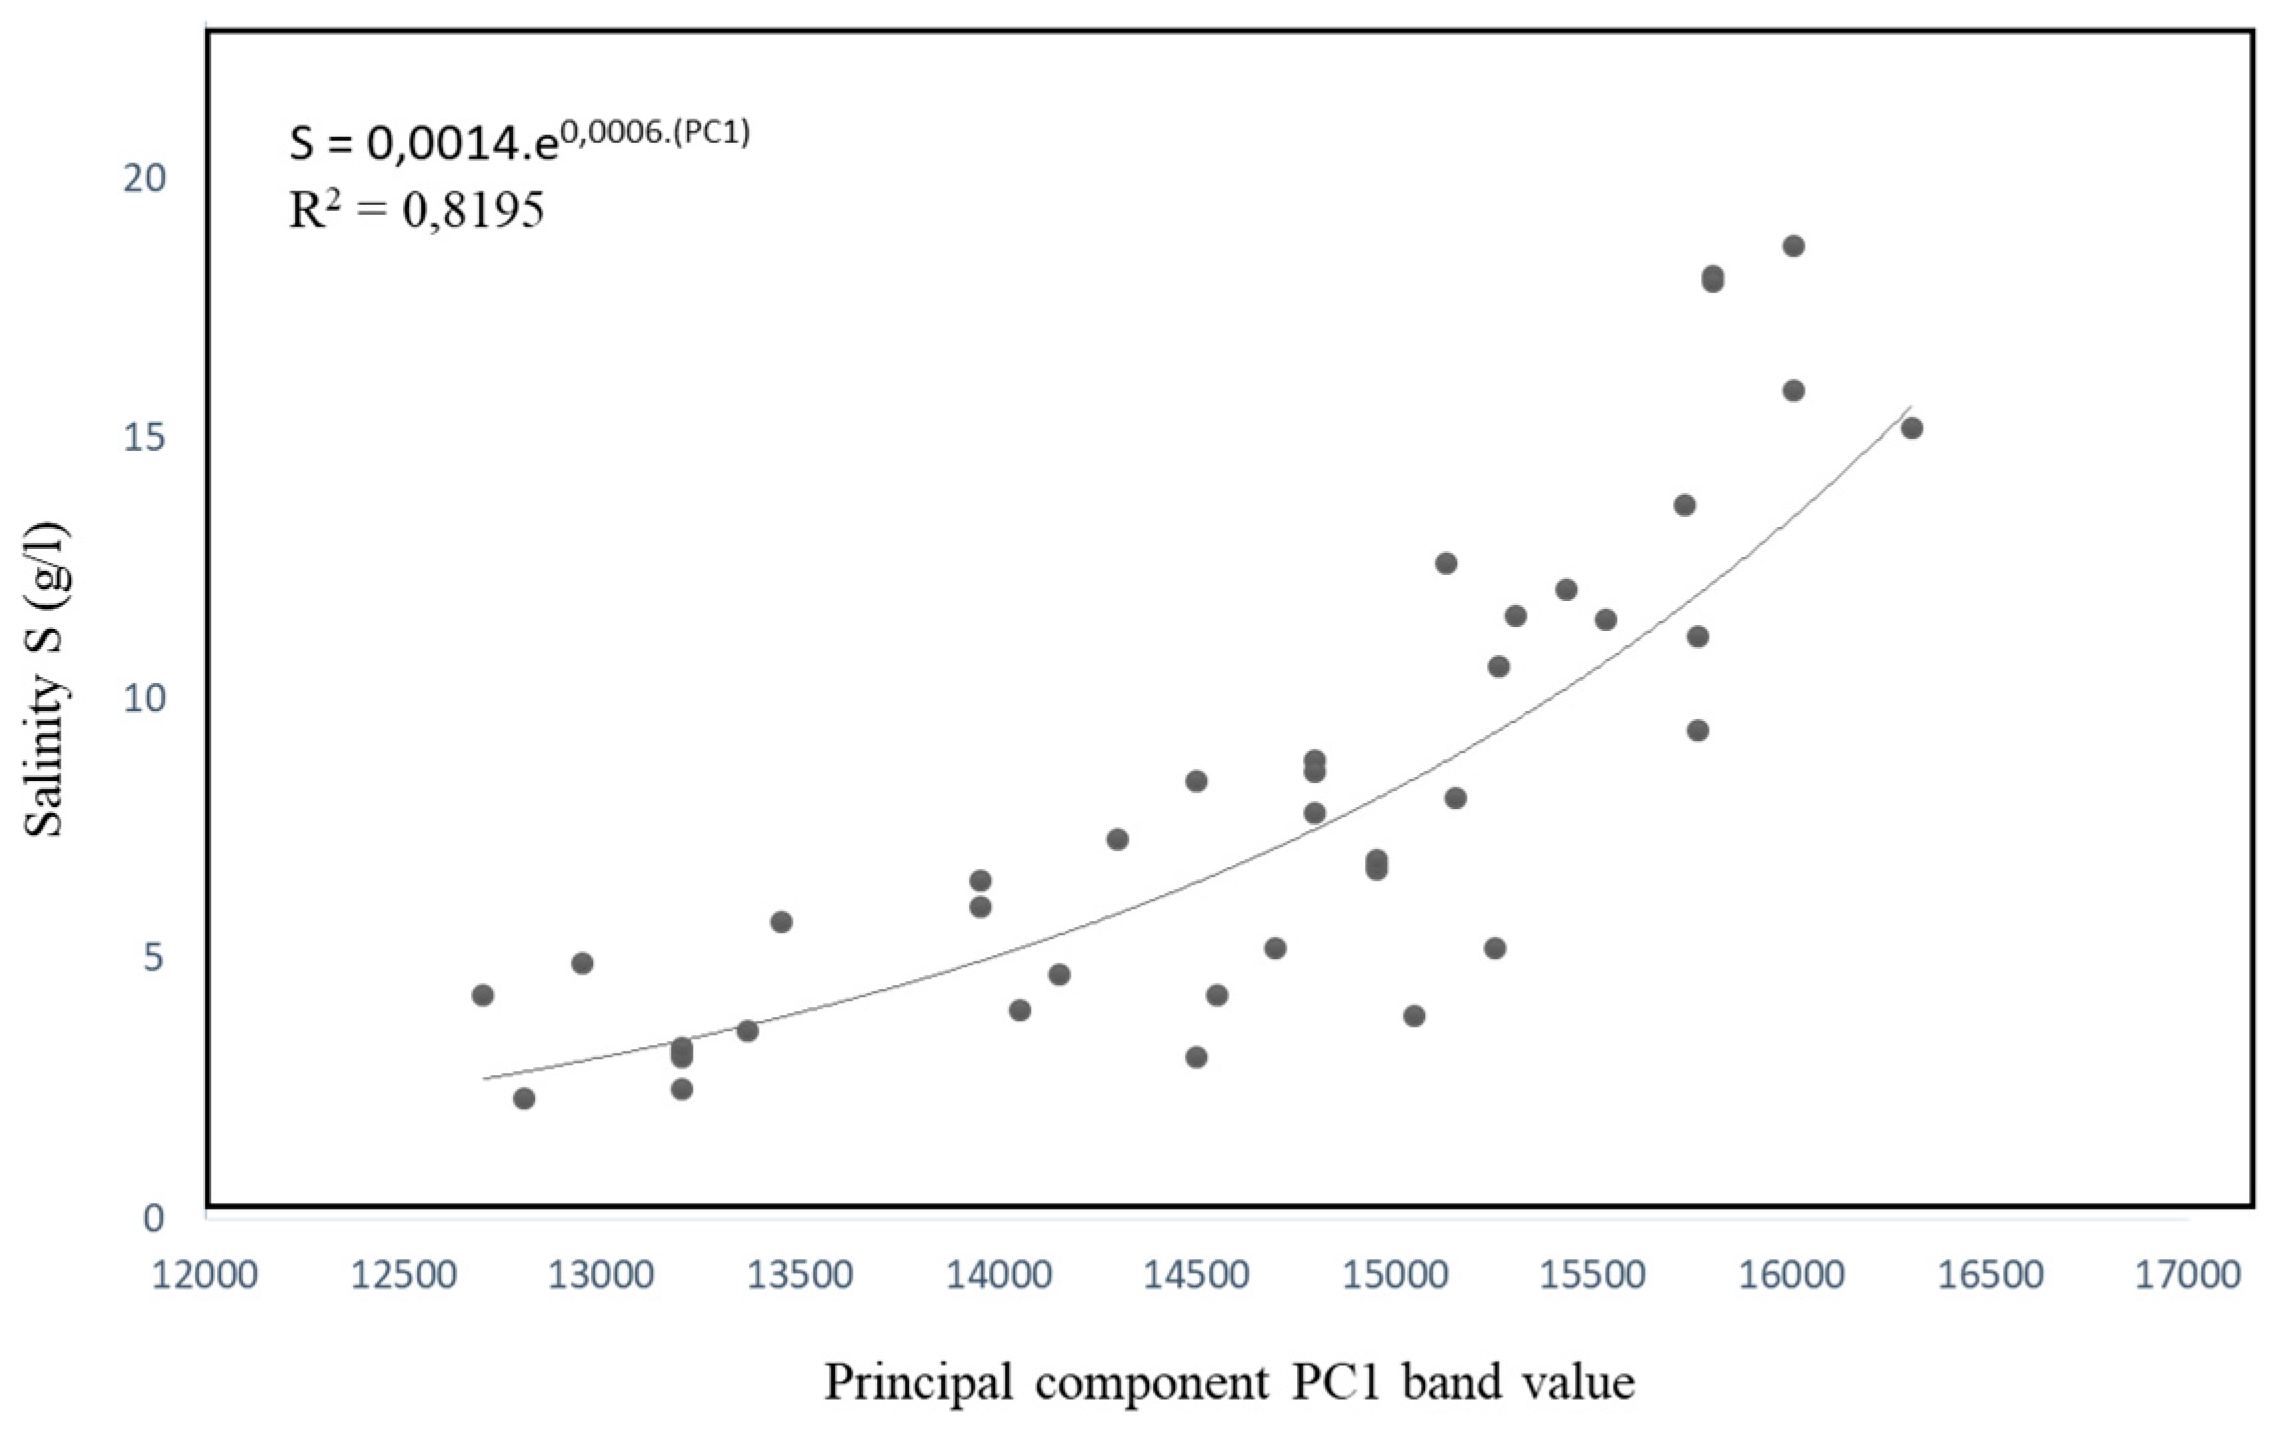
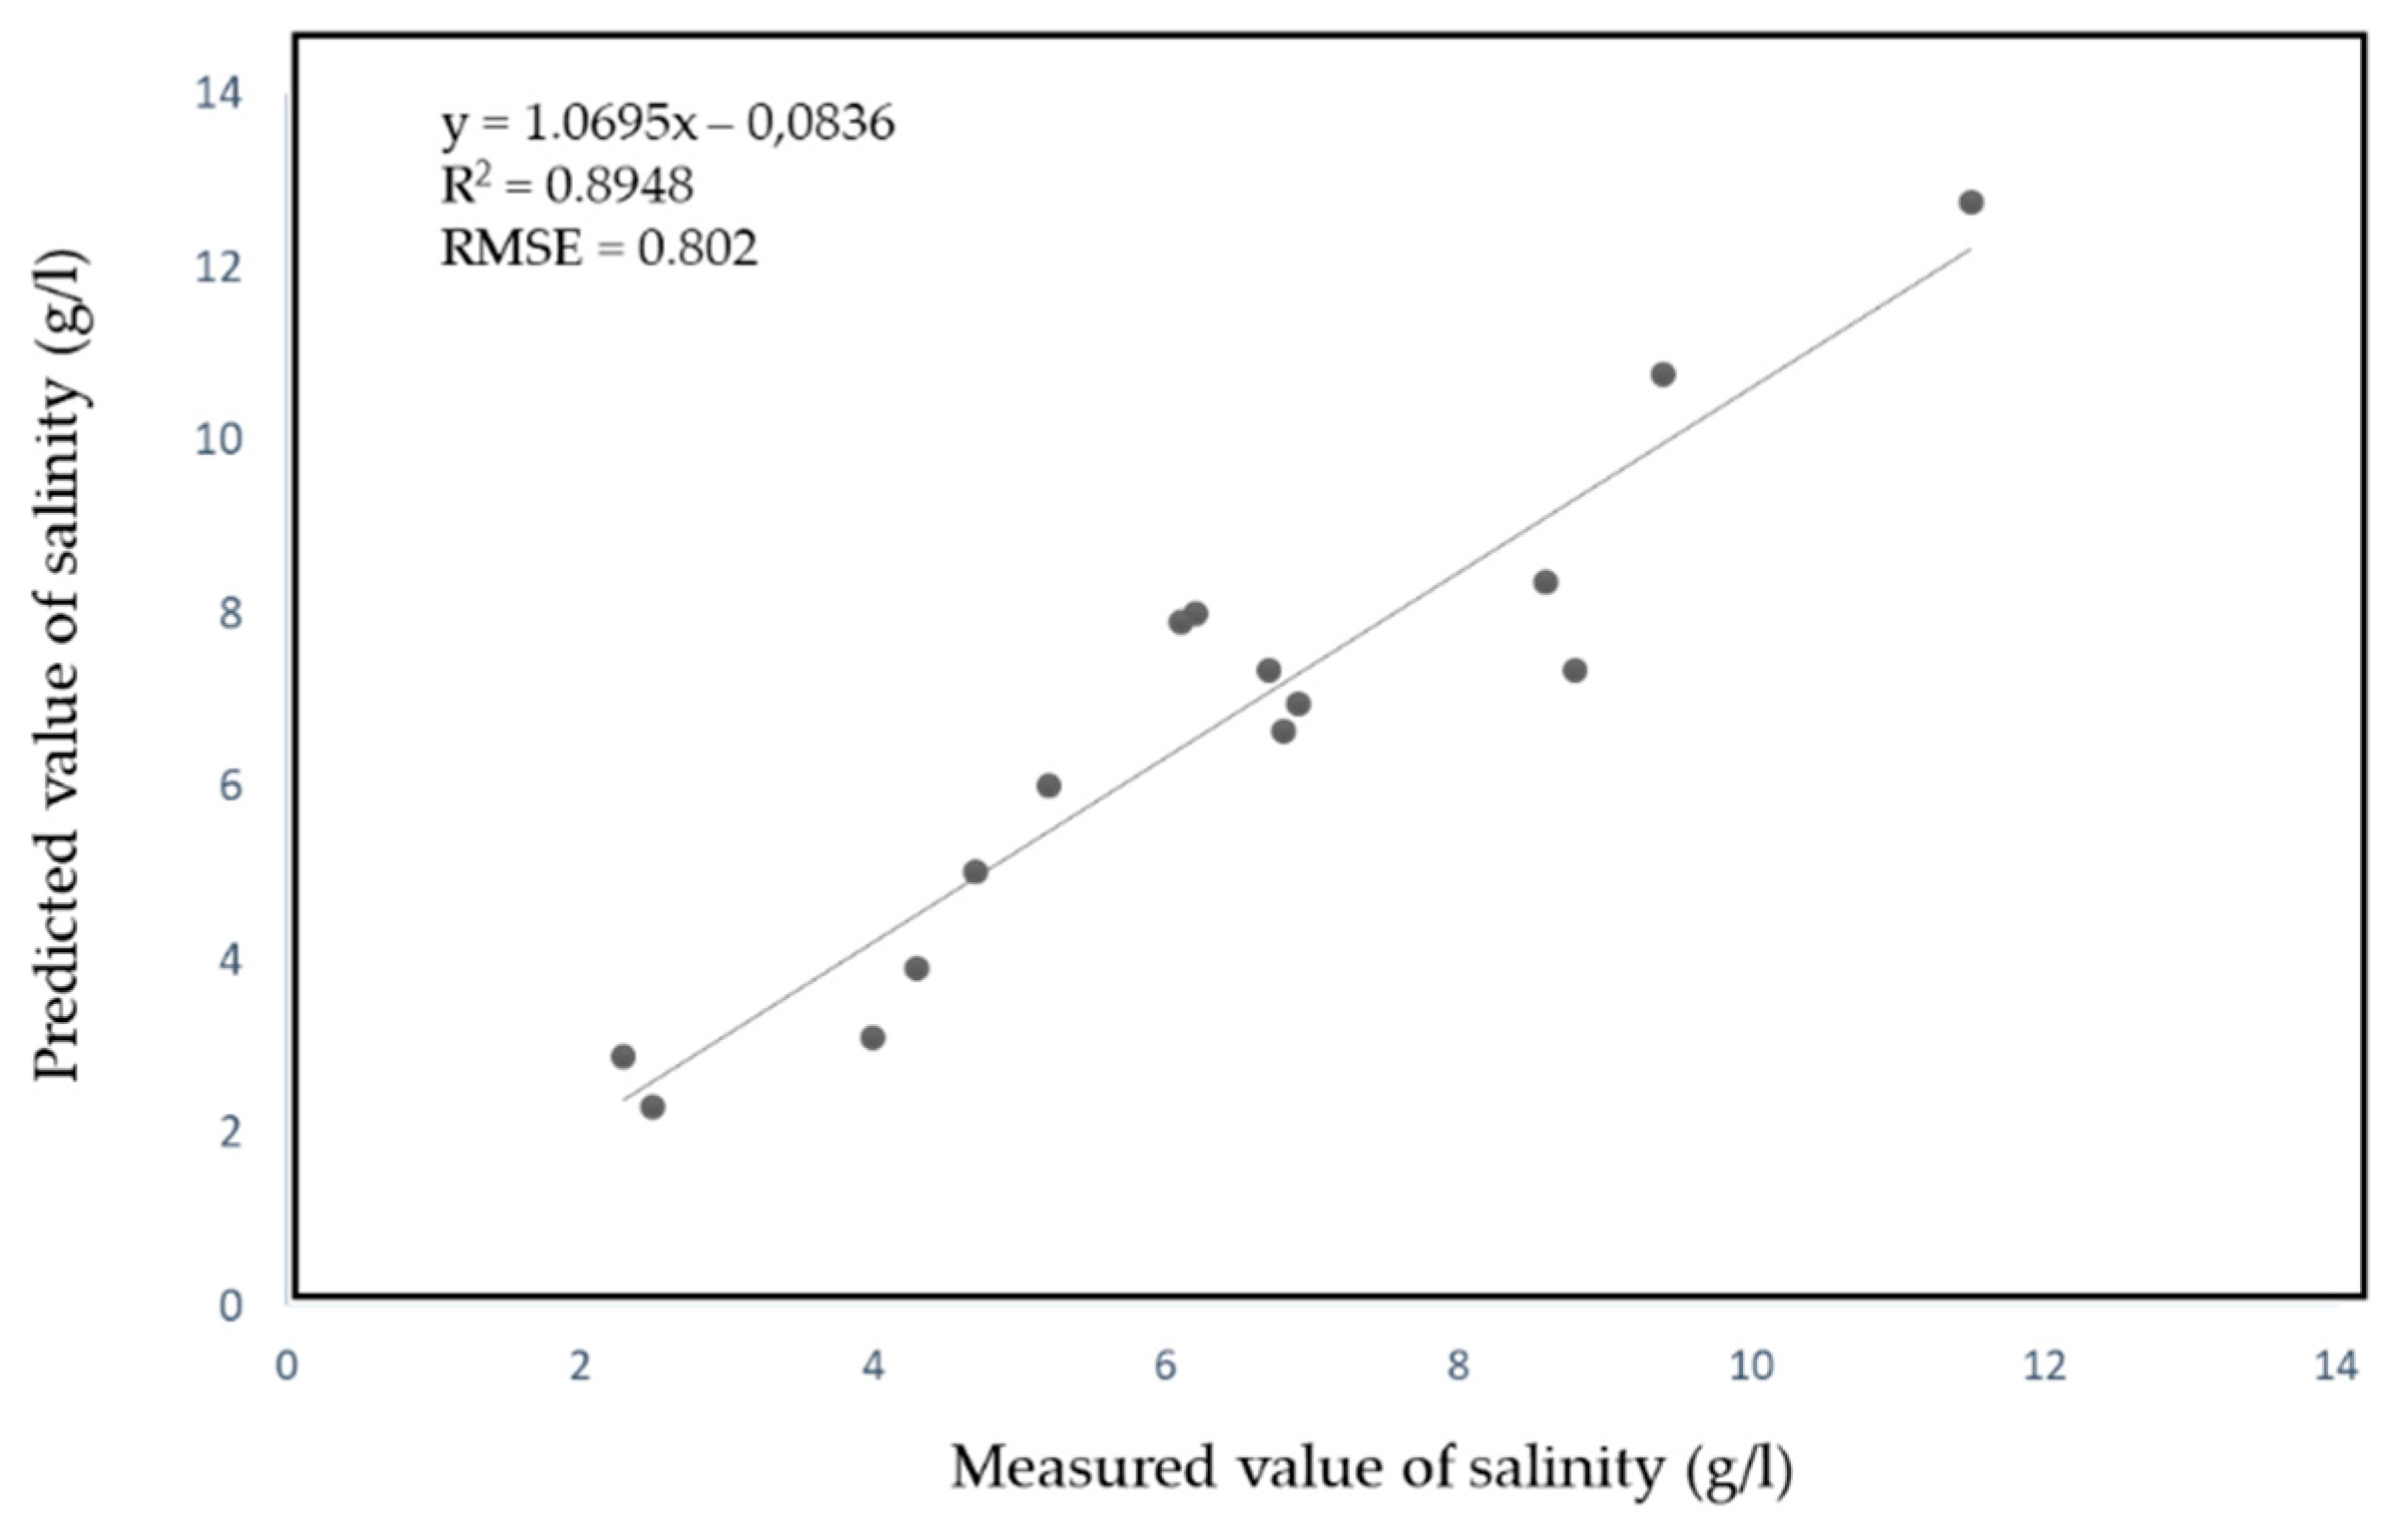
3.1. Empirical Models for Determining Salinity Classes

We developed eight empirical models for determining salinity as given in Table 4. These empirical models could be used to obtain the spatial distribution of salinity using the planetary reflectance of bands. Among these significant models, R2 was higher (0.73–0.82) for the models with the exponential function (model number one, two, three and five in Table 4), whereas it was lower (0.62–0.74) in the models with the linear function (model number four, six, seven and eight in Table 4). The best model was the use of the principal component PC1 (model number one in Table 4).
The scatter plot of model number one is shown in Figure 2. This figure shows that the selected model showed the best correlation with the exponential function of the principal component PC1 band and the ground measured data with R2 = 0.8195 and RMSE = 1.592. Figure 3 revealed that the predicted values of salinity matched the observed ones. The value of the coefficient of determination computed for the regression between measured and predicted salinity was 0.8948 and RMSE = 0.802. This shows that both field and calculated salinity data are in good agreement, indicating a good fitting.

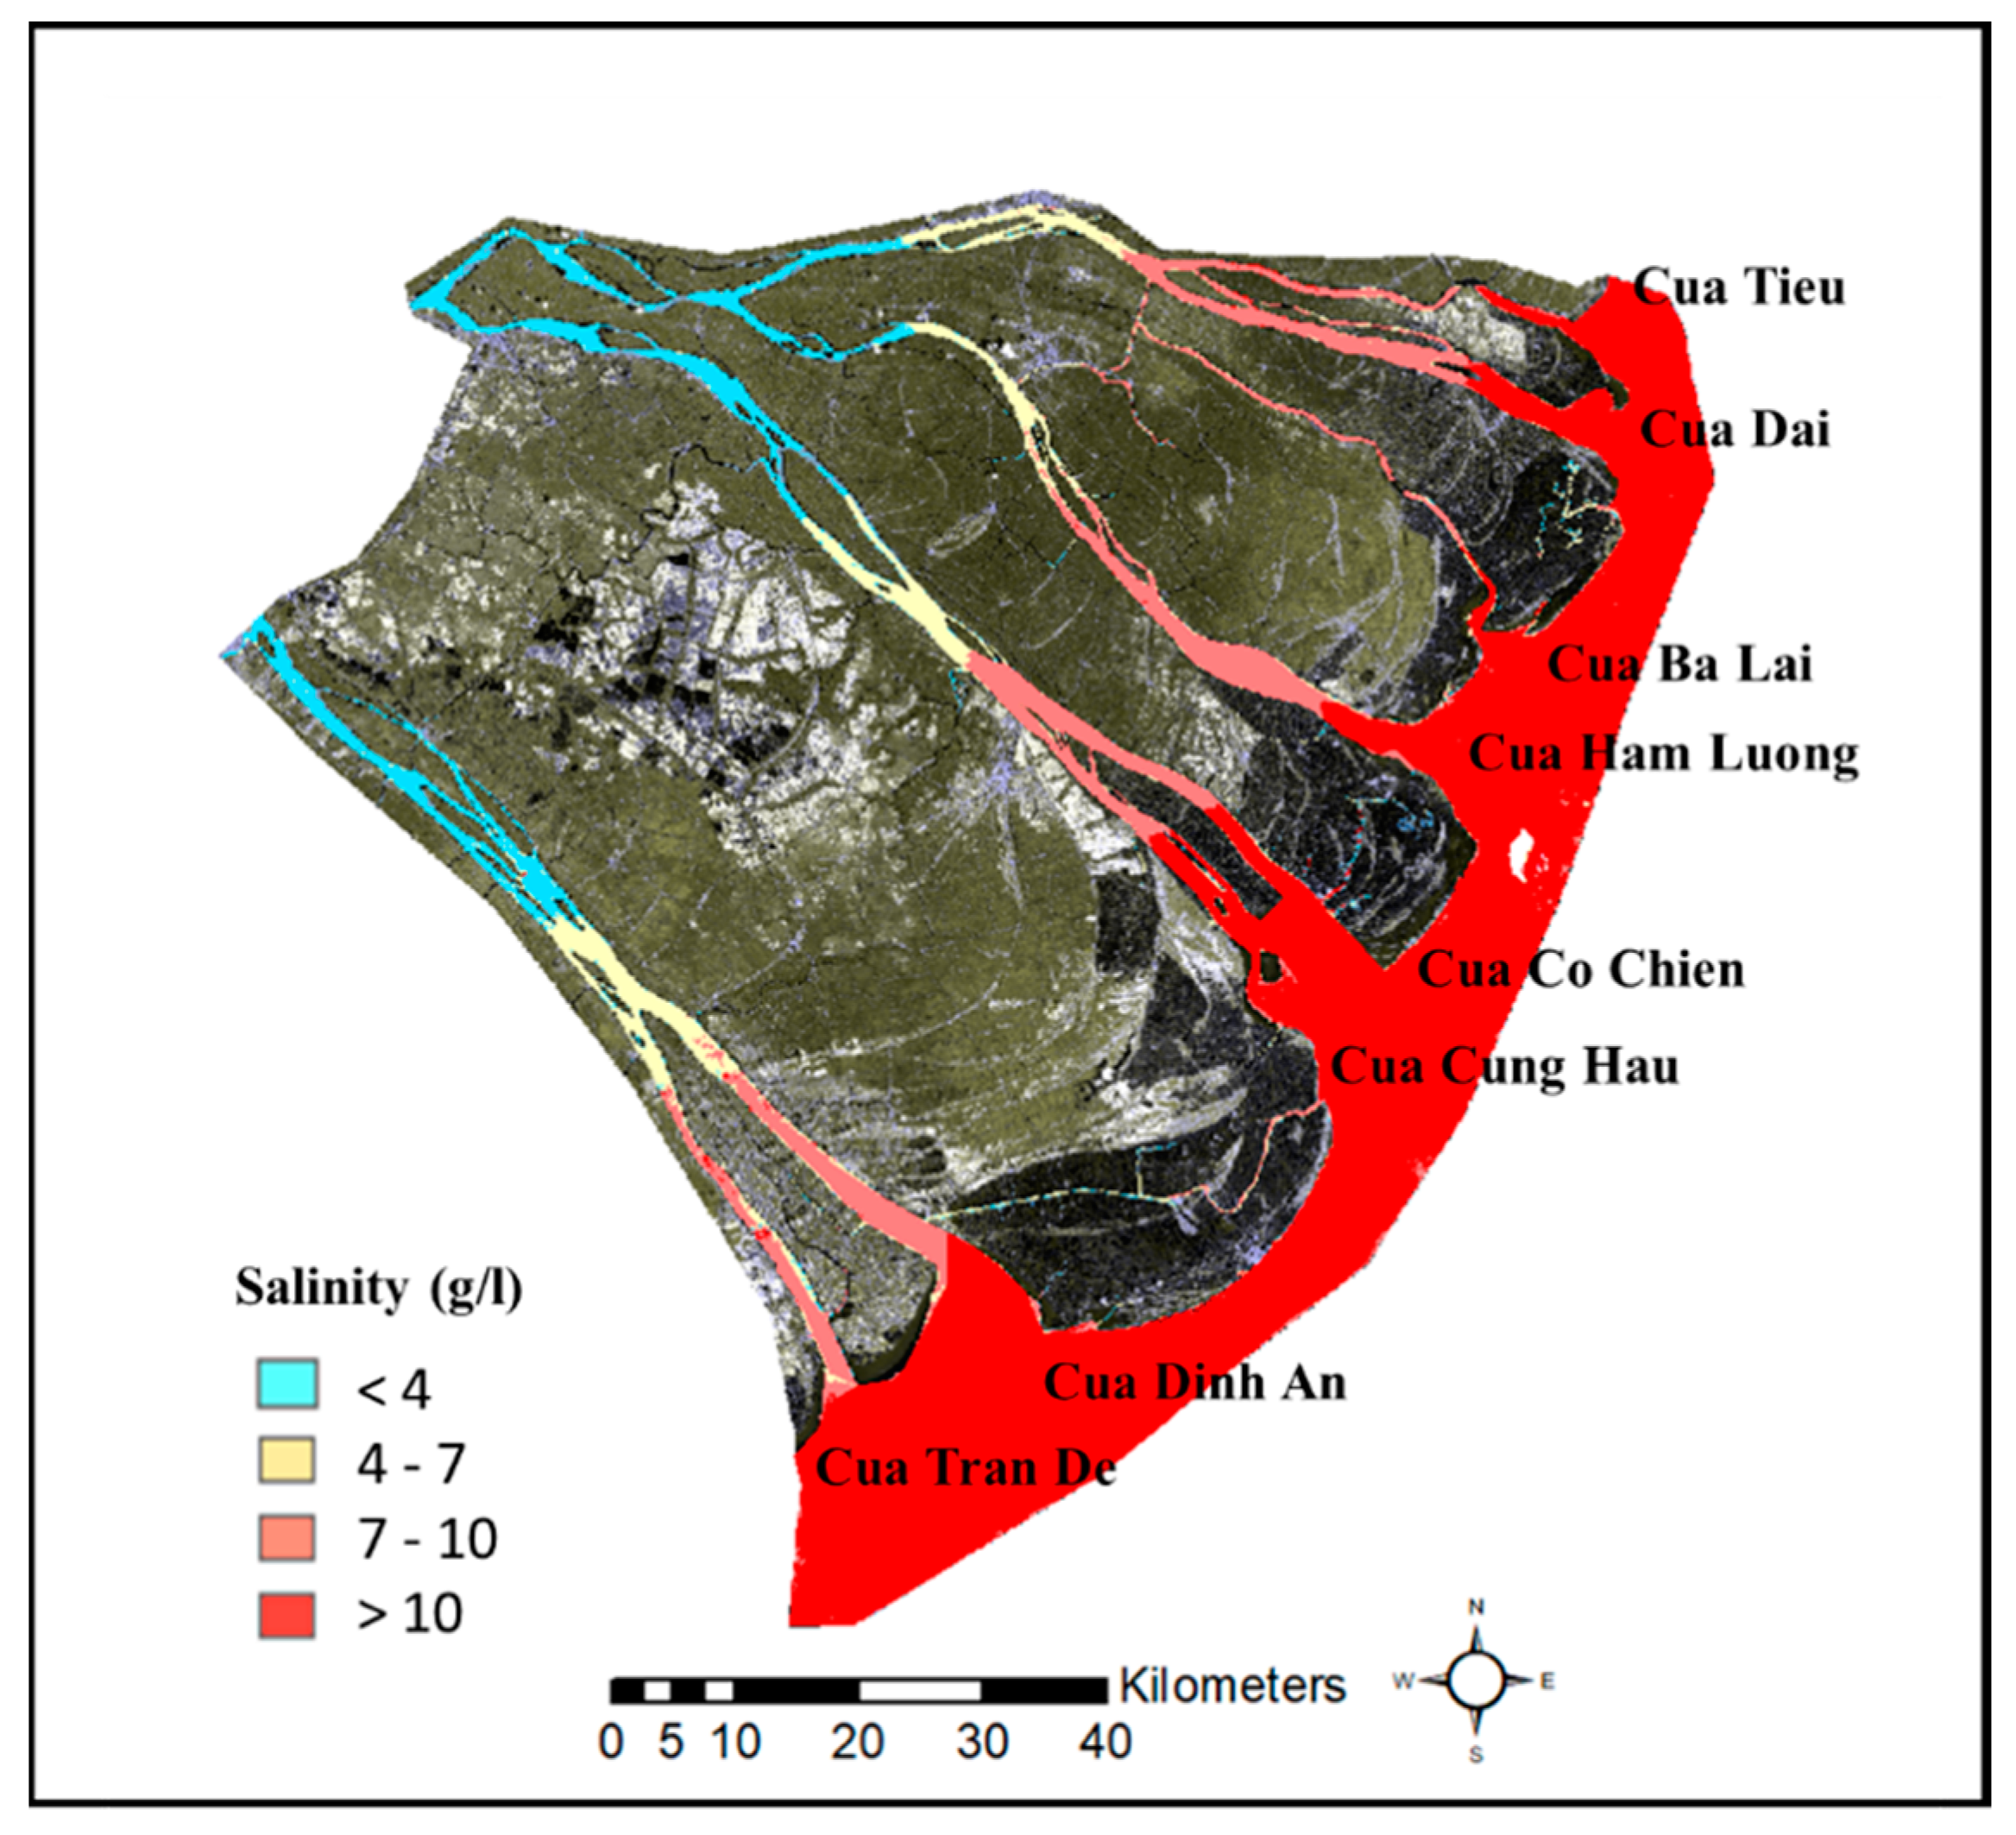
3.2. Application of Model for Spatial Analysis

We applied the best model (model number one in Table 4) to quantify the water salinity into the spatial distribution map for the study area. Figure 4 shows the four salinity classes which are: (1) Low salinity: less than 4 g/L, (2) Moderate salinity: 4–7 g/L; (3) High salinity: 7–10 g/L, (4) Severely salinity: greater than 10 g/L in February 2014.
In February 2014, the length of the saline intrusion of 4 g/L salt boundary into the estuaries Cua Tieu, Cua Dai and Cua Ham Luong is more than 50 km. Table 5 shows the salt intrusion length of the 4 g/L salt boundary into the inner field from eight large estuaries in the study area.

4. Conclusions

The purpose of this research was to use in-situ salinity measurements combined with Landsat-8 OLI and TIRS data to derive water salinity in the Mekong River Delta of Vietnam for sustainable management. Correlation and regression models were developed between each of the salinity measurements and the reflectance of image data. The current research indicated that despite the variation in statistical response, a good correlation existed between selected salinity and Landsat-8 data in the Mekong River Delta of Vietnam. The efficiency of the proposed algorithms were investigated based on the values of determining coefficient and RMSE. As there was little variation between Landsat-8 predicted values and the measured concentrations, this research proved that Landsat-8 data were useful in quantifying water salinity dynamics and preparing digital maps. The models and methods used in this research for the retrieval of water salinity from Landsat-8 are promising and can be frequently applied to the Mekong Delta for sustainable water quality monitoring.

Funding

The authors would like to thank Viet Nam Nationtal University Ho Chi Minh City for providing grants to do this research (Grant Number: TNCS-MTTN-2017-11 and KHCN-TNB.ĐT/14-19/C03).

References

  1. Binh, N.; Vulnerability and Adaptation to Salinity Intrusion in the Coastal Province of Tra Vinh. Disaster Risk Reduct. Clim. Chang. Adapt. 2010. Available online: https://d-nb.info/1077388489/34 (accessed on 27 July 2018).
  2. Khalil, T. Integrated Field Study, Remote Sensing and GIS Approach for Assessing and Monitoring Some Chemical Water Quality Parameters in Bardawil Lagoon, Egypt. Int. J. Innov. Res. Sci. Eng. Technol. 2016, 5, 14656–14669. [Google Scholar]
  3. Choubey, V.K. Monitoring surface water conductivity with Indian remote sensing satellite data: A case study from central India. Hydrol. Chem. Biol. Process. Transform. Transp. Contam. Aquat. Environ. 1994, 219, 317–326. [Google Scholar]
  4. Abdelmalik, K. Role of statistical remote sensing for Inland water quality parameters prediction. Egypt. J. Remote Sens. Space Sci. 2016, 1–8. [Google Scholar] [CrossRef]
  5. Tucker, C.J. Red and Photographic Infrared Linear Combinations for Monitoring vegetation. Remote Sens. Environ. 1979, 8, 127–150. [Google Scholar] [CrossRef]
  6. Weier, J.; Herring, D. Measuring vegetation (NDVI&EVI). NASA Earth Obs. 1999. Available online: https://earthobservatory.nasa.gov/Features/MeasuringVegetation (accessed on 27 July 2018).
  7. Howari, F.M. Spectral Properties of Salt Crusts Formed on Saline Soils. J. Environ. 2002, 31, 1453–1461. [Google Scholar] [CrossRef] [PubMed]
Figure 1. Study area and sample location.
Proceedings 02 00565 g001
Figure 2. Model for obtaining salinity using the principal component PC1 band of the study area.
Proceedings 02 00565 g002
Figure 3. Measured against predicted value of salinity at the study area.
Proceedings 02 00565 g003
Figure 4. Map of salinity distribution in the study area (February 2014).
Proceedings 02 00565 g004
Table 1. Sample location in the study area.
No.NameRiverProvinceLongitudeLatitude
1Hoa BinhCua TieuTien Giang106°36′ E10°18′ N
2Vam KenhCua TieuTien Giang106°43′ E10°16′ N
3Binh DaiCua DaiBen Tre106°43′ E10°12′ N
4Loc ThuanCua DaiBen Tre106°43′ E10°10′ N
5Son DocHam LuongBen Tre106°30′ E10°03′ N
6Huong MyCung HauBen Tre106°23′ E9°59′ N
7An ThuanHam LuongBen Tre106°36′ E9°59′ N
8Ben TraiCo ChienBen Tre106°31′ E9°53′ N
9Cau QuanHauTra Vinh106°09′ E9°43′ N
10Tra KhaHauTra Vinh106°20′ E9°35′ N
11Tran DeCua Tran DeSoc Trang106°12′ E9°31′ N
Table 2. Pearson correlation coefficient (r) between the spectral bands of Landsat-8 images (except the panchromatic and cirrus bands) and the in-situ salinity measurements.
Pearson Correlation Coefficient (r)
Band 1—Coastal Aerosol0.67790
Band 2—Blue0.785104
Band 3—Green0.81233
Band 4—Red0.82786
Band 5—Near Infrared (NIR)−0.58903
Band 6—Short-Wave Infrared 1 (SWIR1)−0.4972
Band 7— Short-Wave Infrared 2 (SWIR2)−0.28816
Band 10—Thermal Infrared 1 (TIR1)−0.46747
Band 11—Thermal Infrared 2 (TIR2)−0.36758
Table 3. Pearson correlation coefficient (r) between the principal components (PCs) and the in-situ salinity measurements.
Pearson Correlation Coefficient (r)
PC10.860305
PC20.562152
PC3−0.503505
PC4−0.26186
Table 4. Models developed for water salinity for the study area using the spectral bands (blue, green, red) and the principal component PC1 of Landsat-8 image data.
Model No.Model 1R2RMSE
1S = 0.0014.e0.0006.(PC1)0.81951.592
2S = 0.0001.e0.0011.(G)0.78592.029
3S = 0.0131.e0.0007.(R)0.75102.073
4S = 0.0042.(PC1) − 54.0150.74012.317
5S = 0.00001.e0.0012.(B)0.72692.651
6S = 0.0053.(R) − 41.8890.68542.761
7S = 0.0081.(G) − 74.60.65993.601
8S = 0.0095.(B) − 94.1860.61644.081
1 S = Salinity value, G = green band, B = blue band, R = red band, PC1 = principal component band 1. R2 = coefficient of determination. RMSE = root mean square error.
Table 5. The length of the saline intrusion of 4 g/L salt boundary into the large estuaries in the study area (February 2014).
EstuariesLength of Saline Intrusion
Cua Tieu52 km
Cua Dai56 km
Cua Ba Lai47 km
Cua Ham Luong50 km
Cua Co Chien47 km
Cua Cung Hau48 km
Cua Dinh An38 km
Cua Tran De43 km
Publisher’s Note: MDPI stays neutral with regard to jurisdictional claims in published maps and institutional affiliations.

