Alluvial Water Source Capacity under the Climate Change and Other Impacts—Case Study of the Pek River in Serbia †

Abstract
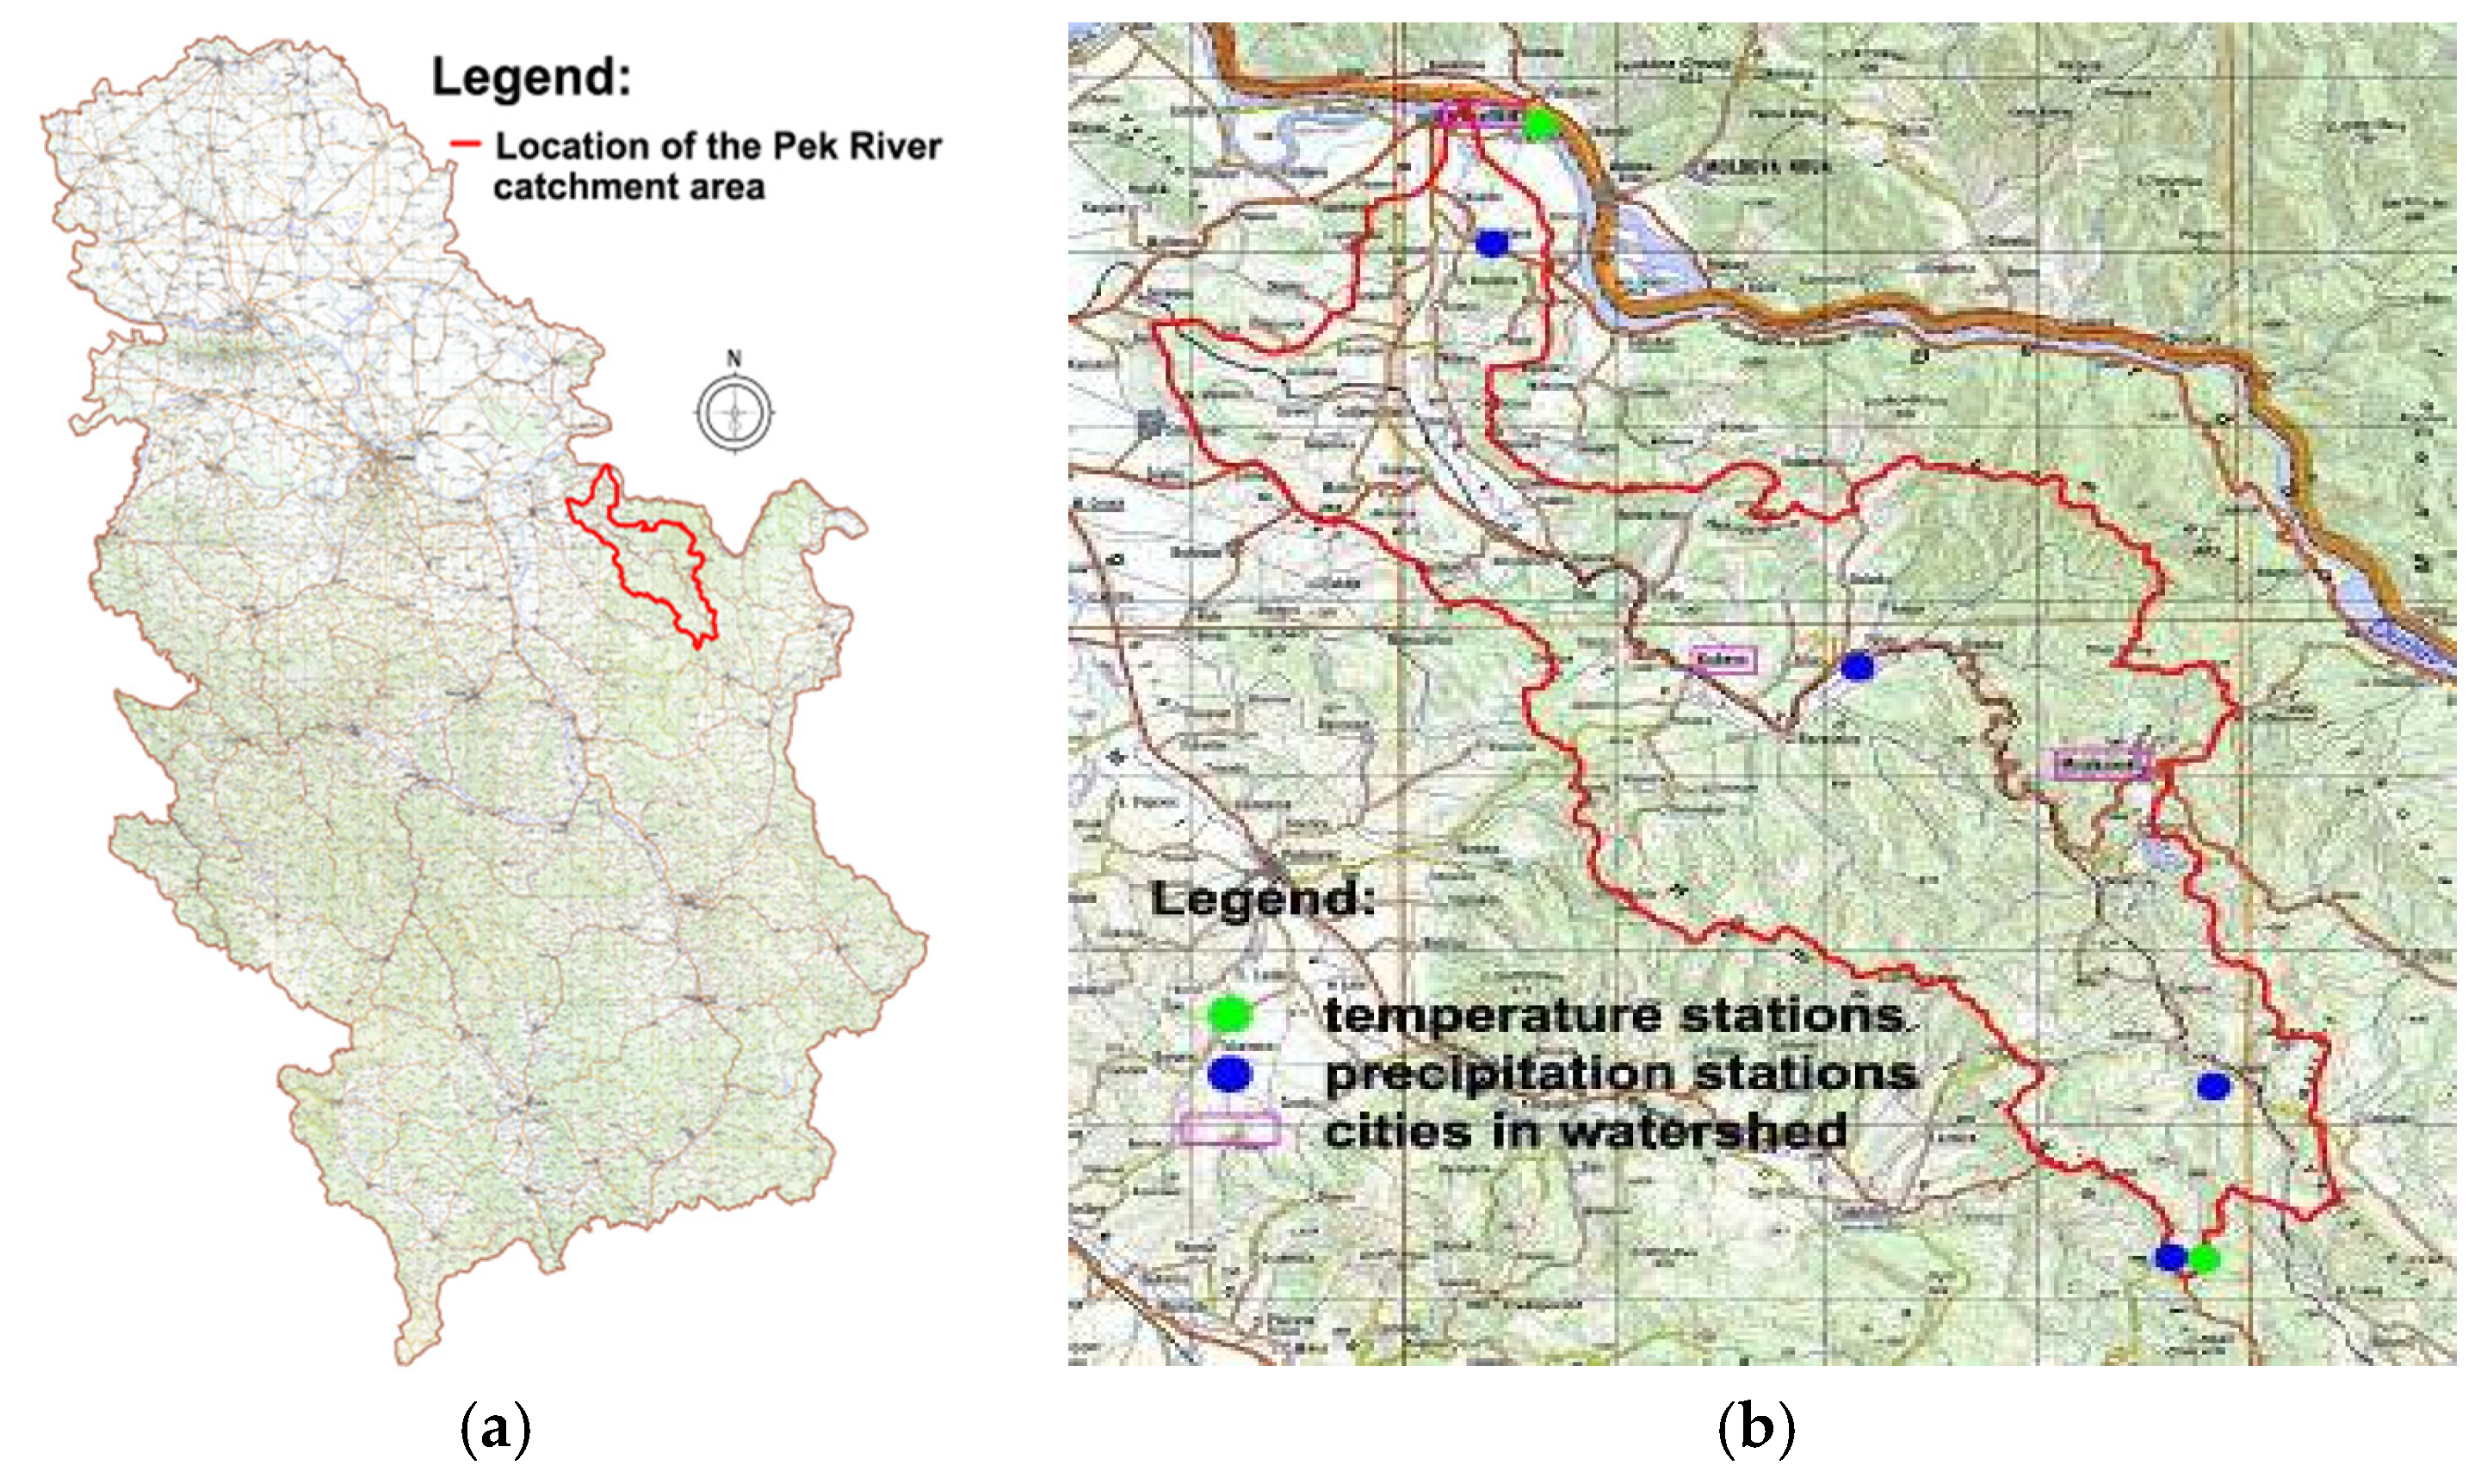
:1. Introduction and Present State
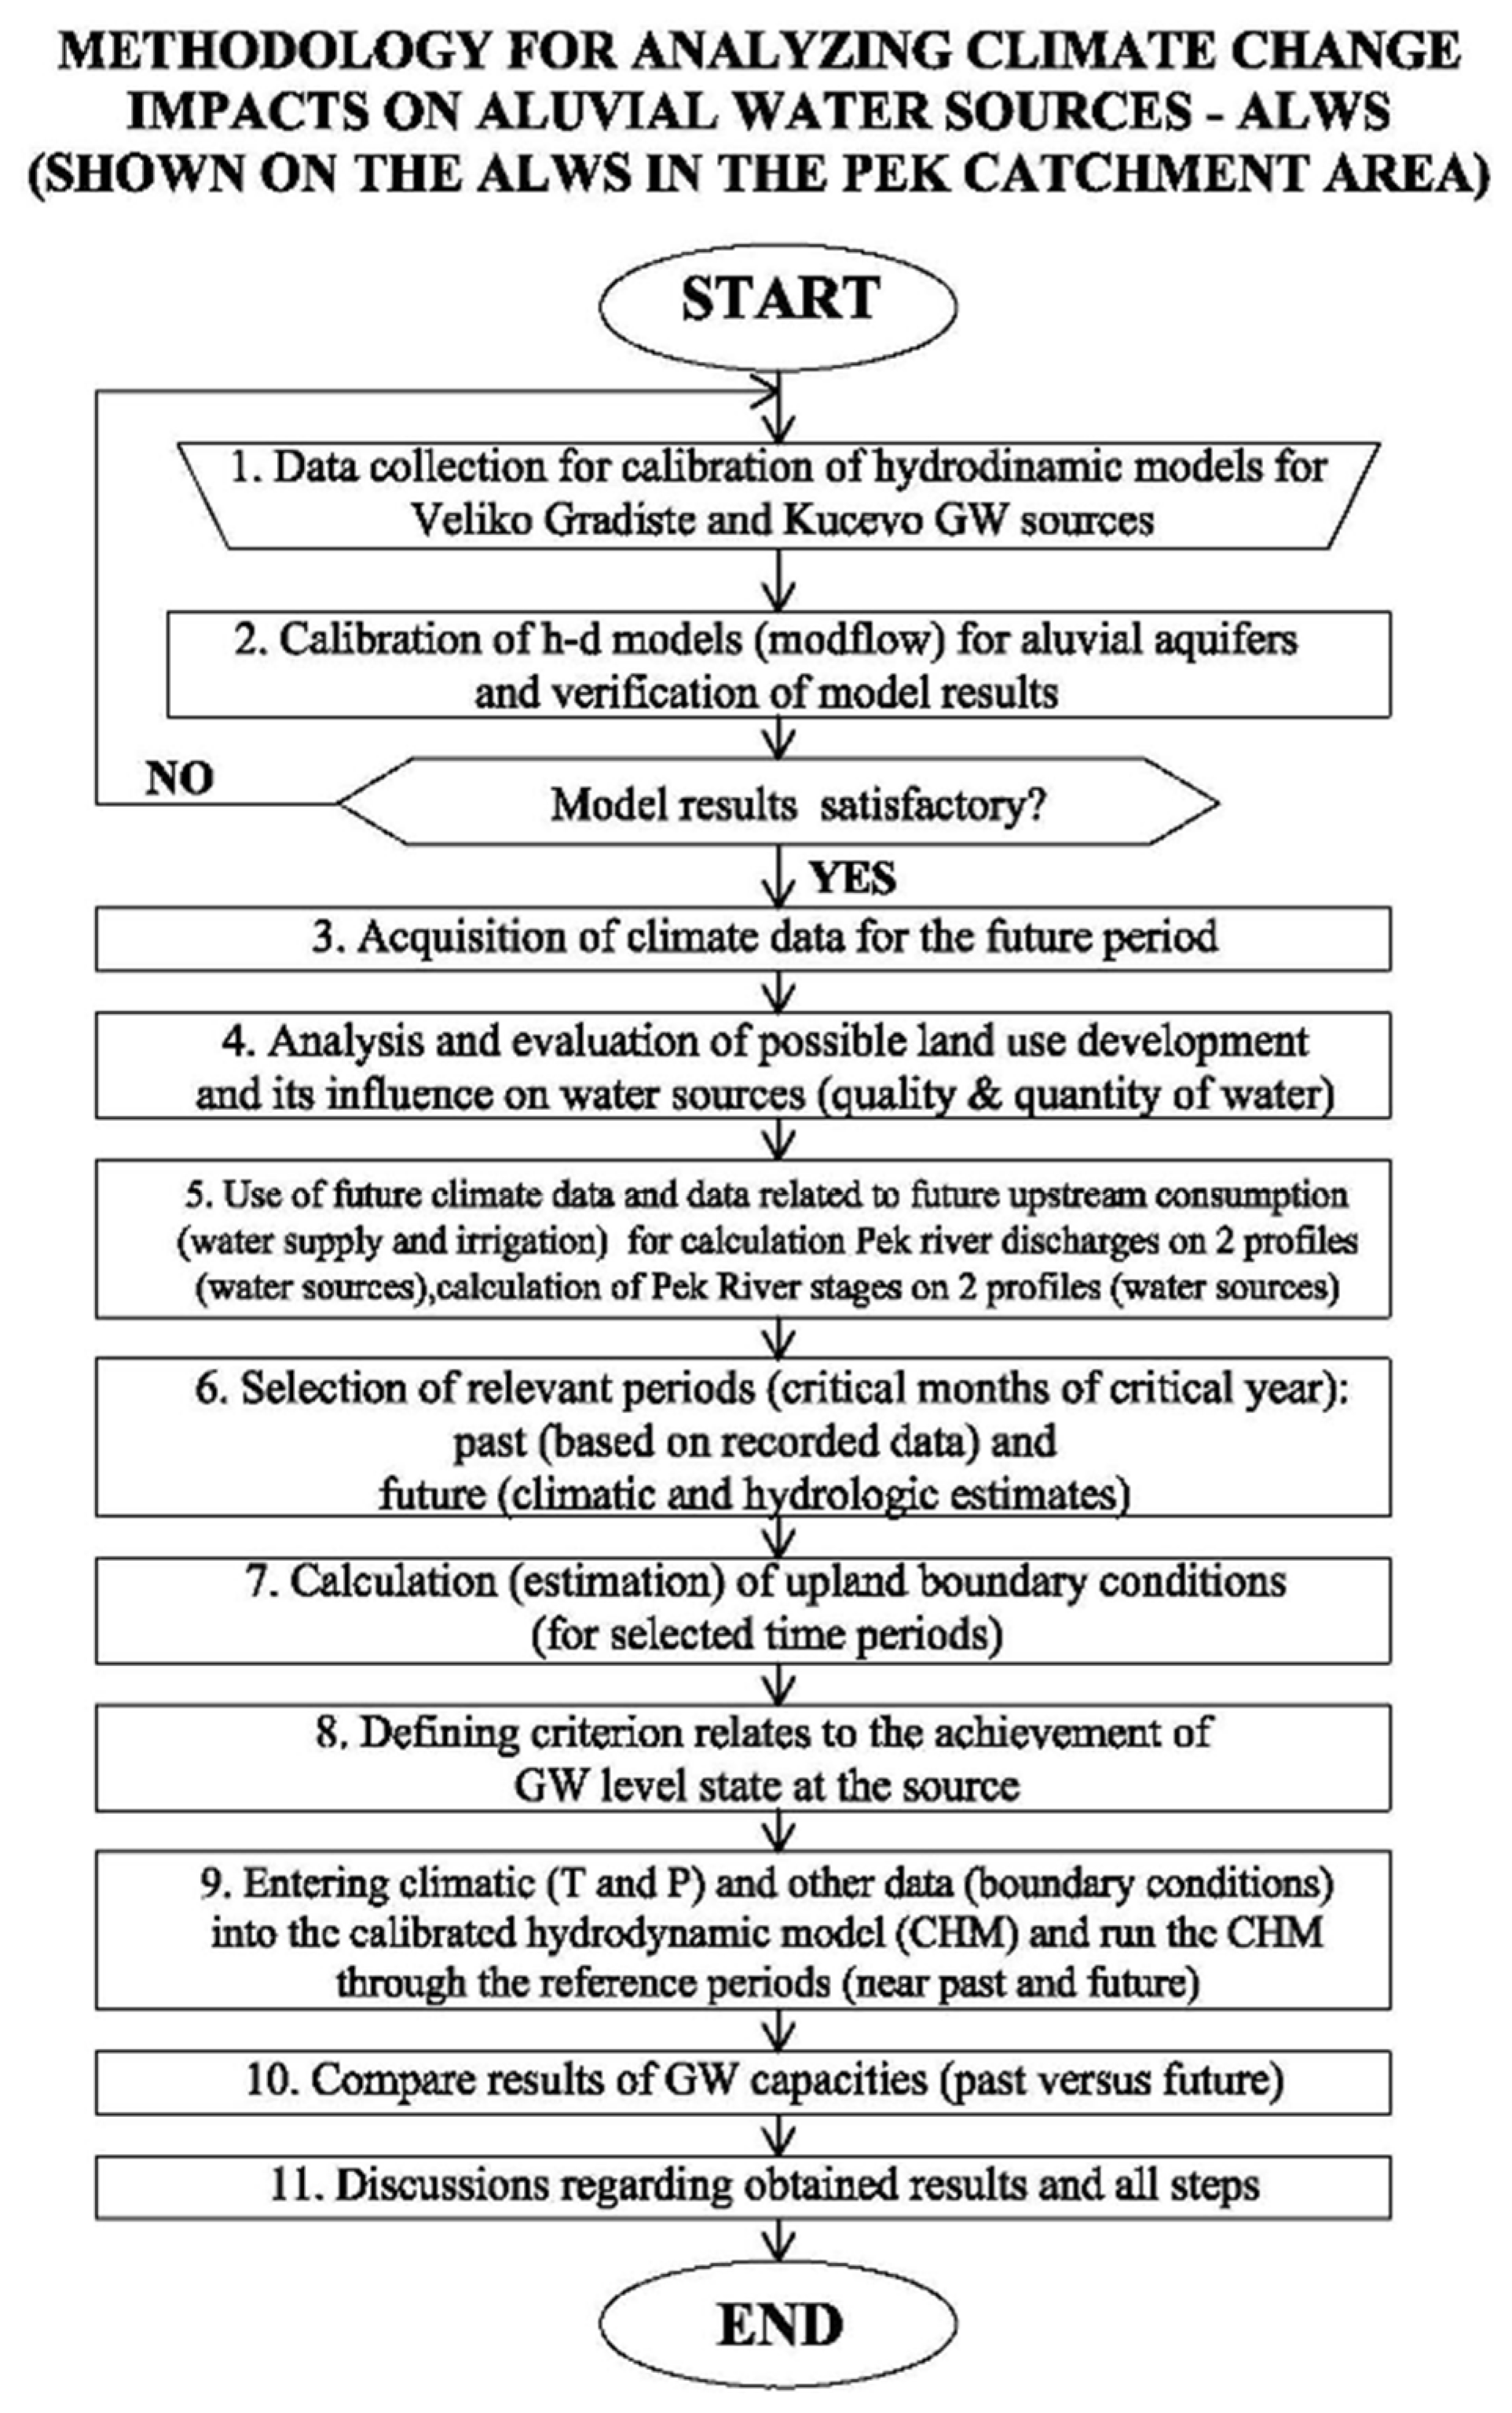
2. Methodology
- Each ALWS can be upgraded (new wells, artificial recharge, and the like). Additionally, all wells exhibit signs of declining discharge, to a greater or lesser extent, due to clogging. Such possibilities and processes are not taken into account in the assessment of climate change impacts on the ALWSs (i.e., the ALWSs are modeled as being the same today and in the future). The ALWS setting is the same today and in the future (no erosion, no siltation, and no morphological changes in the immediate environment). The assessment does not examine whether the capacity of a particular ALWS is adequate or not for the area it services.
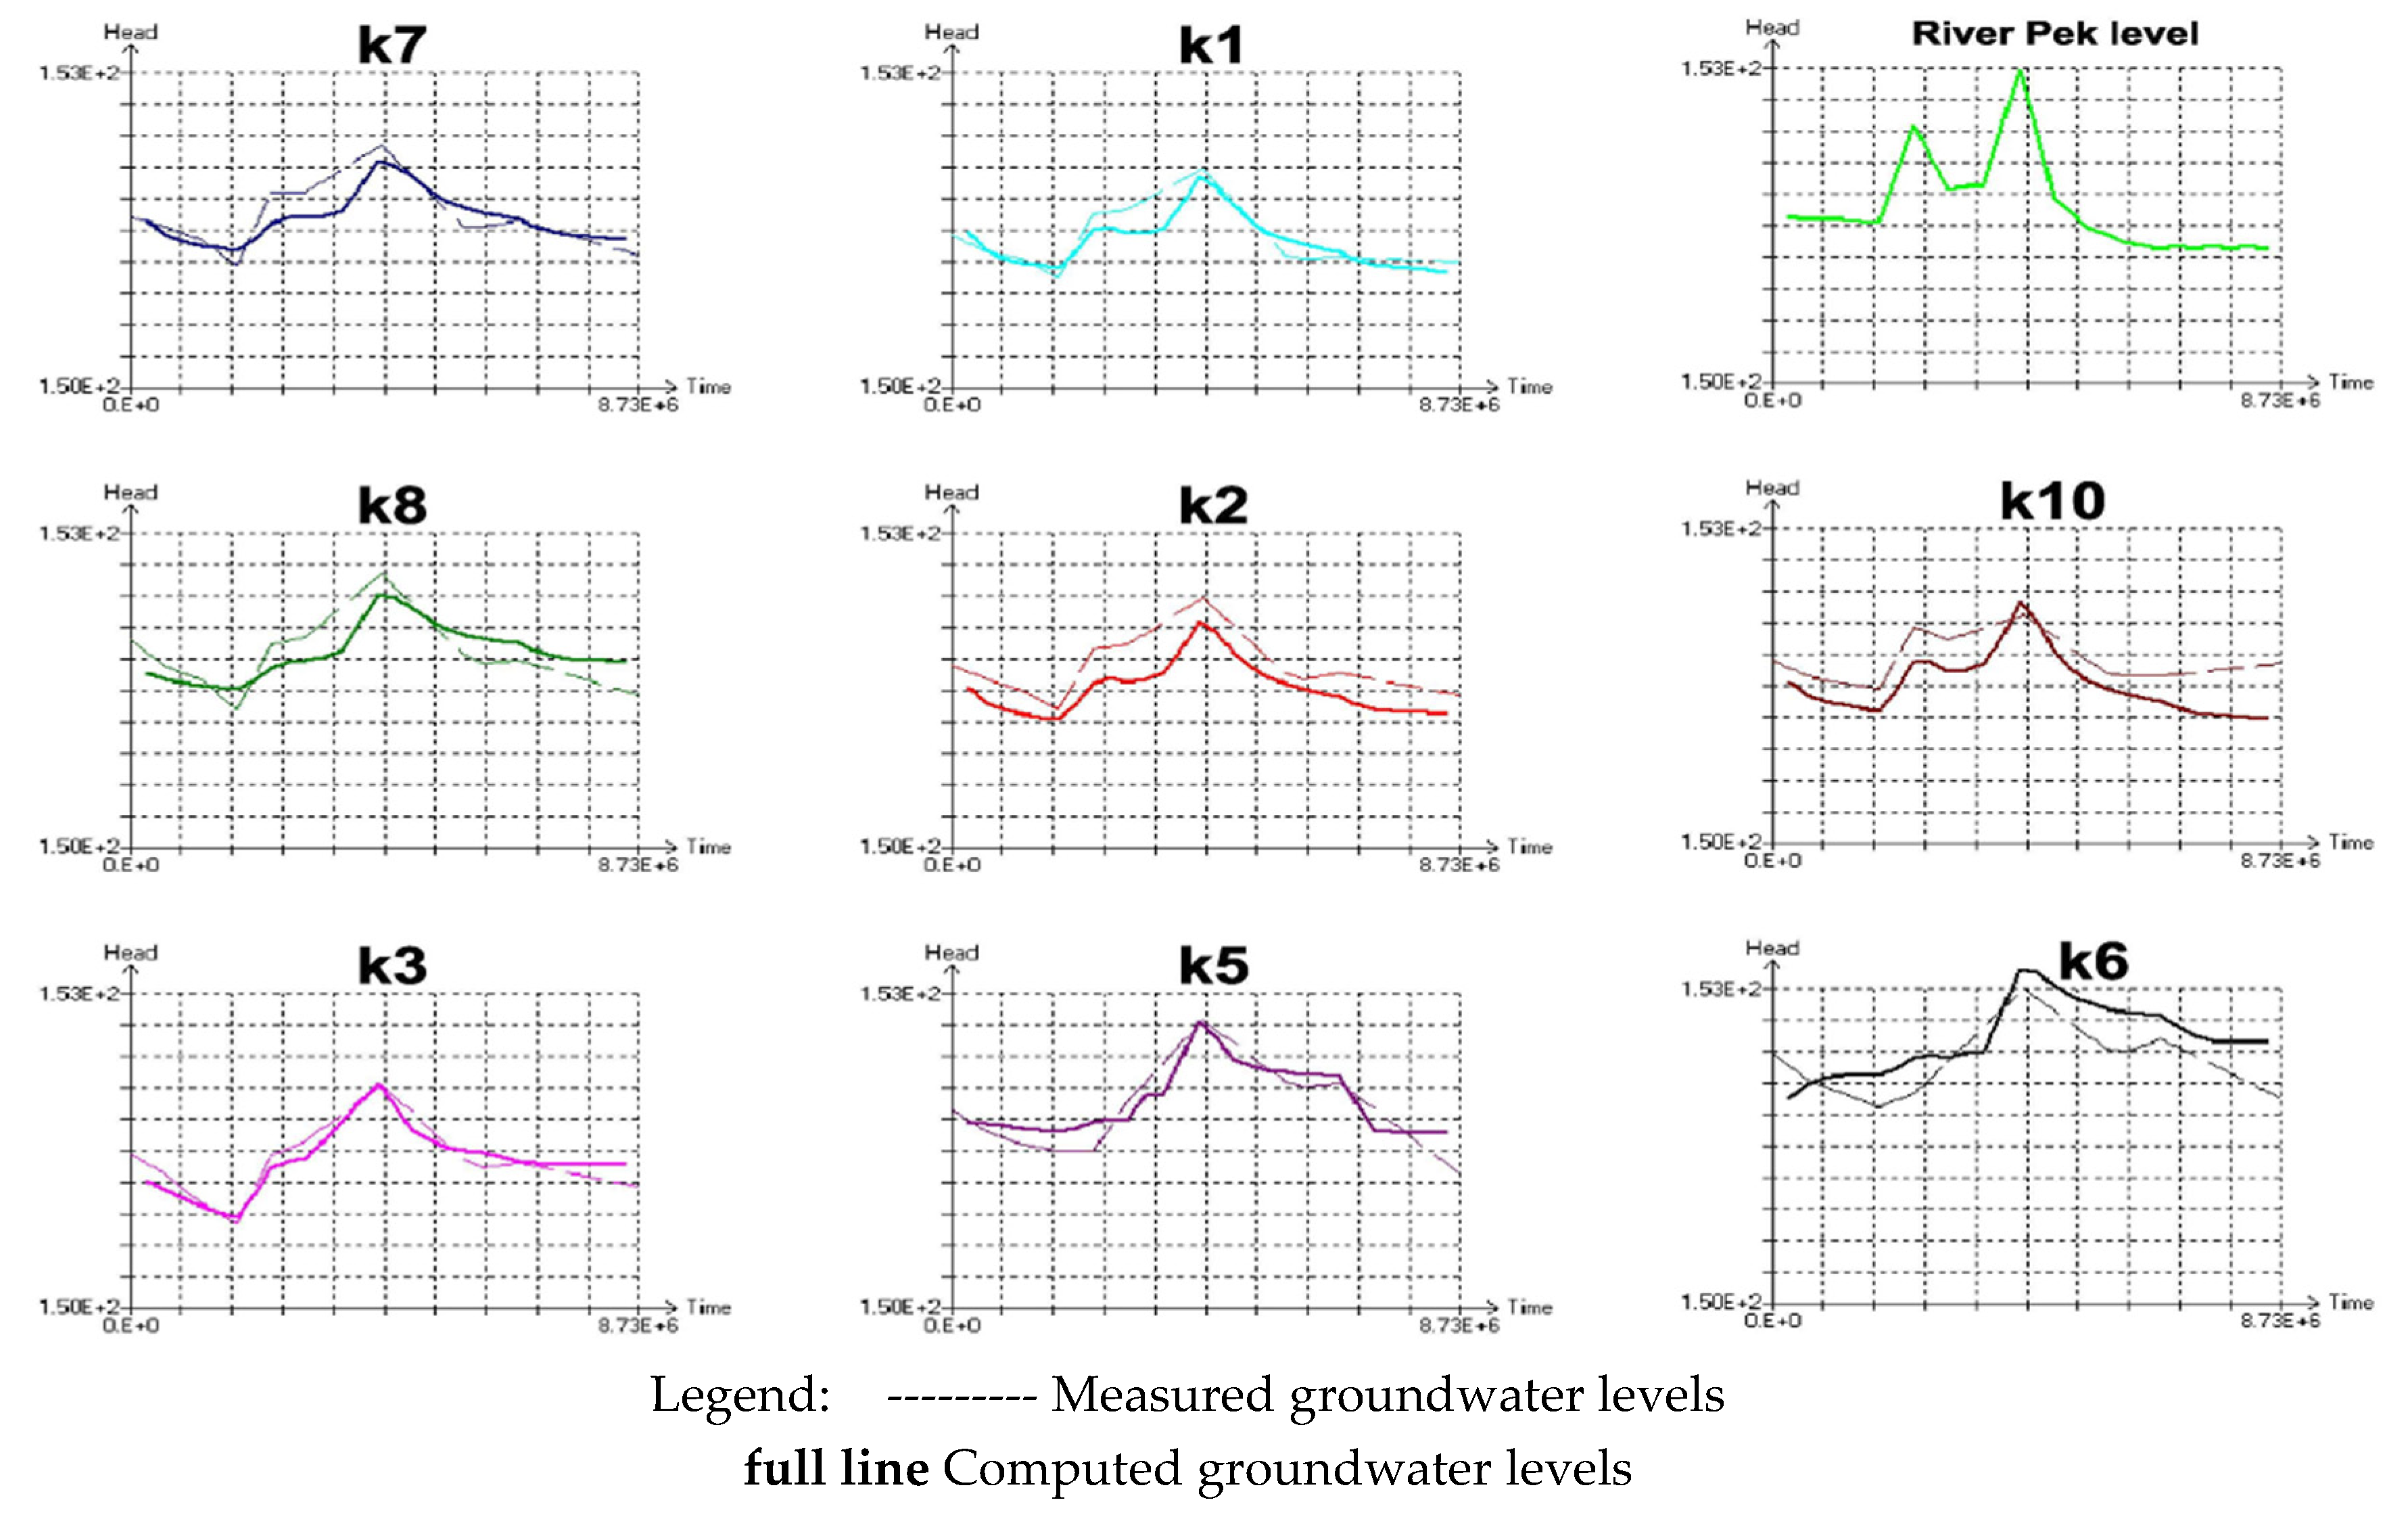
- The groundwater (GW) model calibration time step is one week (GM, Steps 1 and 2), September–December 2010 (Jelak-V. Gradište) and March–June 1997 (Mlaka-Kučevo), while the calculation time step is one month, consistent with available data (GM, Step 9).
- Climate forecast parameters (T and P) were obtained from other CC Waters project partners (GM, Step 3). The climatic scenario used was A1B.
- Land use within the C.A. will not change significantly in the future and, as such, will not result in any runoff coefficient or water balance variation in the upstream portion of the C.A. (GM, Step 4).
- The water balance was not assessed using the conventional hydrologic method. Instead, the multiple non-linear correlation method (VNC) was used, as the dependency of discharge on temperature and precipitation, with corrections for additional water demand and possibly additional evapotranspiration. Changes in the rates of water abstraction for future irrigation and drinking water supply needs upstream from a given river discharge are taken into account, under optimistic (minimum), moderate (plausible) and pessimistic (maximum) scenarios. The additional evapotranspiration was also looked into under three scenarios (optimistic, moderate and pessimistic). Following discharge calculations, the river boundary condition for the HD model was determined based on the established correlation between river discharge and water level, via a large number of recorded data points: discharge-water level pairs (GM, Step 5).
- The time periods considered were: 1961–1990 (base period), and 2021–2050 and 2071–2100 (future periods). Based on recorded hydrologic data and estimated future climatic and hydrologic data, selected critical years are: V. Gradište—1962 (past), and 2035 and 2096 (future); and Kučevo—1961 (past), and 2035 and 2096 (future). Critical months were always July through October, such that the HD models were run through the March-October period (GM, Step 6).
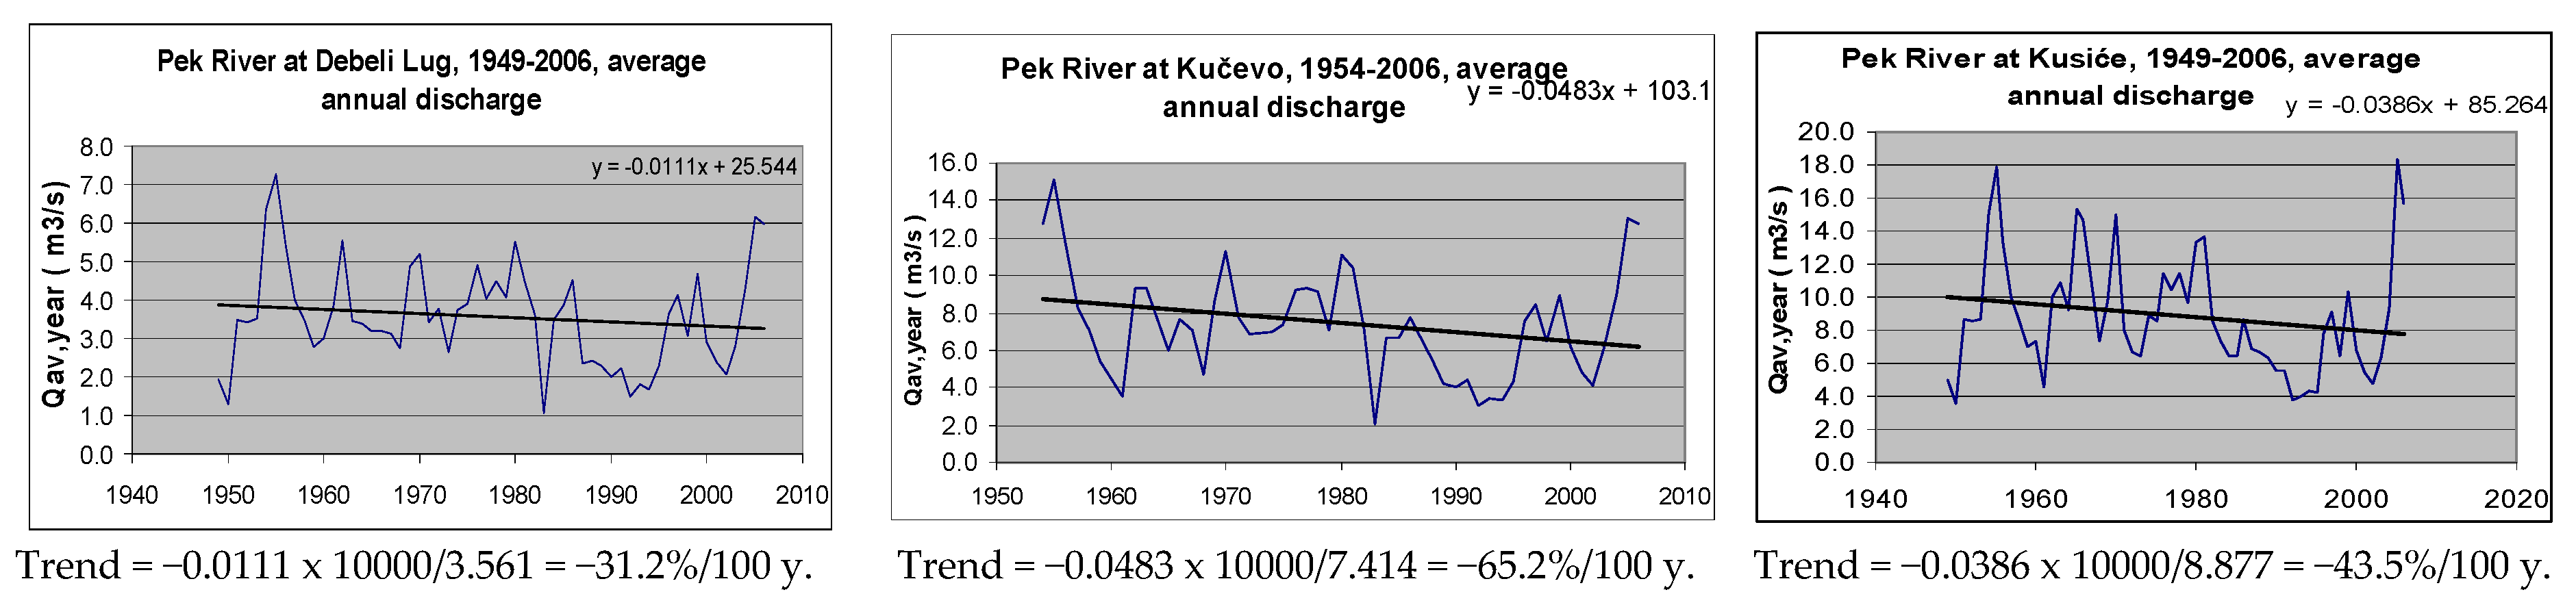
- For the calibration period, GW flow from the upland was found to be about 30 L/s/km (Jelak-VG) and 18 L/s/km (Mlaka-KU). For estimated periods, groundwater flow from the upland was determined based on experience, taking into account that the downward trend of groundwater flow from the upland is about the same or slightly lower than the downward trend obtained for the Pek River, all other conditions being equal (GM, Step 7).
- Two values were assumed for the achievement of a given water level at the wells, as a criterion (GM, Step 8) which is the same for all time periods and scenarios, based on which HD model calculations were performed. The first is slightly above the aquifer floor (the average of 5 wells ≈ 68.2 m.a.s.l. at the V. Gradište ALWS, and the average of 3 wells ≈ 149.5 m.a.s.l. at the Kučevo ALWS), corresponding to the maximum yield of the source under given conditions, while the second is about 0.5 m higher (the average ≈ 68.7 m.a.s.l. at the VG ALWS and the average ≈ 150.0 m.a.s.l. at KU ALWS), corresponding to the lower yield of each of the sources.
- The following will change in the future, relative to the present: temperature and precipitation; upstream water demand for drinking water supply and irrigation; and, as a consequence of climate change, evapotranspiration and river and upland boundary conditions.
- There are no special ecosystems; ecological criteria apply to the downstream consumer (at Kučevo) and to biodiversity of the river itself.
- Calculations were done for:
- Ecological water demand have been estimated base on the nature condition,
- The Pek River water levels at the ALWSs, based on water balance model and estimation of future water demand,
- Upland boundary conditions and recharge for both ALWSs have been estimated base on observations and predicted future conditions.
3. Results Derived for ALWS Capacities
4. Discussions Regarding Uncertainties and Obtained Results
4.1. Climate Predictions
4.2. Land Use Predictions
4.3. River Hydrology and Water Balance Predictions
4.4. Groundwater Flow Predictions, Inciuding Boundary Conditions
4.5. General Conclusions
Acknowledgments
References
- Synthesis Report of the IPCC. Available online: www.ipcc.ch (accessed on 31 August 2018).
- Climate Change and Impacts on Water Supply (CC-WaterS)-International Project for SE Europe, 18 Institutions from SE Europe, May 2009–May 2012. Available online: http://www.ccwaters.eu/index.php?option=com_content&view=article&id=48&Itemid=54&56b00064c3e6beb26da3b96d1578b92a=caac98a9a4248cd115a194c70c97a142 (accessed on 31 August 2018).
- Dimkić, D. Present and future mean hydrologic trends in Serbia as a function of climate trends. Desalin. Water Treat. J. 2017, 99, 10–17. [Google Scholar] [CrossRef]
- Climate Change Impacts on River Hydrology in Serbia–National Study; Jaroslav Černi Institute for the Development of Water Resources: Belgrade, Serbia, 2010–2012.
- Dimkić, D. New Method for Estimation Mean Hydrological Changes and Question of Reliability in Forecasting Future Hydrological Regimes. Procedia Eng. 2016, 162, 145–152. [Google Scholar] [CrossRef]
- Smailagić, J. Climate change in Serbia, Monography. In Memory of Milutin Milanković; Publisher: Association of University professors, Belgrade, 2009; pp. 109–120. ISBN 978-86-910313-1-2. [Google Scholar]
- Ðuric, D.; Lukic, V.; Soro, A. Hydrodynamic Analyses of Novi Sad Petrovaradinska ada Ground Water Source Expanding; Vodoprivreda Magazine: Belgrade, Serbia, 2012; Volume 44, pp. 265–272, no. 4–6/2012, number 258–260; ISSN 0350-0519. [Google Scholar]
- Pušic, M.; Lukic, V.; Jevtic, G. Hydrodynamic Model and Potential Possibilities for New Ground Water Sources Opening in Western SREM Region. In Proceedings of the XIII Symposium on Hydrogeology and Engineering Geology, Herceg Novi, Montenegro, June 2002; pp. 413–420. [Google Scholar]

| Type of Station | Station | Jan | Feb | Mar | Apr | May | Jun | Jul | Aug | Sep | Oct | Nov | Dec | Aver |
|---|---|---|---|---|---|---|---|---|---|---|---|---|---|---|
| T (°C/100 y) | Veliko Gradište | 1.3 | 1.0 | 2.2 | −0.7 | 1.1 | 0.5 | 0.6 | 0.5 | −2.1 | 0.0 | −1.8 | −2.9 | 0.0 1 |
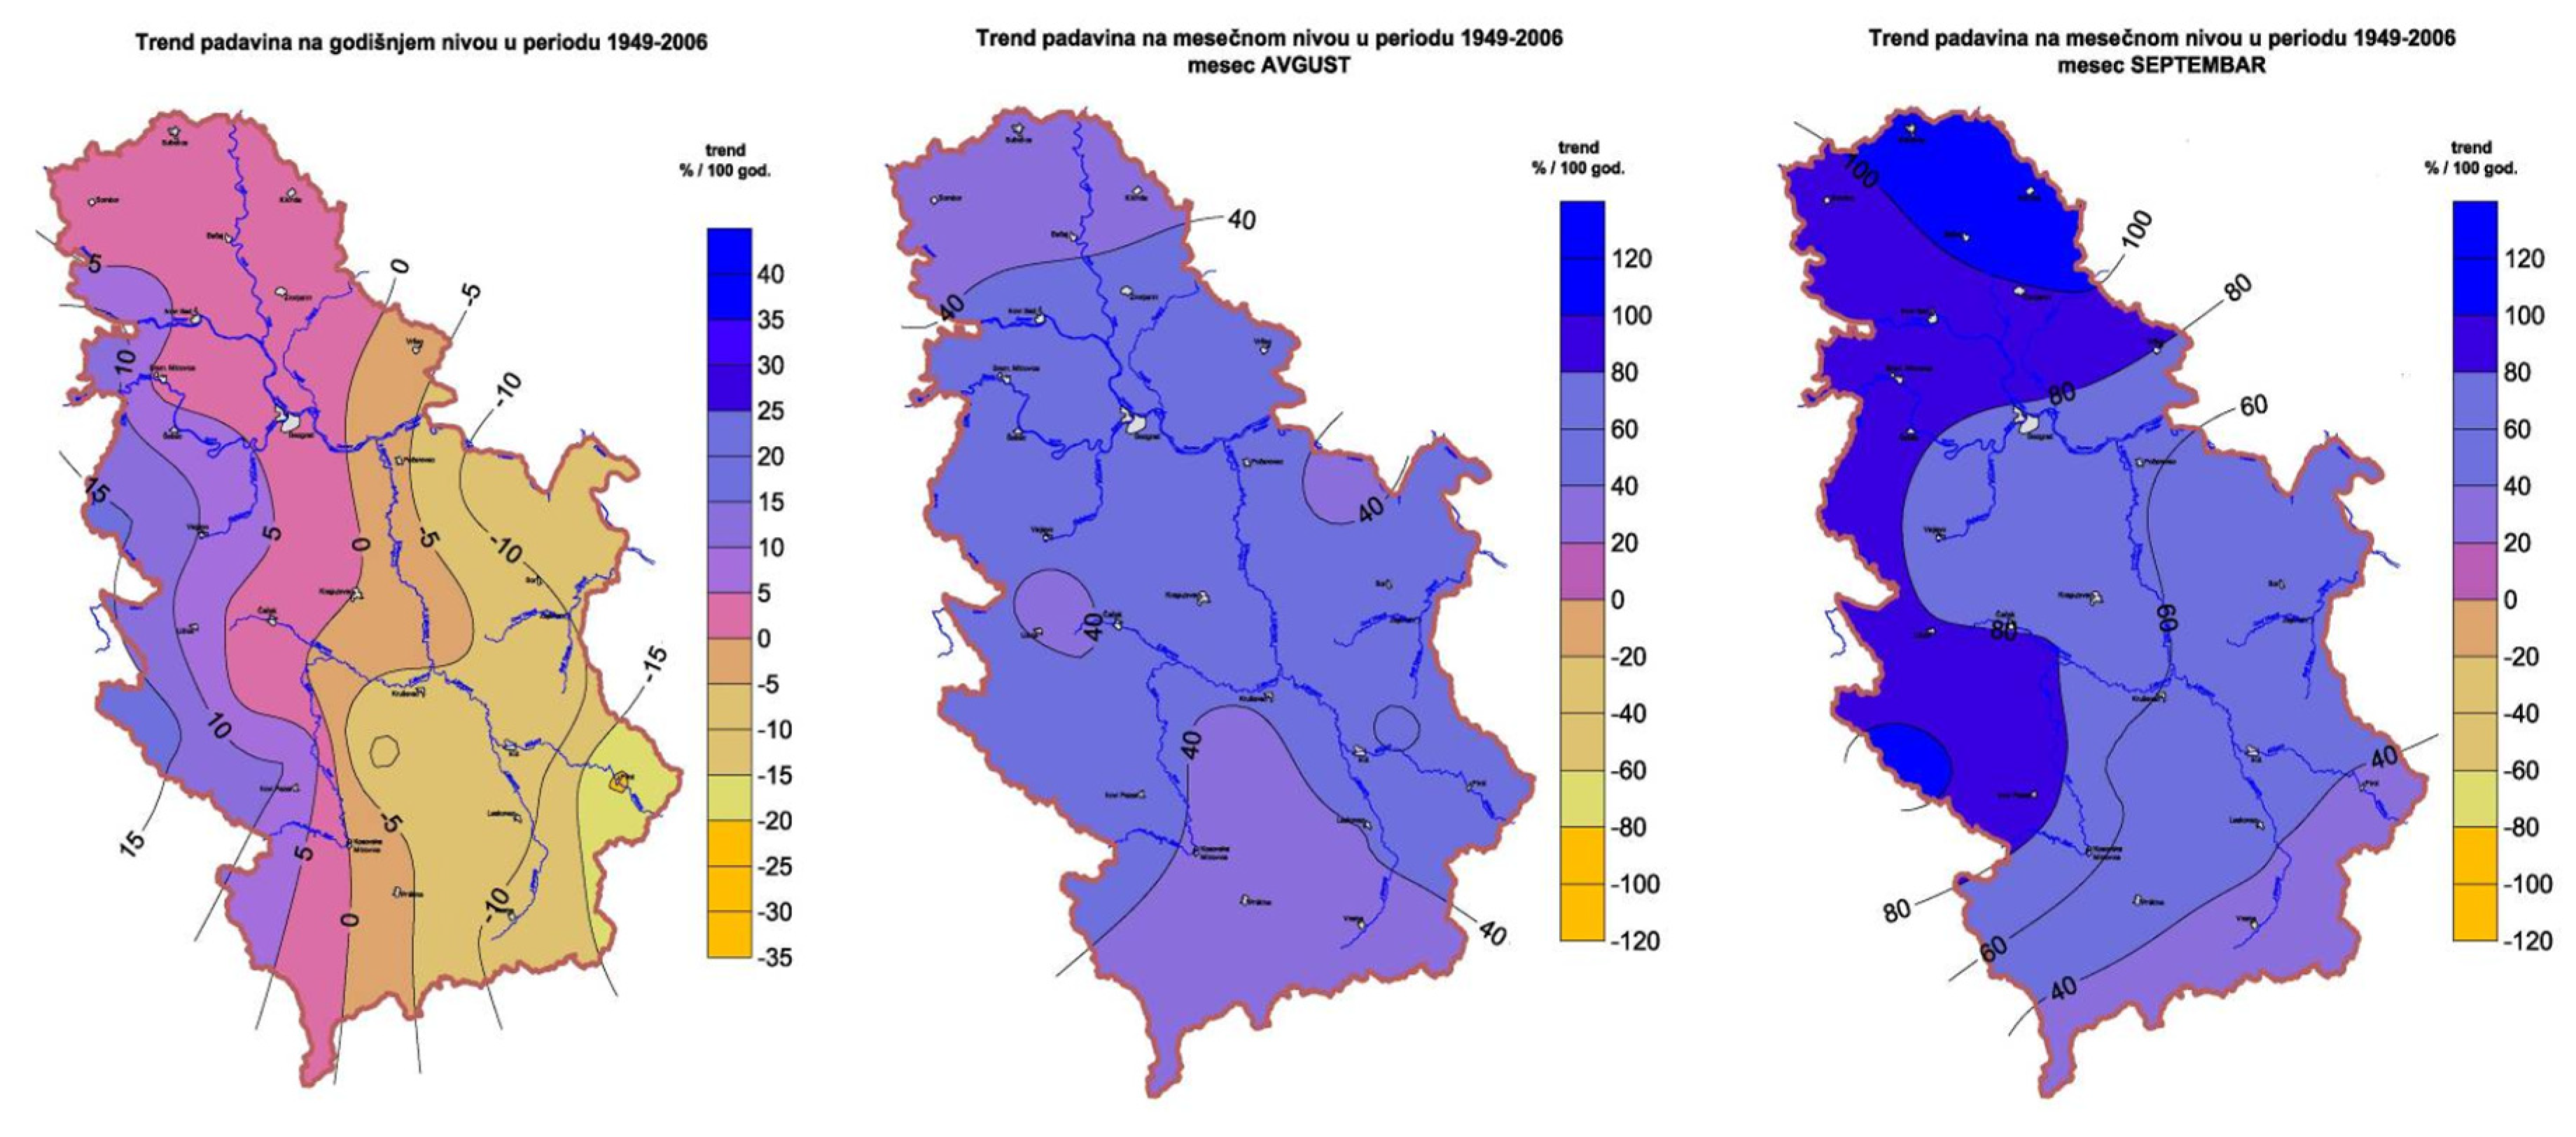
| P (%/100 y) | Braničevo (near VG) | −50.3 | −39.4 | −47.0 | 76.1 | −106.7 | −23.0 | 4.3 | 63.0 | 98.6 | 36.2 | −78.2 | −39.8 | −10.5 2 |
| P (%/100 y) | Voluja (near KU) | −22.9 | −70.1 | 9.2 | 58.2 | −54.8 | −76.7 | −76.6 | 21.8 | 7.0 | 13.1 | −93.0 | −45.5 | −31.0 2 |
| P (%/100 y) | Vlaole (near MA) | −66.3 | −54.0 | −49.7 | 1.0 | −76.0 | −24.8 | −30.9 | 56.6 | 64.5 | −50.9 | −96.4 | −43.1 | −33.6 2 |
| Q (%/100 y) | Kusići (V. Gradište) | −35.2 | −38.6 | −10.9 | −19.3 | −71.8 | −123.6 | −50.6 | −4.5 | 9.6 | 3.5 | −122 | −64.6 | −43.5 3 |
| Veliko Gradiste | Average | Average for Apr.–Sept. | Average for Oct.–March | ||||||
|---|---|---|---|---|---|---|---|---|---|
| Period | Min. | Plausible | Max. | Min. | Plausible | Max. | Min. | Plausible | Max. |
| 1961–1990 (L/s) | 56 | 62 | 65 | 55 | 60 | 63 | 58 | 64 | 66 |
| 2021–2050 (L/s) | 49 | 55 | 60 | 48 | 54 | 58 | 50 | 57 | 63 |
| 2071–2100 (L/s) | 39 | 44 | 49 | 38 | 43 | 47 | 41 | 46 | 52 |
| (2021–50)/(1961–90) | 0.88 | 0.89 | 0.92 | 0.88 | 0.90 | 0.92 | 0.88 | 0.89 | 0.95 |
| (2071–2100)/(61–90) | 0.70 | 0.71 | 0.75 | 0.70 | 0.72 | 0.75 | 0.71 | 0.72 | 0.79 |
| Veliko Gradiste | Average | Average for Apr.–Sept. | Average for Oct.–March | ||||||
|---|---|---|---|---|---|---|---|---|---|
| Period | Min. | Plausible | Max. | Min. | Plausible | Max. | Min. | Plausible | Max. |
| 1962 (L/s) | 52 | 56 | 61 | 52 | 55 | 59 | 52 | 58 | 61 |
| 2035 (L/s) | 44 | 49 | 54 | 44 | 48 | 53 | 47 | 50 | 54 |
| 2096 (L/s) | 36 | 39 | 44 | 36 | 38 | 43 | 38 | 41 | 44 |
| 2035/1962 | 0.86 | 0.88 | 0.89 | 0.86 | 0.88 | 0.89 | 0.90 | 0.88 | 0.89 |
| 2096/1962 | 0.69 | 0.70 | 0.72 | 0.69 | 0.70 | 0.72 | 0.72 | 0.71 | 0.72 |
| Kucevo | Average | Average of Apr.–Sept. | Average of Oct.–March | ||||||
|---|---|---|---|---|---|---|---|---|---|
| Period | Min. | Plausible | Max. | Min. | Plausible | Max. | Min. | Plausible | Max. |
| 1961–1990 (L/s) | 28 | 32 | 35 | 26 | 30 | 33 | 30 | 34 | 36 |
| 2021–2050 (L/s) | 25 | 28 | 31 | 22 | 25 | 28 | 28 | 31 | 33 |
| 2071–2100 (L/s) | 18 | 20 | 22 | 15 | 17 | 19 | 21 | 24 | 26 |
| (2021–50)/(1961–90) | 0.89 | 0.88 | 0.89 | 0.85 | 0.83 | 0.85 | 0.93 | 0.91 | 0.92 |
| (2071–2100)/(61–90) | 0.64 | 0.63 | 0.63 | 0.57 | 0.57 | 0.58 | 0.70 | 0.71 | 0.72 |
| Kucevo | Average | Average of Apr.–Sept. | Average of Oct.–March | ||||||
|---|---|---|---|---|---|---|---|---|---|
| Period | Min. | Plausible | Max. | Min. | Plausible | Max. | Min. | Plausible | Max. |
| 1961 (L/s) | 24 | 28 | 33 | 24 | 26 | 29 | 25 | 30 | 33 |
| 2035 (L/s) | 21 | 25 | 31 | 21 | 22 | 24 | 23 | 28 | 31 |
| 2096 (L/s) | 14 | 18 | 23 | 14 | 15 | 16 | 18 | 21 | 23 |
| 2035/1961 | 0.89 | 0.89 | 0.94 | 0.89 | 0.85 | 0.83 | 0.91 | 0.93 | 0.94 |
| 2096/1961 | 0.57 | 0.64 | 0.70 | 0.57 | 0.57 | 0.56 | 0.72 | 0.70 | 0.70 |
Publisher’s Note: MDPI stays neutral with regard to jurisdictional claims in published maps and institutional affiliations. |
© 2018 by the authors. Licensee MDPI, Basel, Switzerland. This article is an open access article distributed under the terms and conditions of the Creative Commons Attribution (CC BY) license (https://creativecommons.org/licenses/by/4.0/).
Share and Cite
Dimkić, D.; Prohaska, S.; Stanković, B.; Pajić, P. Alluvial Water Source Capacity under the Climate Change and Other Impacts—Case Study of the Pek River in Serbia. Proceedings 2018, 2, 596. https://doi.org/10.3390/proceedings2110596
Dimkić D, Prohaska S, Stanković B, Pajić P. Alluvial Water Source Capacity under the Climate Change and Other Impacts—Case Study of the Pek River in Serbia. Proceedings. 2018; 2(11):596. https://doi.org/10.3390/proceedings2110596
Chicago/Turabian StyleDimkić, Dejan, Stevan Prohaska, Bojan Stanković, and Predrag Pajić. 2018. "Alluvial Water Source Capacity under the Climate Change and Other Impacts—Case Study of the Pek River in Serbia" Proceedings 2, no. 11: 596. https://doi.org/10.3390/proceedings2110596
APA StyleDimkić, D., Prohaska, S., Stanković, B., & Pajić, P. (2018). Alluvial Water Source Capacity under the Climate Change and Other Impacts—Case Study of the Pek River in Serbia. Proceedings, 2(11), 596. https://doi.org/10.3390/proceedings2110596