Combining Models to Simulate the Condition of the PVC Distribution Network †


Abstract
:1. Introduction
2. Methods
2.1. Overview of the Modeled Systems
2.2. Model Asumptions and Failure Criterion
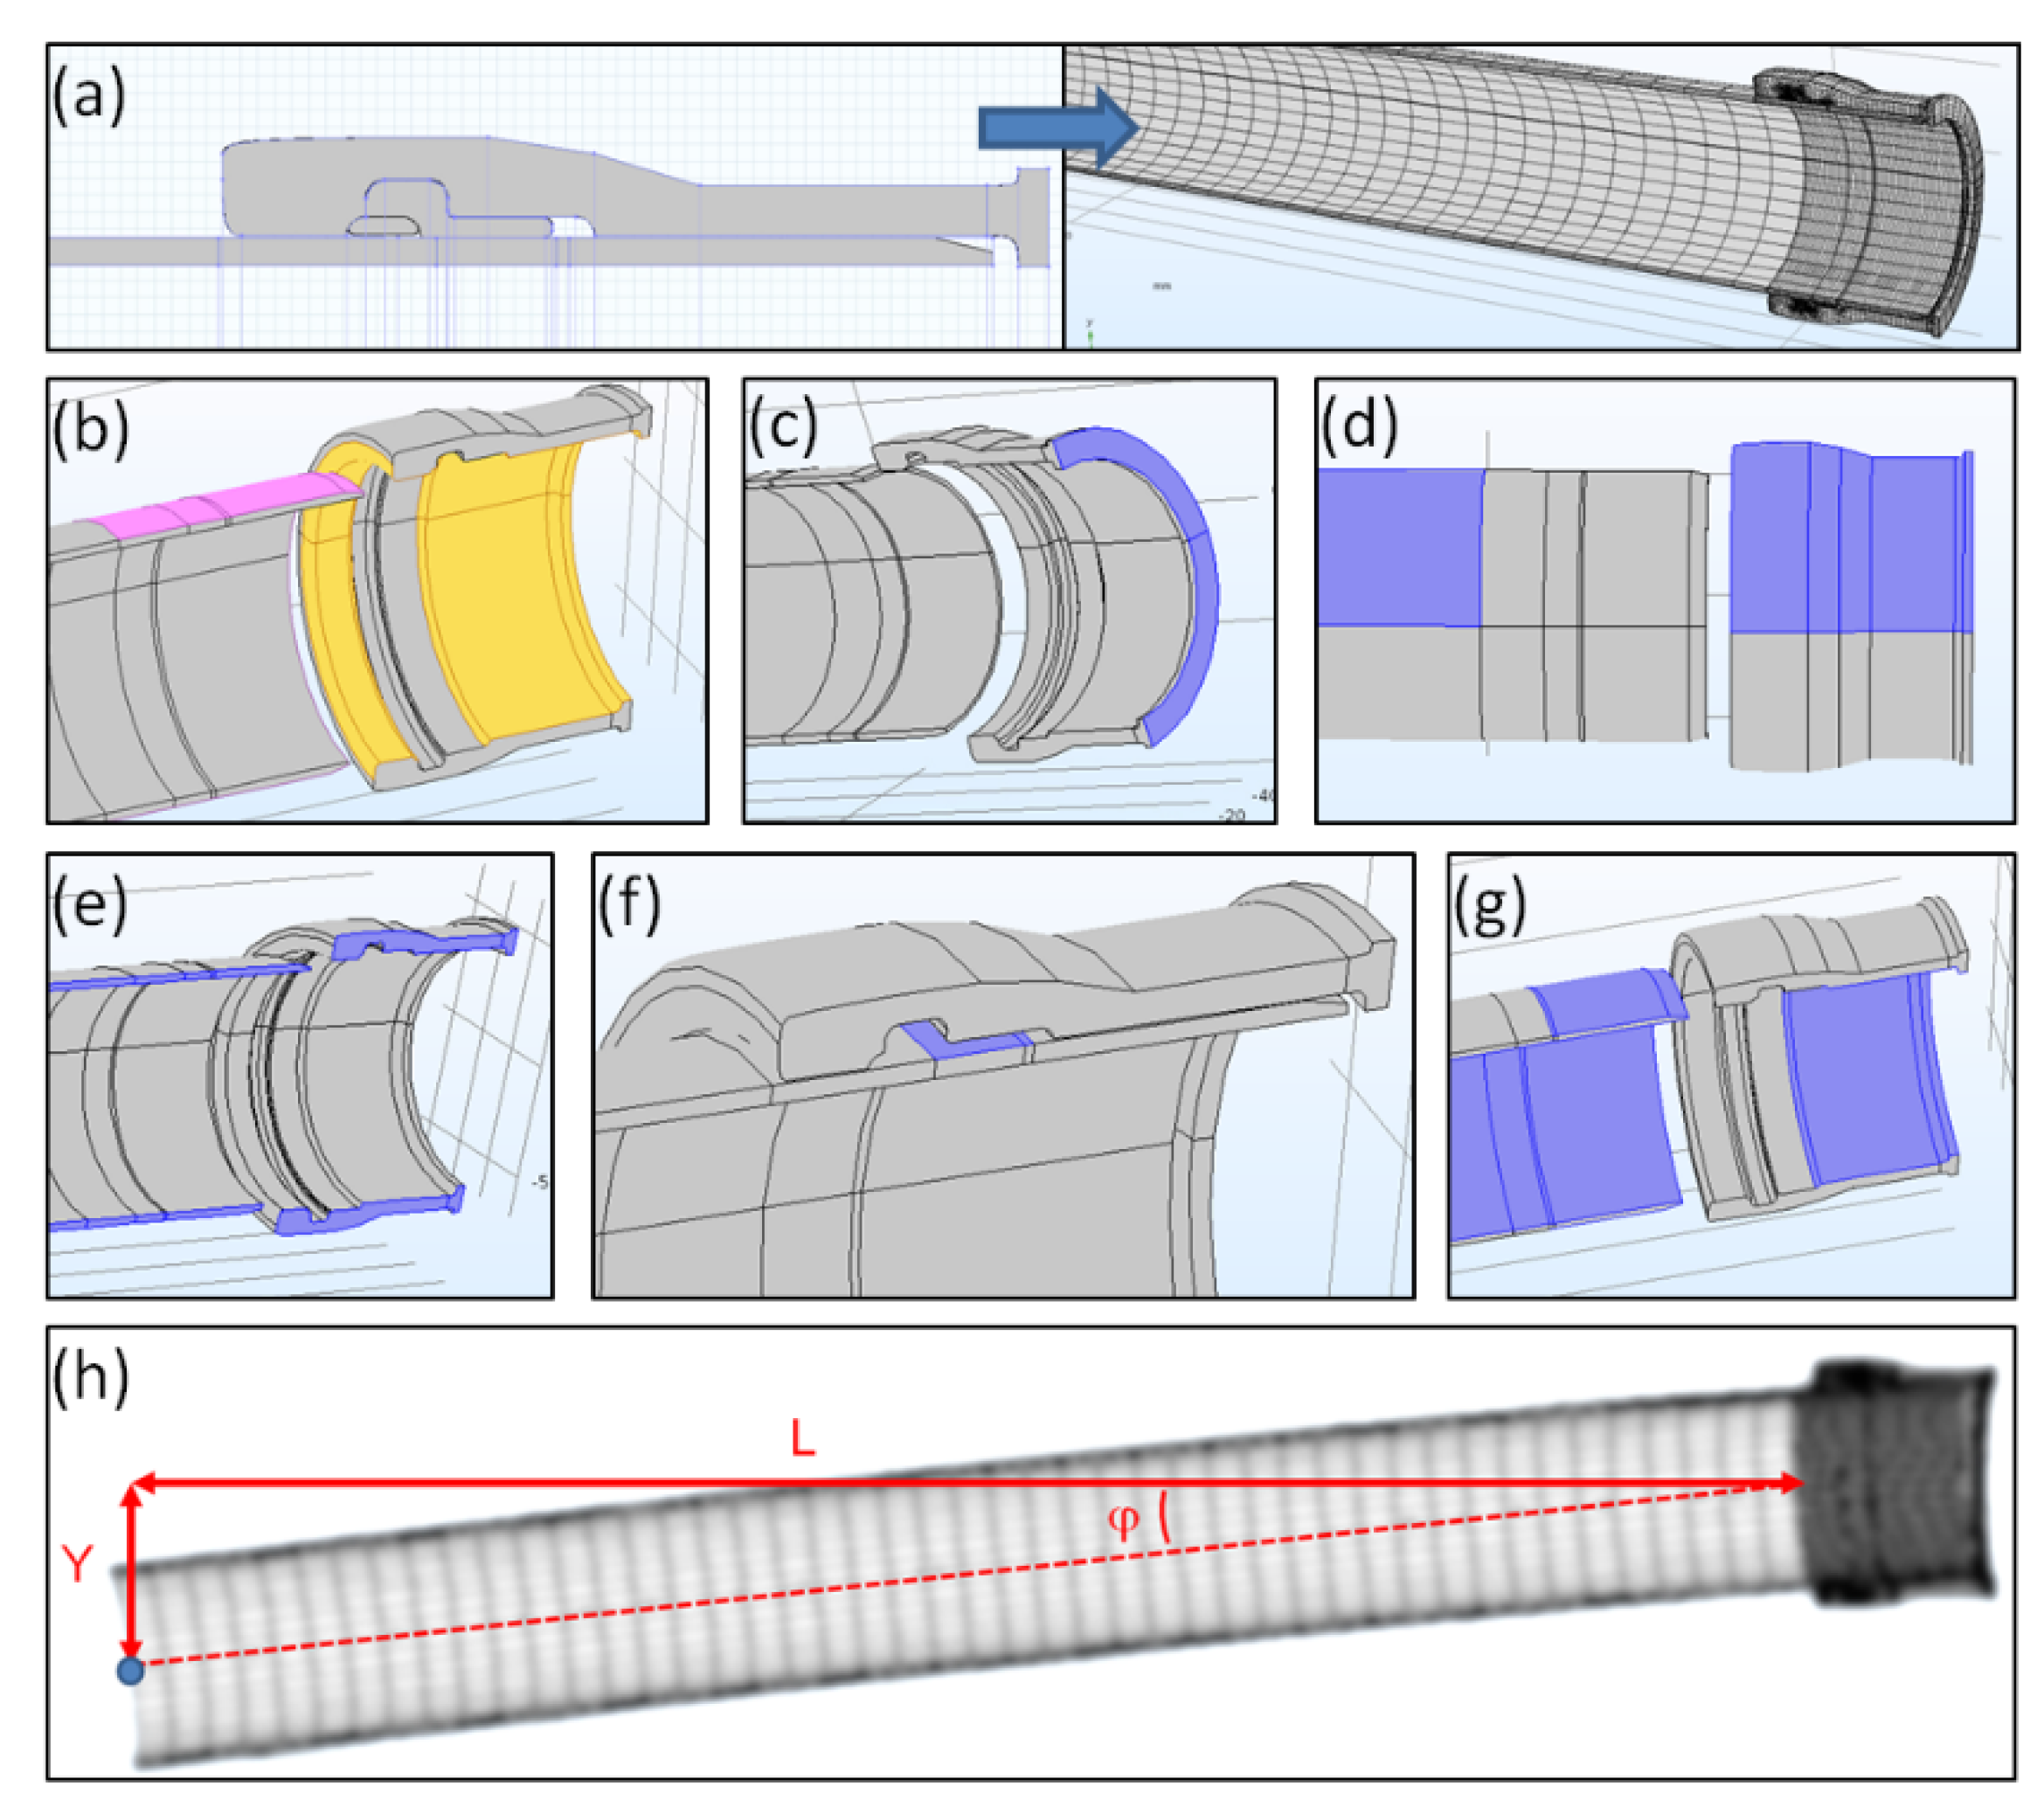
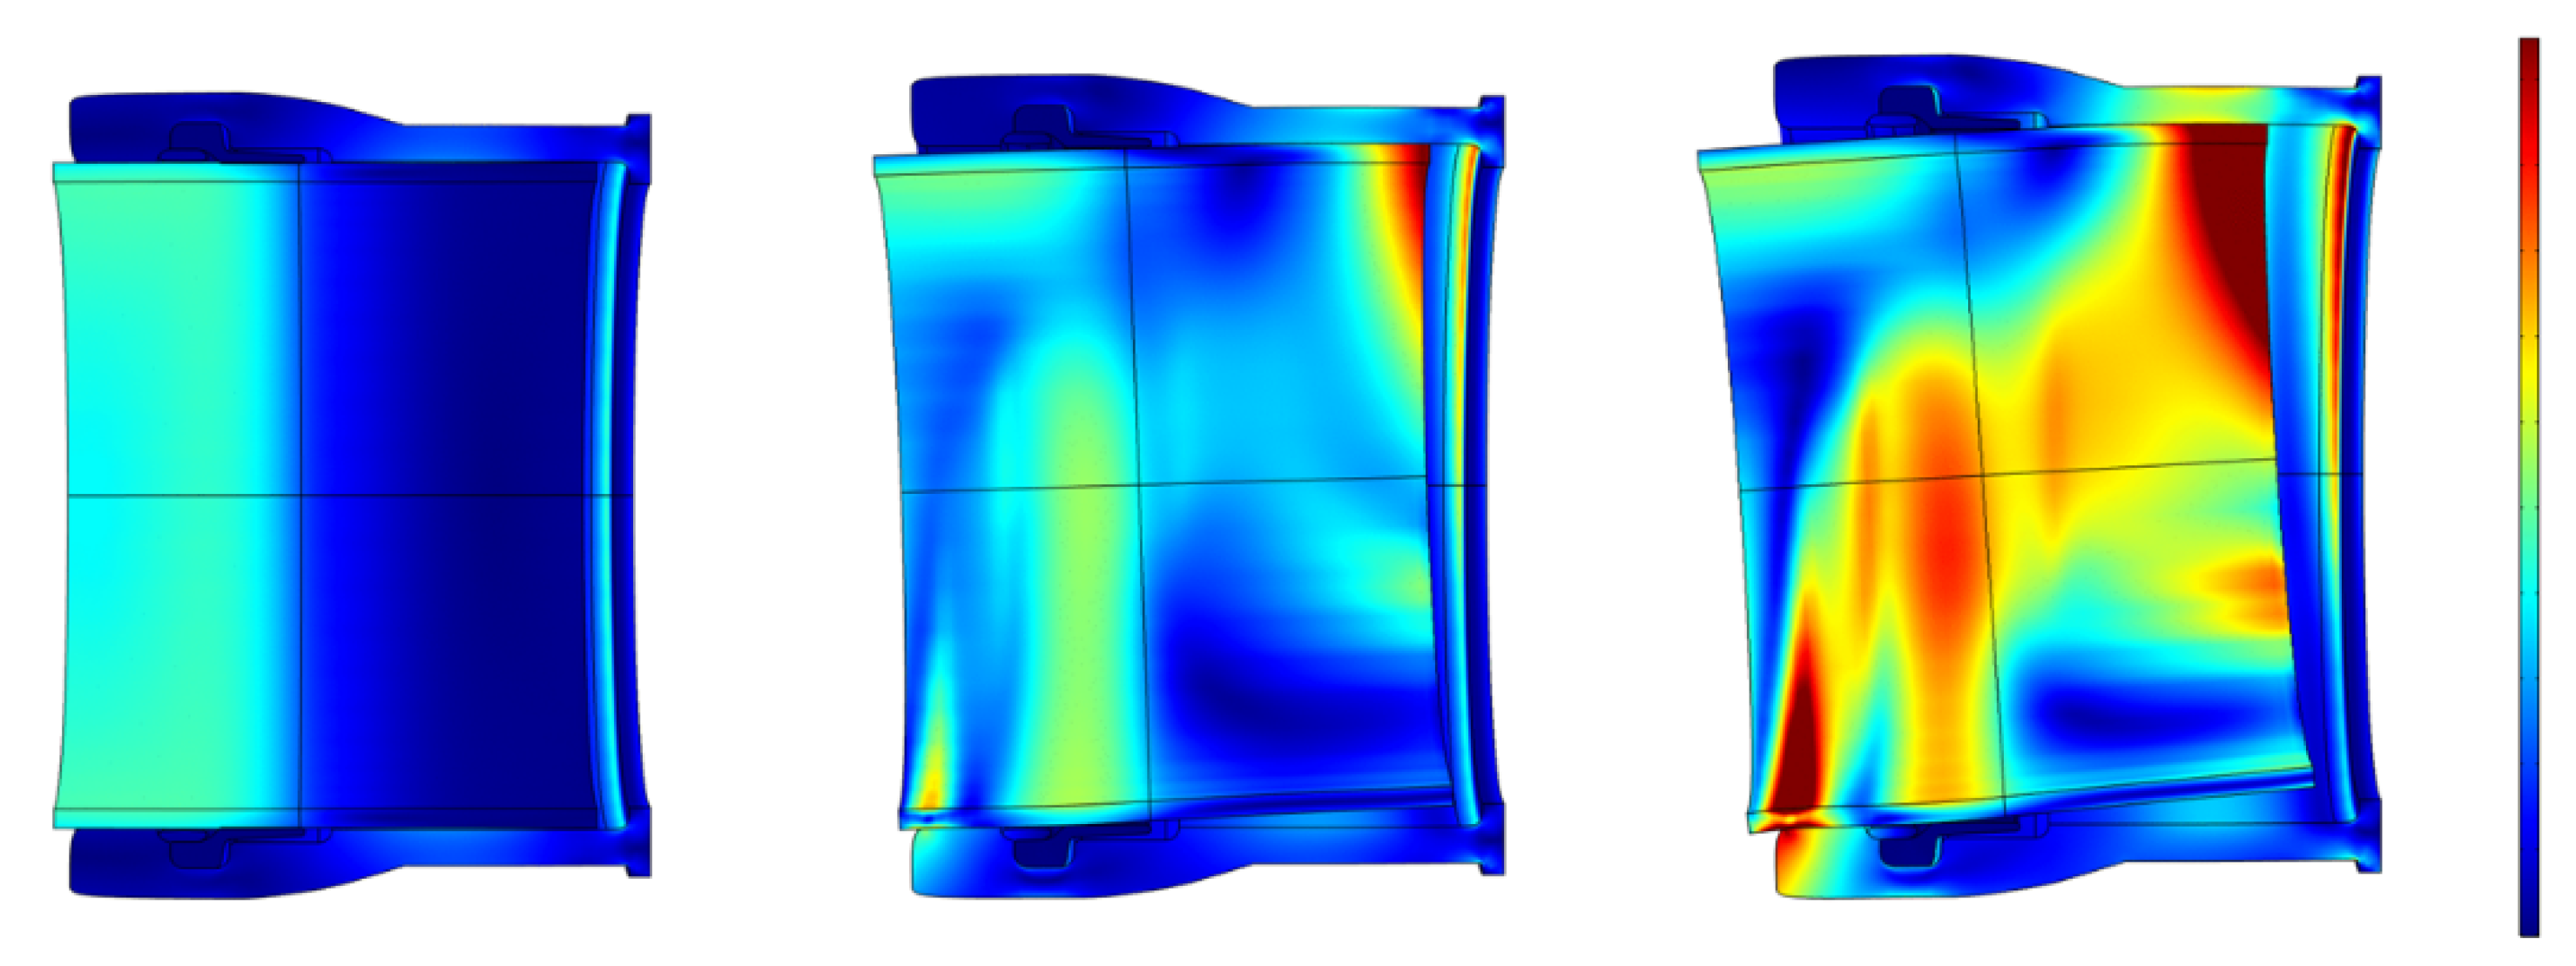
2.3. FEM Model
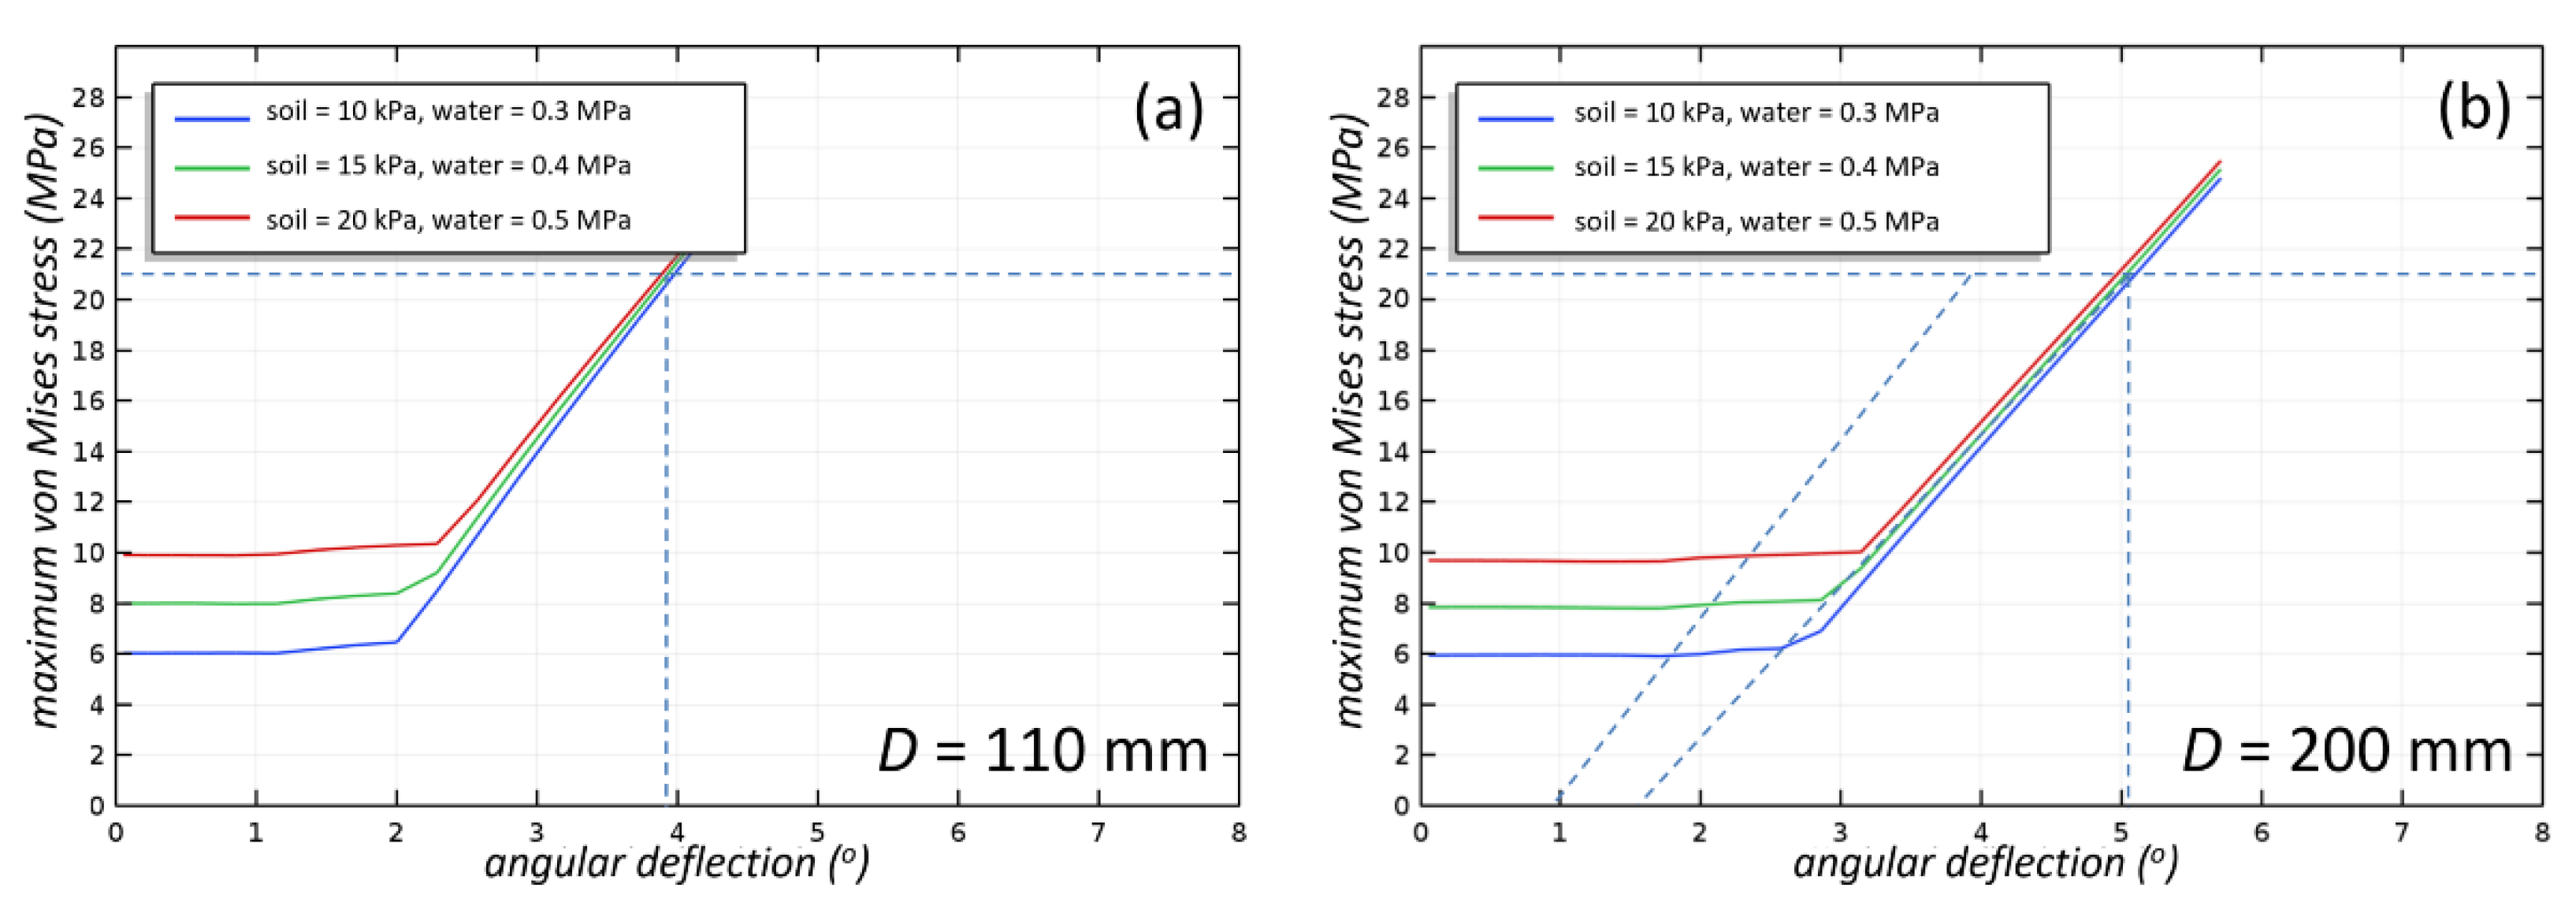
3. Results
4. Discussion and Conclusions
4.1. Validation
4.2. Concluding Remarks
Author Contributions
Funding
Acknowledgments
Conflicts of Interest
References
- Wols, B.; Moerman, A.; Horst, P.; van Laarhoven, K. Prediction of pipe failure in drinking water distribution networks by Comsima. In Proceedings of the 3rd EWaS international conference on “Insights on the water-energy-food nexus”, Lefkada Island, Greece, 27–30 June 2018. [Google Scholar]
- Vreeburg, J.H.G.; Vloerbergh, I.N.; van Thienen, P.; de Bont, R. Shared failure data for strategic asset management. Water Sci. Technol. 2013, 13, 1154–1160. [Google Scholar] [CrossRef]
- Pipelife, P.V.C. Drukleidingen. Available online: http://www.pipelife.nl/nl/media/pdfs/Brochure_PVCdrukleidingen_A6.pdf (accessed on 29 January 2018).
- Arsenio, A.M. Lifetime Prediction of PVC Push-Fit Joints. Ph.D. Thesis, Delft University of Technology, Delft, The Netherlands, 2013. [Google Scholar]
- ISO. 13783:1997 Plastics Piping Systems—Unplasticized PVC End-Load-Bearing Double-Socket Joints—Test Method for Leak Tightness and Strength while Subjected to Bending and Internal Pressure; ISO 13783:1997; International Organization for Standardization: Geneva, Switzerland, 1997. [Google Scholar]
- Balkaya, M.; Moore, I.D. Analysis of a gasketed PVC pipe-joint. In TRB 2009 Annual Meeting; CD-ROM; Transportation Research Board of the National Academies: Washinton, DC, USA, 2009. [Google Scholar]
- Zhao, Z. Effect of Temperature on the Relaxation of Polyvinyl Chloride Flanges. Master’s Thesis, University of Quebec, Quebec City, Montreal, Canada, 2017. [Google Scholar]
- Mark, J.E. Polymer Data Handbook; Oxford University Press: Oxford, UK, 1999; pp. 928–934. ISBN 9780195181012. [Google Scholar]
- Davis, P.; Burn, S.; Moglia, M.; Gould, S. A physical probabilistic model to predict failure rates in buried PVC pipelines. Reliab. Eng. Syst. Saf. 2007, 92, 1258–1266. [Google Scholar] [CrossRef]
- Povolo, F.; Schwartz, G.; Hermida, E.B. Stress relaxation of PVC below the yield point. J. Polym. Sci. Part B Polym. Phys. 1996, 34, 1257–1267. [Google Scholar] [CrossRef]
- BSI. Plastics Piping Systems for Water Supply and for Buried and above-Ground Drainage and Sewerage under Pressure—Unplasticized Poly (Vinyl Chloride) (PVCU); NEN-EN-ISO 1452-1:2009; BSI: Wolverhampton, UK, 2009. [Google Scholar]

| Producer | Diameter (mm) | Pipe Wall Thickness (mm) | Insertion, Complete (mm) | Insertion, Incomplete (mm) |
|---|---|---|---|---|
| A | 110 | 3.2 | 83 | 63 |
| 200 | 5.9 | 112 | 88 | |
| 315 | 9.2 | 135 | 100 | |
| B | 110 | 3.2 | 92 | 72 |
| 200 | 5.9 | 125 | 100 | |
| 315 | 9.2 | 180 | 140 | |
| C | 110 (design a) | 3.2 | 90 | 65 |
| 200 (design a) | 5.9 | 119 | 90 | |
| 200 (design b) | 5.9 | 119 | 95 |
| Water Pressure (MPa) | 0.3 | 0.4 | 0.5 | 0.3 | 0.4 | 0.5 | 0.3 | 0.4 | 0.5 | |
| Soil Load (MPa) | 0.01 | 0.015 | 0.02 | 0.01 | 0.015 | 0.02 | 0.01 | 0.015 | 0.02 | |
| Diameter | Insertion | Producer A | Producer B | Producer C | ||||||
| 110 mm | complete | 3.6° | 3.6° | 3.6° | 3.8° | 3.8° | 3.8° | 2.9° | 2.,9° | 2.9° |
| incomplete | 3.9° | 3.9° | 3.9° | 4.4° | 4.2° | 4.2° | 3.2° | 3.1° | 2.9° | |
| 200 mm | complete | 4.6° | 4.6° | 4.5° | 6.8° | 6.8° | 6.7° | 3.6° | 3.6° | 3.6° |
| incomplete | 5.1° | 5.0° | 4.9° | 8.5° | 8.3° | 8.1° | 4.1° | 4.0° | 4.0° | |
| 315 mm | complete | 5.2° | 5.1° | 5.0° | 7.1° | 7.0° | 6.8° | - | - | - |
| incomplete | 7.3° | 7.1° | 6.9° | 8.4° | 8.3° | 8.2° | - | - | - | |
| 200 mm Flex | complete | - | - | - | - | - | - | 5.2° | 5.,2° | 5.2° |
| incomplete | - | - | - | - | - | - | 6.0° | 5.3° | 5.1° | |
Publisher’s Note: MDPI stays neutral with regard to jurisdictional claims in published maps and institutional affiliations. |
© 2018 by the authors. Licensee MDPI, Basel, Switzerland. This article is an open access article distributed under the terms and conditions of the Creative Commons Attribution (CC BY) license (https://creativecommons.org/licenses/by/4.0/).
Share and Cite
Laarhoven, K.A.v.; Wols, B.A. Combining Models to Simulate the Condition of the PVC Distribution Network. Proceedings 2018, 2, 591. https://doi.org/10.3390/proceedings2110591
Laarhoven KAv, Wols BA. Combining Models to Simulate the Condition of the PVC Distribution Network. Proceedings. 2018; 2(11):591. https://doi.org/10.3390/proceedings2110591
Chicago/Turabian StyleLaarhoven, Karel A. van, and Bas A. Wols. 2018. "Combining Models to Simulate the Condition of the PVC Distribution Network" Proceedings 2, no. 11: 591. https://doi.org/10.3390/proceedings2110591
APA StyleLaarhoven, K. A. v., & Wols, B. A. (2018). Combining Models to Simulate the Condition of the PVC Distribution Network. Proceedings, 2(11), 591. https://doi.org/10.3390/proceedings2110591