1. Introduction
Natural geologic bodies (rocks and derived soils or sediments), as well as building materials prepared from them, can constitute an important source of ionizing radiation due to the presence of uranium, thorium, and potassium radionuclides in their minerals. The highest amounts of radioisotopes, which are mainly uranium and thorium, can be found [
1,
2] in geologic terrains like monazite or zircon rich sedimentary bodies, organic-rich schists, carbonatites, and granites (especially when they are affected by uranium enrichment related to alteration).
Studies about the possible health effects of such radiation have been mostly dedicated to assessing radiation doses in indoor environments both in terms of Rn concentrations and external gamma radiation (especially in relation to building materials). The possible impact of outdoor gamma radiation has deserved less legal attention but there are several scientific publications dedicated to radioisotopes analyses and gamma dose calculations as well as some with direct gamma radiation measurements. The absorbed dose rate of gamma radiation can be directly assessed (usually in nGy per hour) from field gamma-ray spectrometry measurements with low precision. Alternatively, the radionuclide concentrations (or specific activities, in Bq/kg) in a given object can be obtained from laboratory analyses and converted in absorbed dose rate using factors that vary based on the amount of the object and the distance to the object. Diverse factors have been proposed and here will be considered the factors listed in Reference [
3]. However, the final impact on humans (effective dose) needs also to consider a factor of conversion from the absorbed dose rate to the effective dose (in mSv), which is usually being usual to consider a factor of 0.7 [
1,
3], and the time that humans are exposed to the radiation source. An extensive collection is presented in a document from the United Nations (UNSCEAR [
1]), which presents ranges from different countries as well as values for highly radioactive areas. This data set has been used to explore the implications of those values in terms of the exposure time necessary for attaining a certain yearly effective dose. The relations with radioisotope contents will also be discussed by considering the gamma activity index (index definition in [
3]). The term outdoor is being used in this paper with a very broad meaning including spaces of the built environment that can be very different from the non-human designed terrain such as piles of materials or the presence of pavements and façades (for which will be considered the factors presented in Reference [
3]).
3. Absorbed Dose Rates
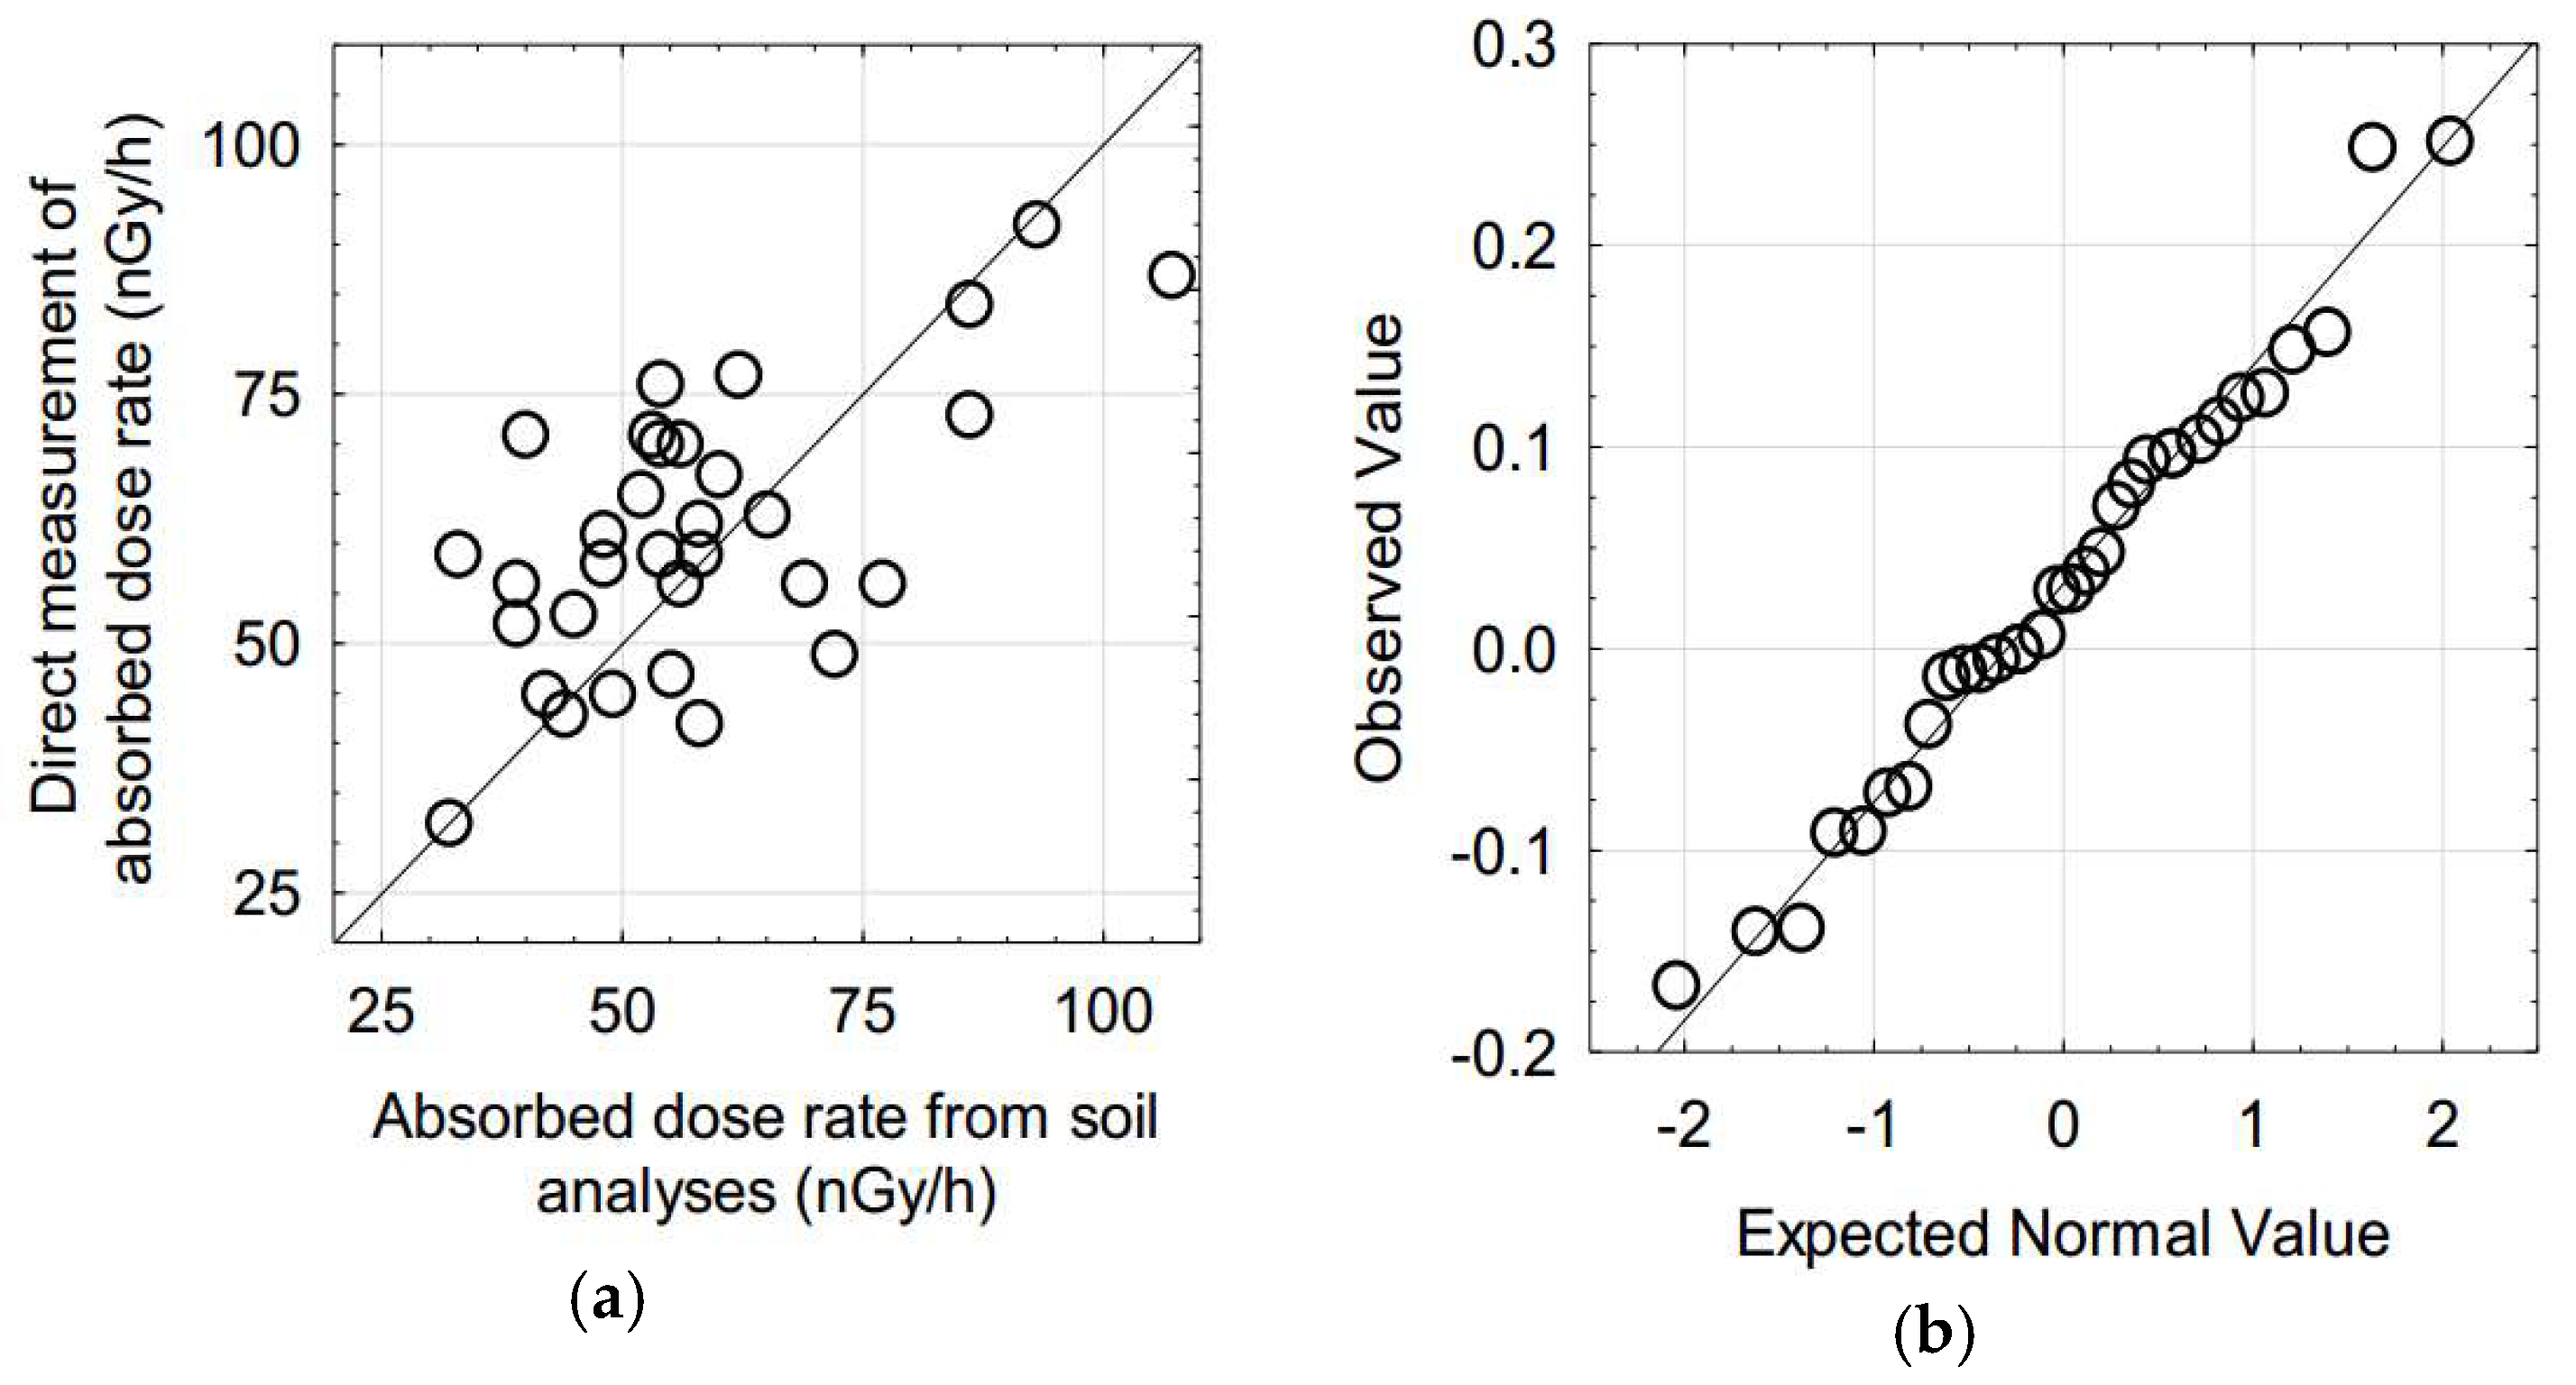
Absorbed dose rates can be measured directly or estimated from analyses of radioisotope concentrations using factors that assume a given geometrical model. UNSCEAR [
1] presents comparative data of direct measurements and estimations from terrain analyses for the outdoors and the model of a substrate with infinite size (
Figure 1a). The plot shows a certain dispersion with a coefficient of determination r
2 = 0.40. The Pearson correlation coefficient gave a
p-value = 0.0001 while the more robust Spearman correlation coefficients gave a
p-value = 0.006. Considering the log-values of the ratio between direct measurements and estimations from analyses, they present a close fit to a normal distribution (meaning the fit of the original values to a lognormal distribution). All the normality tests (
Table 1) gave high
p-values (hence the null hypothesis of random variations from the normal distribution will not be rejected). The mean and median of the sample of log-values (0.032 and 0.029, respectively) correspond to ratio values very near 1 (1.08 and 1.07, respectively) and the Wilcoxon tests for a zero median (ratio = 1) gave a
p-value = 0.102. Therefore, the null hypothesis will not be rejected.
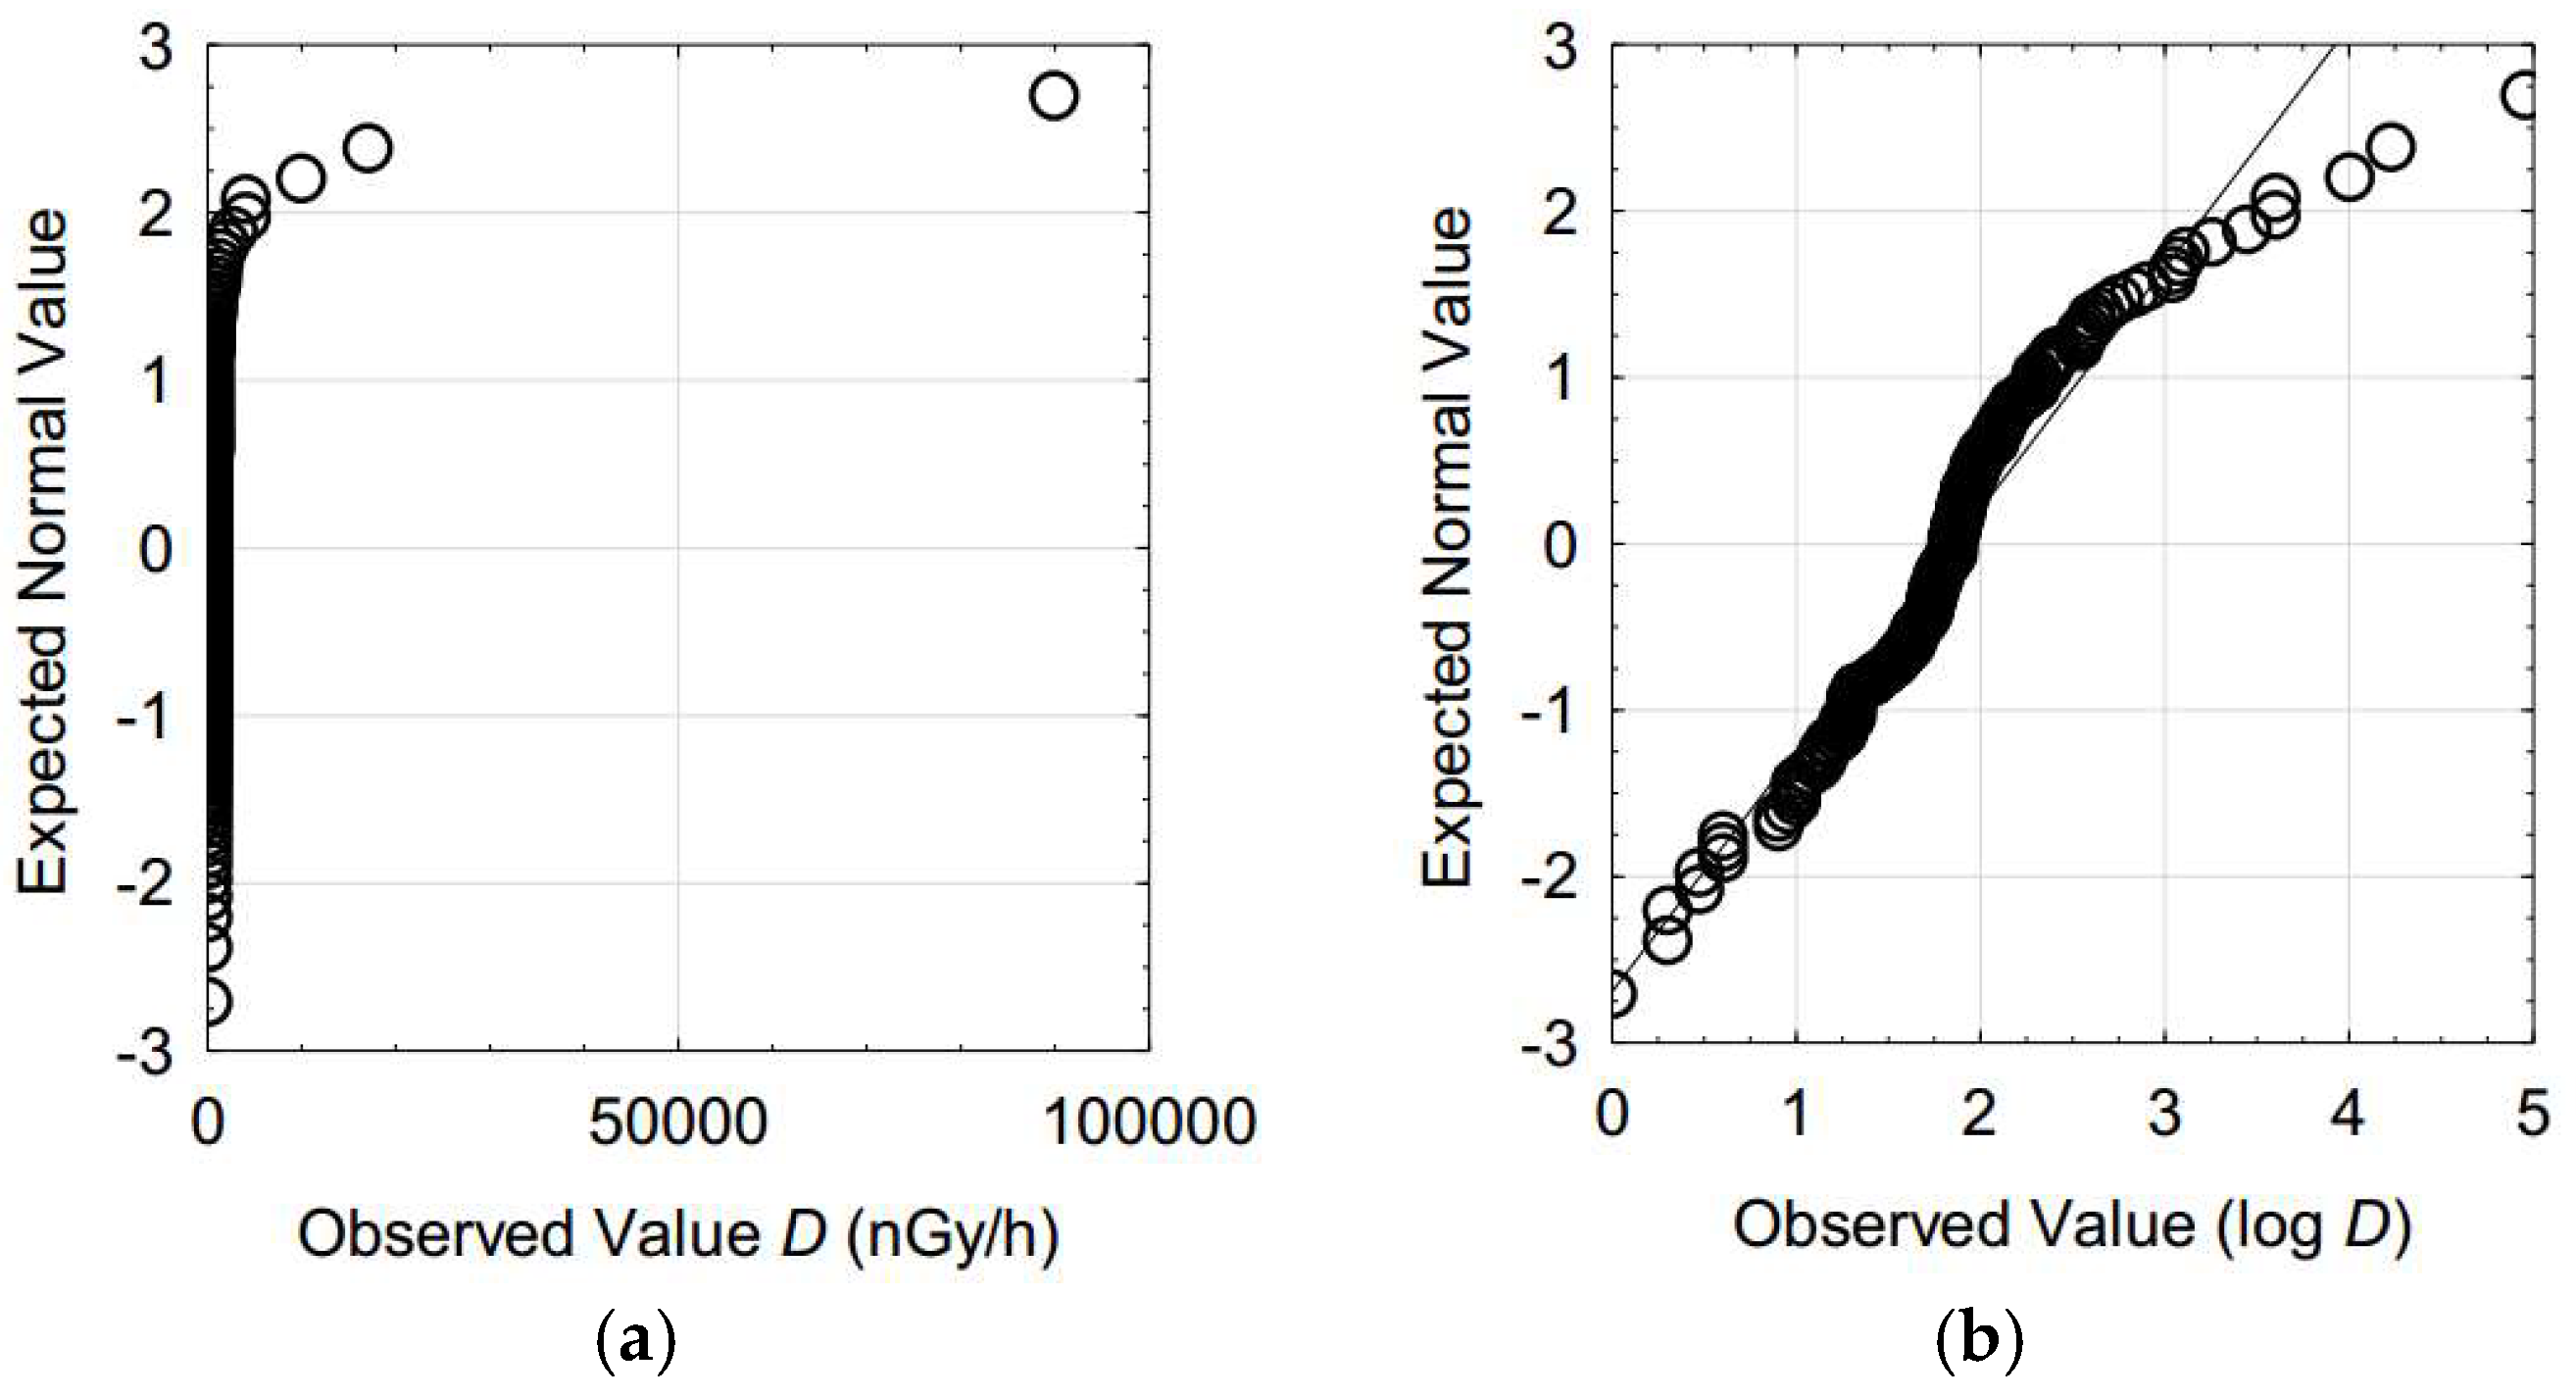
A statistical sample of values of absorbed dose rates was prepared from minimum values, average values, and maximum values for different countries presented in Reference [
1] as well as the values indicated in that publication for high radioactivity areas. The statistical meaning of this set of values can be disputed, but it is proposed that it will be useful for the perspective considered in this study (assessment of potential high values of absorbed dose rate). In
Figure 2a, a normal probability plot of these values is presented, which shows that they are very far from having a normal distribution. The consideration of the logarithm of the absorbed dose rate values (
Figure 2b) shows a distribution closer to the normal distribution (corresponding to a lognormal distribution). The mean of log-values, which corresponds to the geometric mean, is slightly higher than the median (1.86 and 1.85, respectively). However, even for the log-values set, the diverse normality tests performed gave very low
p-values (
Table 2). The set shows a pseudo-standard deviation (0.39) that is lower than the standard deviation (0.66), which indicates heavier than normal tails [
6] and a positive skewness (indicating the influence of the higher values, as is visible in
Figure 2b). These characteristics suggest that the studied set of values can be considered conservative in terms of assessing the radiological hazards.
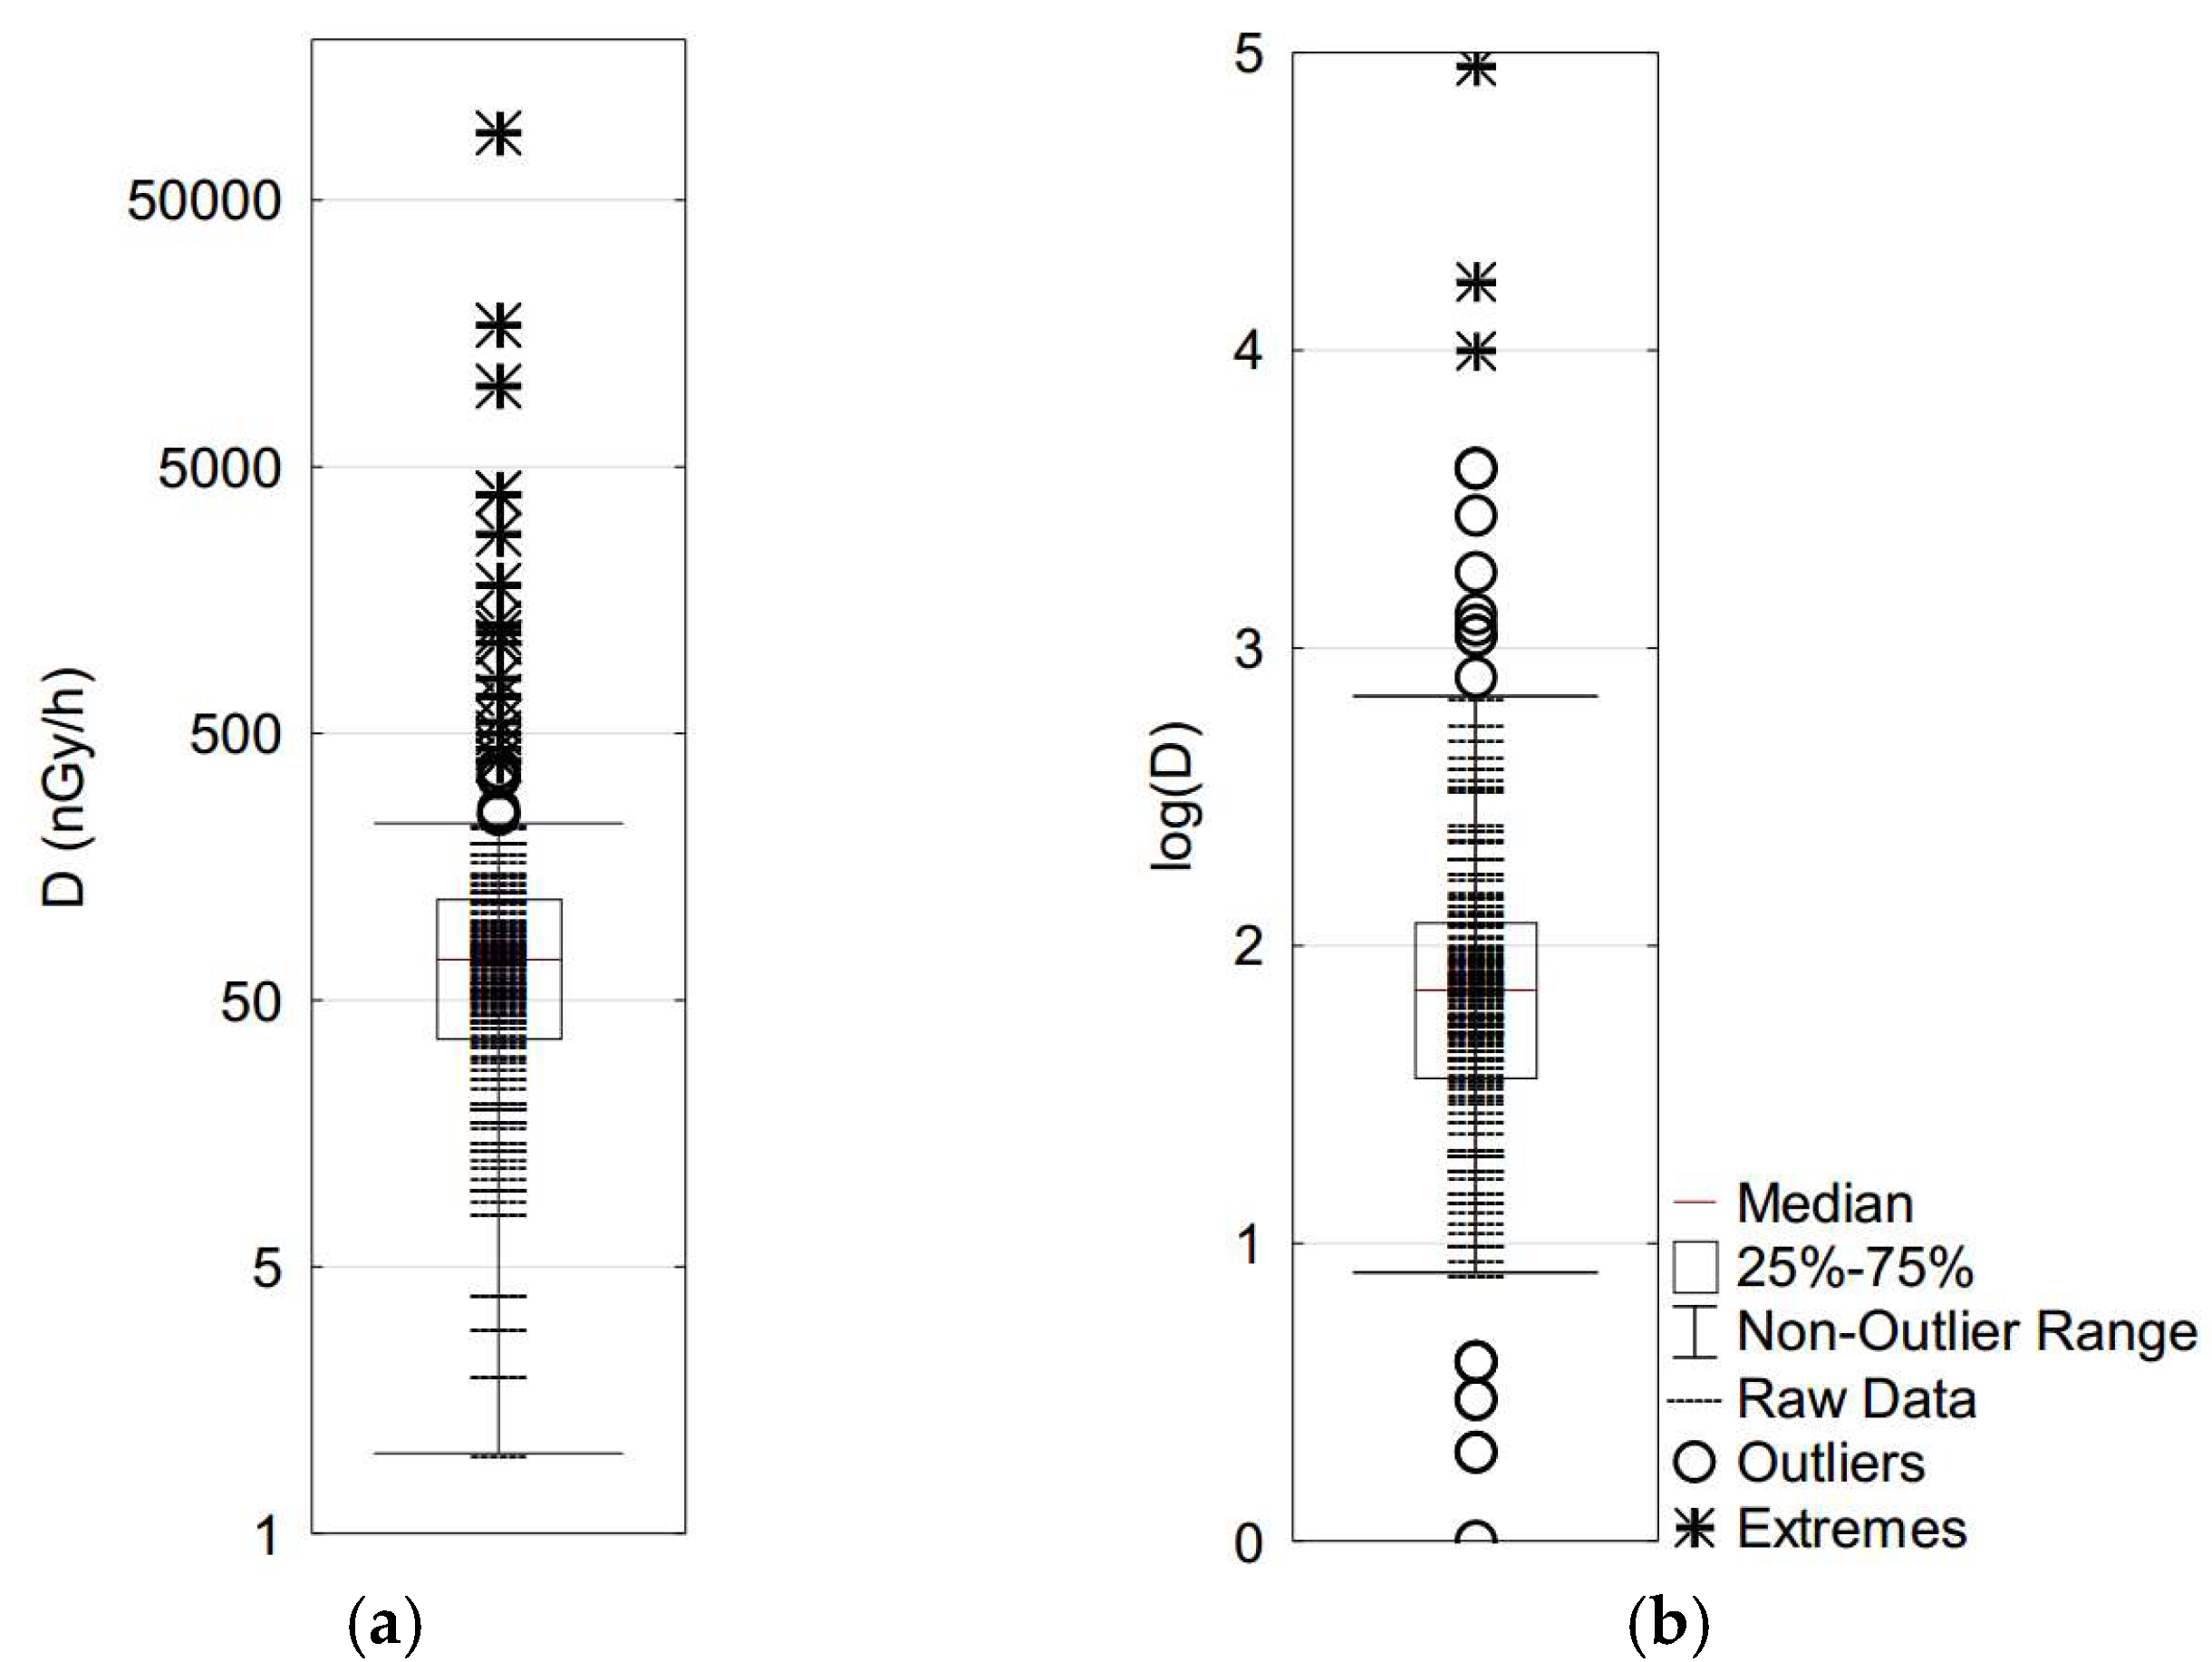
The boxplot of absorbed dose rate values (
Figure 3a, values presented in a logarithmic scale) indicates diverse potential outliers (values above around 220 nGy/h) reflecting the effect of the large amount of lower values. The boxplot of logarithms of absorbed dose rate values (
Figure 3b) is less affected by that effect, which indicates potential outlier values above log
D = 2.5 (corresponding to 316 nGy/h). Given the characteristics of the distribution of values for the log-values set discussed in the previous paragraph, the consideration of the levels related to the boxplot can be considered conservative (in the sense of the assessment of radiological hazards).
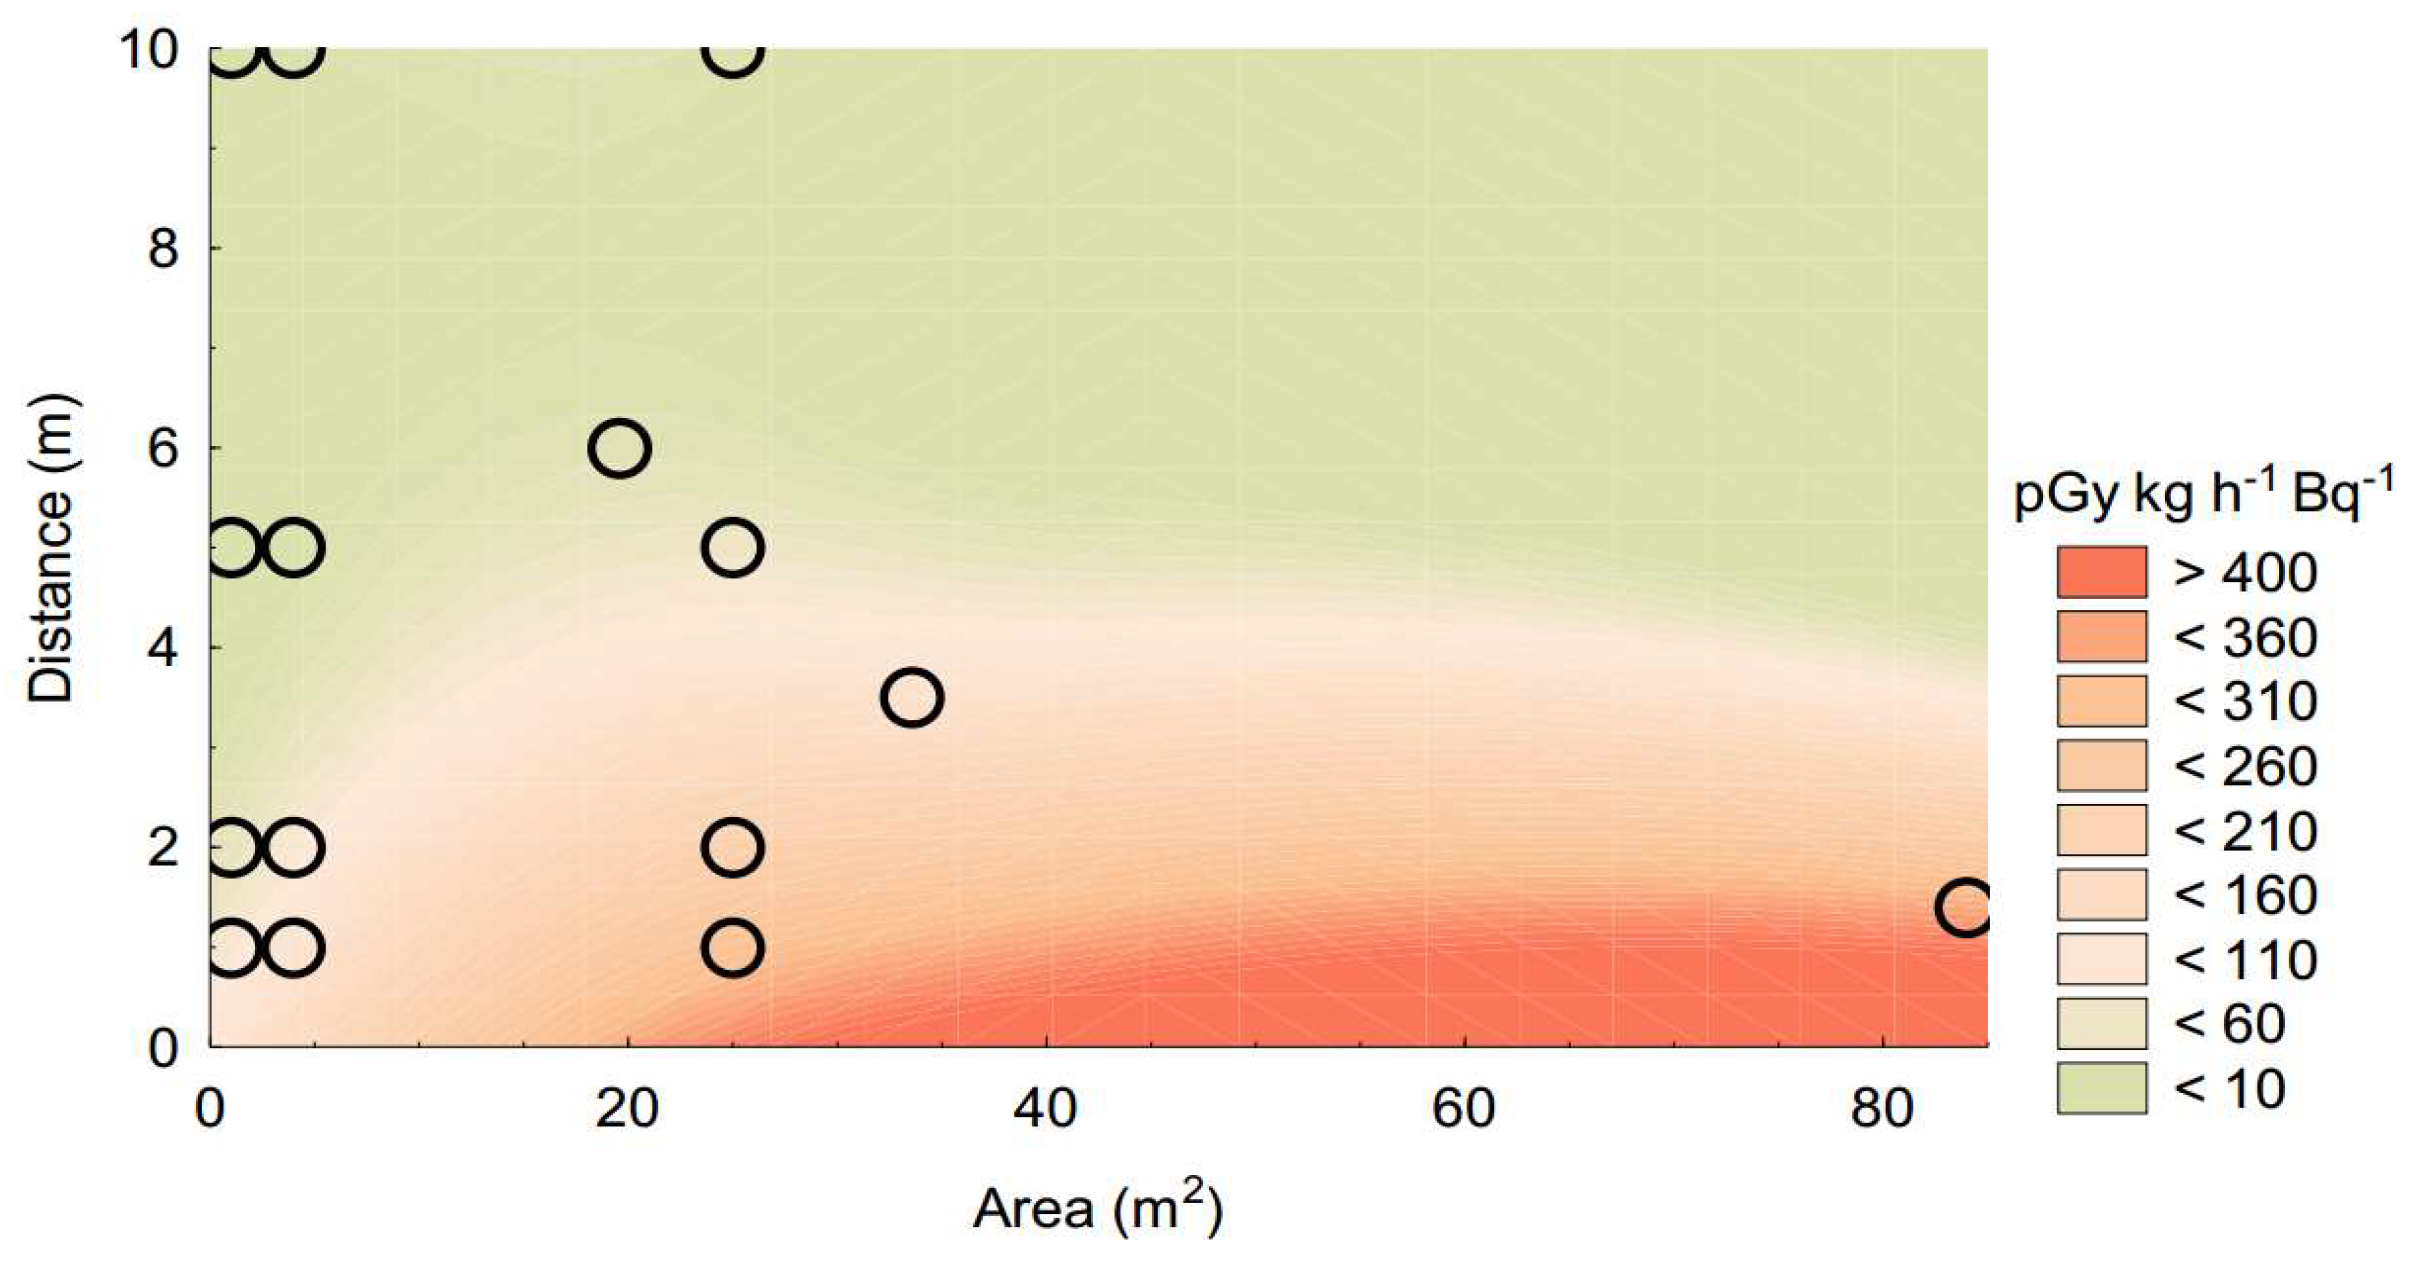
The absorbed dose rates can be estimated from the radioisotope concentrations using factors that consider the geometrical conditions.
Figure 4 presents a plot prepared from diverse factors for transforming
226Ra concentrations (in Bq/kg) presented in Reference [
3] for different situations in terms of emission area including diverse distances (1 m, 2 m, 5 m, and 10 m) from piles of material with variable facing areas (1 m
2, 4 m
2, and 25 m
2) as well as factors indicated by this author for indoor walls and floors (that can also correspond to situations in the outdoor built environment as well as to outcrops with similar dimensions) for surfaces with 12.0 m × 2.8 m and a distance of 3.5 m × 7.0 m × 2.8 m and a distance of 6.0 m × 12.0 m × 7.0 m and a distance of 1.4 m. For these surfaces proposed in Reference [
3] for indoor spaces were considered the highest factors (corresponding to the highest amounts of materials). This plot should be used with great care since the points present a very unfavorable pattern for contouring (as can be seen from the distribution of the original points presented in the plot) but it is illustrative of the effects of the amount of material and distance. It should be referred that the values presented in Reference [
3] for a model of 20 m × 20 m and a 1 m distance are higher than the highest values for the situations considered in the plot presented in
Figure 4: 29% higher for
226Ra and for
232Th, 33% higher for
40K. For an infinite pile of material, the factors indicated by [
3] are slightly higher (no more than 6%) than this last model (20 m × 20 m area; 1 m distance), being always the same for all the distance values considered by this author (up to 10 m).
4. Effective Dose
As referred above in the introduction, the effective dose in a given period of time is obtained by multiplying the absorbed dose rate by a factor (usually 0.7, see References [
1,
3]) and by the amount of time of exposure during one year. Contrary to what is frequently done (e.g., [
3]), the value of the average absorbed dose rate will not be subtracted in the following discussion (which will be, therefore, more conservative). However, the present analysis does not consider the effect of cosmic radiation. A value of 1 mSv will be considered as a reference value for the yearly effective dose (see European Council directive 2013/59/EURATOM [
7]). The question of time will depend on a given exposure model. UNSCEAR [
1] considers an average fraction of time outdoors of 0.2 of a year (8760 hours). However, there are situations that will imply higher exposure time.
- -
Spending a high amount of time in the outdoors, especially for workers in activities related to geologic materials extraction such as open mining or quarry (it will be considered that underground mining is a case of indoor environment) and homeless people.
- -
Occupancy of structures made of materials with low shielding to gamma radiation.
Following the approach presented in Lima et al. [
8], the present discussion will be focused on estimating the exposure time (
t) required to achieve the yearly effective dose indicated as a reference. Considering different levels of the absorbed dose rate (in nGy) expressed as 10
logD, one can deduce the equation (assuming a 0.7 conversion factor from Gy to Sv) for the time necessary (in hours) to achieve an effective dose of 1 mSv per year.
In this way, it is possible to estimate that for terrains with an absorbed dose rate corresponding to the start of the extreme outliers in the plot of
Figure 3a (around 10
4 nGy/h), it will take around 143 hours in one year to achieve the 1 mSv value. This corresponds to around 2.75 hours per week (considering the 52 weeks) or, perhaps more worrisome, 6 holydays living on a tent on that terrain (assuming that all the time was spent on terrain with this radiation level).
The relation with the radioisotopes composition of the terrains will depend on the geometric scenario considered. Sanjurjo-Sanchez and Alves [
2] proposed the use of partial gamma indexes,
I(U),
I(Th), and
I(K), calculated by dividing the radioisotopes activity concentrations of
226Ra,
232Th, and
40K by the factors used as denominators in the activity concentration or gamma index proposed for the assessment of building materials (300 for
226Ra, 200 for
232Th, and 3000 for
40K, see References [
3,
7]). For the factors proposed in Reference [
3] for a pile of material with an infinite facing area, the contributions of the radioisotope activity concentrations can be calculated from these partial gamma indexes by multiplying by 141, 114, and 126 (respectively for
226Ra,
232Th, and
40K). Therefore, one can propose (for the indicated exposure model) and considering that any value of the activity concentration index can be expressed as 10
logI a simple relation between the exposure time (hours in a year) to achieve the effective dose and the activity concentration or gamma index (
I):
There is at least one potentially interesting result from this relation. Directive 2013/59/EURATOM [
7] indicates the referred activity concentration index for the control of building materials and proposes as “conservative screening tool” a value of 1 for this index. A pile of material with
I = 1 and an infinite facing area will give an absorbed dose rate that is not higher than 141 nGy/h, which, for 8760 hours in a year, will give an effective dose of 0.86 mSv. Similar relations could be proposed for other exposure scenarios. A worse scenario outdoors would be to be over a rock pavement and near a very big wall rock; assuming that one should consider the factors proposed in Reference [
3] for a pile of material with an infinite facing material, the factors for converting the partial gamma indexes in contributions to absorbed dose rates will be double. Assuming an exposure of 48 hours/week and 51 weeks by year, this will imply (for the highest factor of conversion between index and dose rate) an effective dose per year of 0.48 mSv for materials with
I equal to 1. However, for people living in this exposure situation 8760 hours per year, this implies an effective dose of 1.7 mSv (for the highest conversion factor). There could be even worse situations, which can be considered on the fringe of outdoor/indoor, if there are more surfaces or for people dwelling on small open cavities on rock massifs.


