Proceeding Paper

Modeling of Polyphenols and Color Index of Grape by Satellite Images, Colchagua Valley, VI Region, Chile †

1
Geo-Environmental Cartography and Remote Sensing Group (CGAT), Universitat Politècnica deValència, Camí de Vera s/n, 46022 València, Spain
2
Hémera Centro de Observación de la Tierra, Facultad de Ciencias, Universidad Mayor, Santiago 8340589, Chile
*
Author to whom correspondence should be addressed.
Presented at the II Congress in Geomatics Engineering, Madrid, Spain, 26–27 June 2019.
Proceedings 2019, 19(1), 21; https://doi.org/10.3390/proceedings2019019021
Published: 17 July 2019
(This article belongs to the Proceedings of The II Geomatics Engineering Conference)

Abstract

:
The study looks forward to define a methodology that can improve the quality of the wine produced, through selective crop management, for which a multiple regression analysis was used between satellite images Sentinel 2 and polyphenols and color index. The estimated polyphenols, presents the best results in the variables color index and tannins, with an R2 of 0.78 and 0.65 respectively. The preliminary methodology allows the identification of homogeneous zones in polyphenols and final color estimation, transforming it into a potential tool for harvesting.

1. Introduction

Actually, Chile has the first place on wine exporter in America, with a total wine vinification surface for over 141.000 hectares, which makes a potential wine production near to 1.200 million of liters. This surface is mainly located in Maule and O’Higgins region, encompassing over 72% of the national surface. On wine industry, Viña Montes has a total of 720 hectares of wine, out of which 93% is exported [1]. From the point of view of the technification process, a differentiated harvest is an artisan process: the lots or predefined zoning of a lot are weekly monitored after the veraison, with the main objective of measuring sugar and acids amounts, in order to determine the best moment to harvest. From the literature point of view, the use of NDVI is relevant in the sense of managing a directed harvest and relate it with quality facts as sugar and acidity [2,3,4,5,6,7,8].
Within these developments, it is necessary to look for applications that reduce work time in the fields and allow an early prediction of the specific places of the field sampling. This research involves the study and behavior of the field data out of two harvest seasons of wine grape production: 2017 and 2018. However, the present article is focused on the development, study and results, exclusively, on the first harvest season, year 2017. The main objective is to define a methodology that allows to improve the quality of wine throughout a very selective harvest management, using satellite images of medium spatial resolution. To obtain this, bands and spectral indexes were searched, in order to correlate them with preponderant factors of wine grape quality: polyphenols and colour index. These two give different characteristics to the wine. Furthermore, to determine a regression model that allows to predict estimated polyphenol maps, leads directly to benefit the differential harvest and consequently to improve the quality of wine production as a real advantage to the wine industry.

2. Materials and Methods

The study was carried out during the pre and post-harvest period in 2017, specifically focused on two lots of 151 hectares, corresponding to plantations 2007 and 2010, located in Santa Cruz, Colchagua Valley, VI region, Chile.

2.1. Study Area

Viña Montes has a surface of 720 ha of vine. The plantation is located in Marchigue, Colchagua Valley, Santa Cruz, VI Region, Chile, known as “Arcangel”, which has a total Surface planted of 499 ha. The study was focused on two lots of 64.8 and 71 ha, corresponding to plantations in the years 2007 and 2010 respectively. The lots were composed by 100% of Sauvignon Cabernet, Alpha category, which is an intermediate quality category and that corresponds to the mayor production of Viña Montes.

2.2. Satellite Images

Each one of the Sentinel 2 bands were used as a variable to estimate phenolics compounds and colour index, as well as the generation and development of 6 spectral index (see Table 1), obtained from satellite images. A multispectral satellite image in which each band generate a different spectral response to each wavelength, allows to differentiate one area from another with particular characteristics. One way to express this categorization -or group- is by index. The index used is the following:

2.3. Wine Analysis

In simple terms, it depends on whether the wine taster liked the wine or not. There are some basic factors, although that are considered essential in determining the quality of wines, these are: color, scent and “mouth feel”. The quality of wines is strongly influenced by its phenolic structure, composed by anthocyanins and tannins, among others. This structure is responsible for sensory characteristics as important as color, body, astringency and bitterness [9].
The wine analysis was carried out by four winemakers, who categorized the samples according to Limited (L); Alpha (A); Superior (S). Intermediate variations were also identified: minus (−) and more (+). These last two indicated which tasted samples were below or above the average of what was expected for each category. With this evaluation, it is possible to determine the relationship between the qualities assigned by the winemaker and the presence of color index, total anthocyanins, total phenols and total tannins in the samples.

2.4. Statistical Comparison

The first part of the study consisted in selecting the best regression model based on the relationship of multiple variables. For this, Multiple Linear Regression was used. The dependent variables in each case were the real data obtained from wine: color index and polyphenols. On the other side, the independent variables correspond to the spectral bands of the Sentinel 2 image and the indicators obtained from the algebra of such bands. The estimation was based on the average of pixels inside a buffer of 15 m around the terrain sample. The regression model considered the best correlations using the results with 2, 3 and 5 independent variables. See Table 2.

3. Discussion and Results

The study allowed to make a map of each one of the field data. It is expected that the trends reflected by the factors under research set a similar trend both, visually and statistically and that the resulting values have the least possible dispersion.
For wine maps, Inverse Distance Weighted interpolation (IDW) was used. This corresponds to a relatively simple method of interpolation, whose advantage is that it requires little calibration of parameters; this makes its implementation fast and quite objective and it has been used and evaluated in studies related to plant cover [10].
A visual and statistical comparison was made between the variables of wine produced and the variables estimated from a linear regression function (see Figure 1). The coefficient of determination between them is better, insofar, as the independent variables that are used in the modeling increase. However, consequently in each of the resulting maps, increasing the number of variables gets the visual relationship that is obtained worse and referring to the maps, they are more disaggregated and pixelated. The maps modeled after 2 or 3 variables are quite similar to each other, and visual homogeneity is not affected, allowing a more effective comparison of the results. Not all the variables under study are fully explained with a modeling based on satellite images or spectral indicators, in consistency with previous results, there are additional variables, such as the spatial resolution of the images that influence the exact representation of the pixel, the percentage of present soil and the time of measurement of the variables, among others.
In this line, the statistical comparison presents the best results in the variables color index and tannins, with a determination coefficient of 0.78 and 0.65 respectively.
The preliminary results of this study are auspicious to enhance the work of selective harvesting and identification of particular areas within a batch, which would allow the fruit analysis to be carried out directly. With the present study it is possible to affirm that the methodology allows the identification of potential zones both of presence of polyphenols or final color estimation, as a useful instrument for harvesting tasks and estimation of final quality at the time of wine production.

References

  1. Lima, J.L. Estudio De Caracterización De La Cadena De Producción Y Comercialización De La Agroindustria Vitivinícola: Estructura, Agentes Y Prácticas; Oficina de Estudios y Política Agraria del Ministerio de Agricultura de Chile: Chile, 2015; page 208. [Google Scholar]
  2. Johnson, L.F.; Roczen, D.E.; Youkhana, S.K.; Nemani, R.R.; Bosch, D.F. Mapping vineyard leaf area with multispectral satellite imagery. Comput. Electron. Agric. 2003, 38, 33–44. [Google Scholar] [CrossRef]
  3. Martinez-Casasnovas, J.A.; Agelet-Fernandez, J.; Arno, J.; Ramos, M.C. Análisis de zonas de manejo diferencial en viñedo y relación con el desarrollo de la viña, madurez y calidad de la uva. Span. J. Agric. Res. 2012, 10, 326–337. [Google Scholar] [CrossRef]
  4. Sun, L.; Gao, F.; Anderson, M.C.; Kustas, W.P.; Alsina, M.M.; Sanchez, L.; Sams, B.; McKee, L.; Dulaney, W.; White, W.A.; et al. Daily mapping of 30 m LAI and NDVI for grape yield prediction in California vineyards. Remote Sens. 2017, 9, 317. [Google Scholar] [CrossRef]
  5. Cunha, M.; Marçal, A.R.S.; Silva, L. Very early prediction of wine yield based on satellite data from vegetation. Int. J. Remote Sens. 2010, 31, 3125–3142. [Google Scholar] [CrossRef]
  6. Martinez, J.; Agelet, J.; Arnó, J.; Ramos, C.; Bordes, X. Protocolo para la zonificación intraparcelaria de la viña para vendimia selectiva a partir de imágenes multiespectrales. Rev. Teledetec. 2010, 33, 47–52. [Google Scholar]
  7. Hall, A.; Louis, J.; Lamb, D. Characterising and mapping vineyard canopy using high-spatial- resolution aerial multispectral images. Comput. Geosci. 2003, 29, 813–822. [Google Scholar] [CrossRef]
  8. Cortell, J.M.; Halbleib, M.; Gallagher, A.V.; Righetti, T.L.; Kennedy, J.A. Influence of vine vigor on grape (Vitis vinifera L. Cv. Pinot noir) and wine proanthocyanidins. J. Agric. Food Chem. 2005, 53, 5798–5808. [Google Scholar] [CrossRef] [PubMed]
  9. Peña, N. Los taninos y su importancia en la calidad de uvas y vino. Inf. Enol. 2006, 50, 18–20. [Google Scholar]
  10. Johnson, B.; Tateishi, R.; Kobayashi, T. Remote sensing of fractional green vegetation cover using spatially-interpolated endmembers. Remote Sens. 2012, 4, 2619–2634. [Google Scholar] [CrossRef]
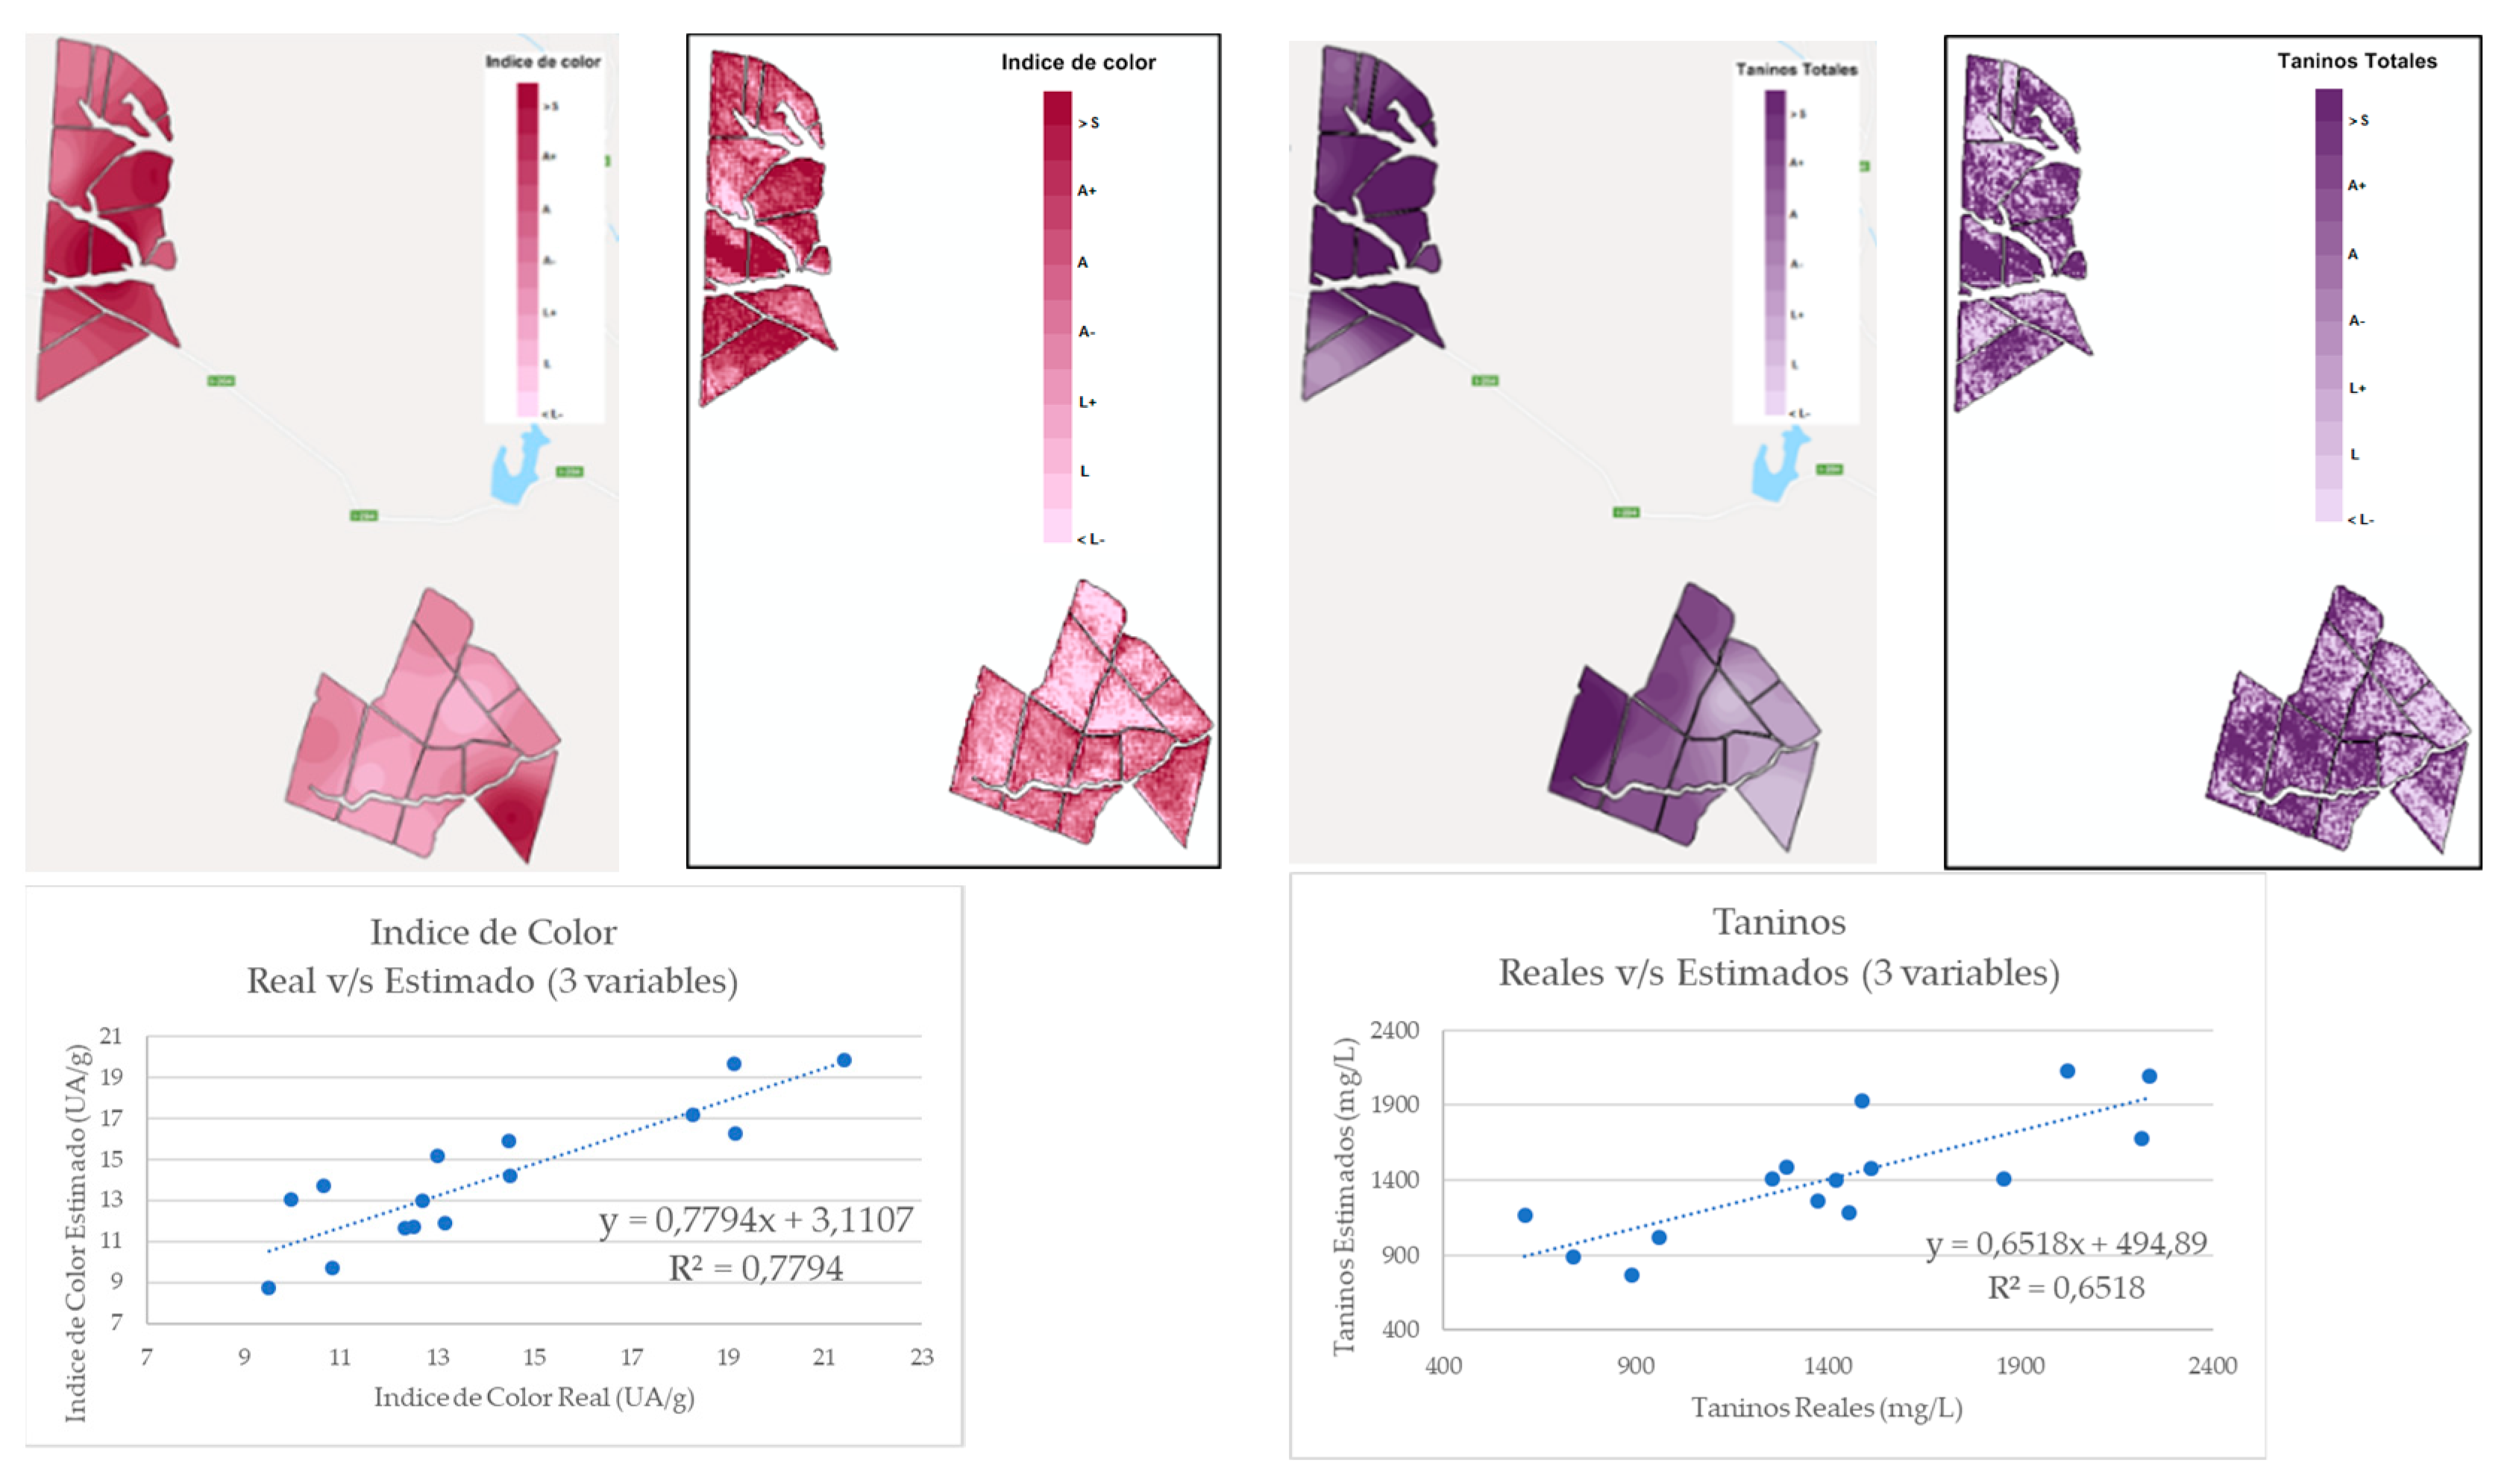
Figure 1. Comparison between real maps and maps modeled from a multiple linear regression function. The example shows only two results: Color Index and Tannins.
Proceedings 19 00021 g001
Table 1. Displays the spectral indices used with the Sentinel 2 image bands.
G N D V I = G r e e n N i r v e r d e + N i r N D V I = R e d N i r R e d + N i r C l o r o f i l a = R e d B l u e G r e e n
N D M I = N i r S w i r N i r + S w i r S A V I = R e d N i r R e d + N i r + L * ( 1 + L ) S R = N i r R e d
Table 2. Determination coefficients, using a multiple regression model. Average pixel comparison within a 15 m buffer around the sample.
2 Variables3 Variables5 Variables
Color Index71.32 (SR—B12)83.40 (NDMI—CL—B7)93.71 (NDVI—CL—B11—B9—B8A)
Total Tannins48.41 (CL—B12)65.18 (GNDVI—CL—B7)77.91 (SR—SAVI—NDVI—GNDVI—B7)
Total Phenols26.45 (SAVI—GNDVI)35.25 (NDVI—GNDVI—B12)62.03 (CL—B9—B8A—B8—B5)
Total Anthocyanins50.77 (CL—B11)61.02 (NDMI—CL—B6)79.92 (SR—NDMI—CL—B12—B6)
Publisher’s Note: MDPI stays neutral with regard to jurisdictional claims in published maps and institutional affiliations.