1. Introduction
The use of Open Data, generated by public institutions, constitutes nowadays a valuable source of information to carry out studies in many subjects and disciplines. There are numerous sources of Open Data that can be used for this purpose like public urban mobility services [
1] or information derived from real time satellite observations (
https://www.copernicus.eu/en)
Meteorological variables are widely used in multiple types of scientific studies. Biometeorology is the specific field that studies the relationships between those variables and the various factors that affect biodiversity, agriculture, human health and living organisms [
2]. This short article presents the preliminary results, specifically the server side programming, in the development of a web application intended to the study of meteorological variables and their possible effects on humans. For this purpose, an index is determined through the partial density of oxygen in the atmosphere PODA [
3]. In order to achieve this objective, it is first necessary to identify the sources of information to obtain reliable datasets that feed the study.
The data used in this study have geolocation properties that allow establishing relationships with other data sets by means of spatial indexing. Thus, spatial relationships can lead to different types of analysis and applications of techniques related to geomatics. This study highlights the use of spatial data processing techniques such as memory storage to optimize hardware resources, design of a data flow transformation with free and open source software, and presentation of results through interactive web visualisations.
This paper describes the process of automatically extracting meteorological information from web services to create new, derived data that feed biometeorological studies. The original data were used to obtain new variables prior to calculating a biometeorological index, which is highly important to relate possible causes of vascular and respiratory diseases by detecting situations of hypoxia (oxygen deprivation) or hyperoxia (oxygen excess) respectively, in a given region [
4]. The data required for such an index consist of predictions so that variations in weather conditions can be foreseen globally. Besides, those data are processed and visualised in order to help interested analysts and scientists in detecting diseases or any other phenomena.
2. Methodology
Before starting the development, we had to establish a working system. The problem was studied from the perspective of biometeorology, and some geomatics solutions were implemented to simplify the tasks that are routinely undertaken in this type of studies. In the first place, the aim is to define a system which allows obtaining, processing and visualising the available data as well as calculating biometeorological indices.
This creates a new data collection system for further analyses. According to the KDD (Knowledge Discovery in Databases) process [
5], once the domain and the application have been identified, a set of data with global geographic extent suitable for temporal and spatial analyses is available and the new datasets can be reused. Thus, a pre-processing stage focused on data cleaning and transformation is applied.
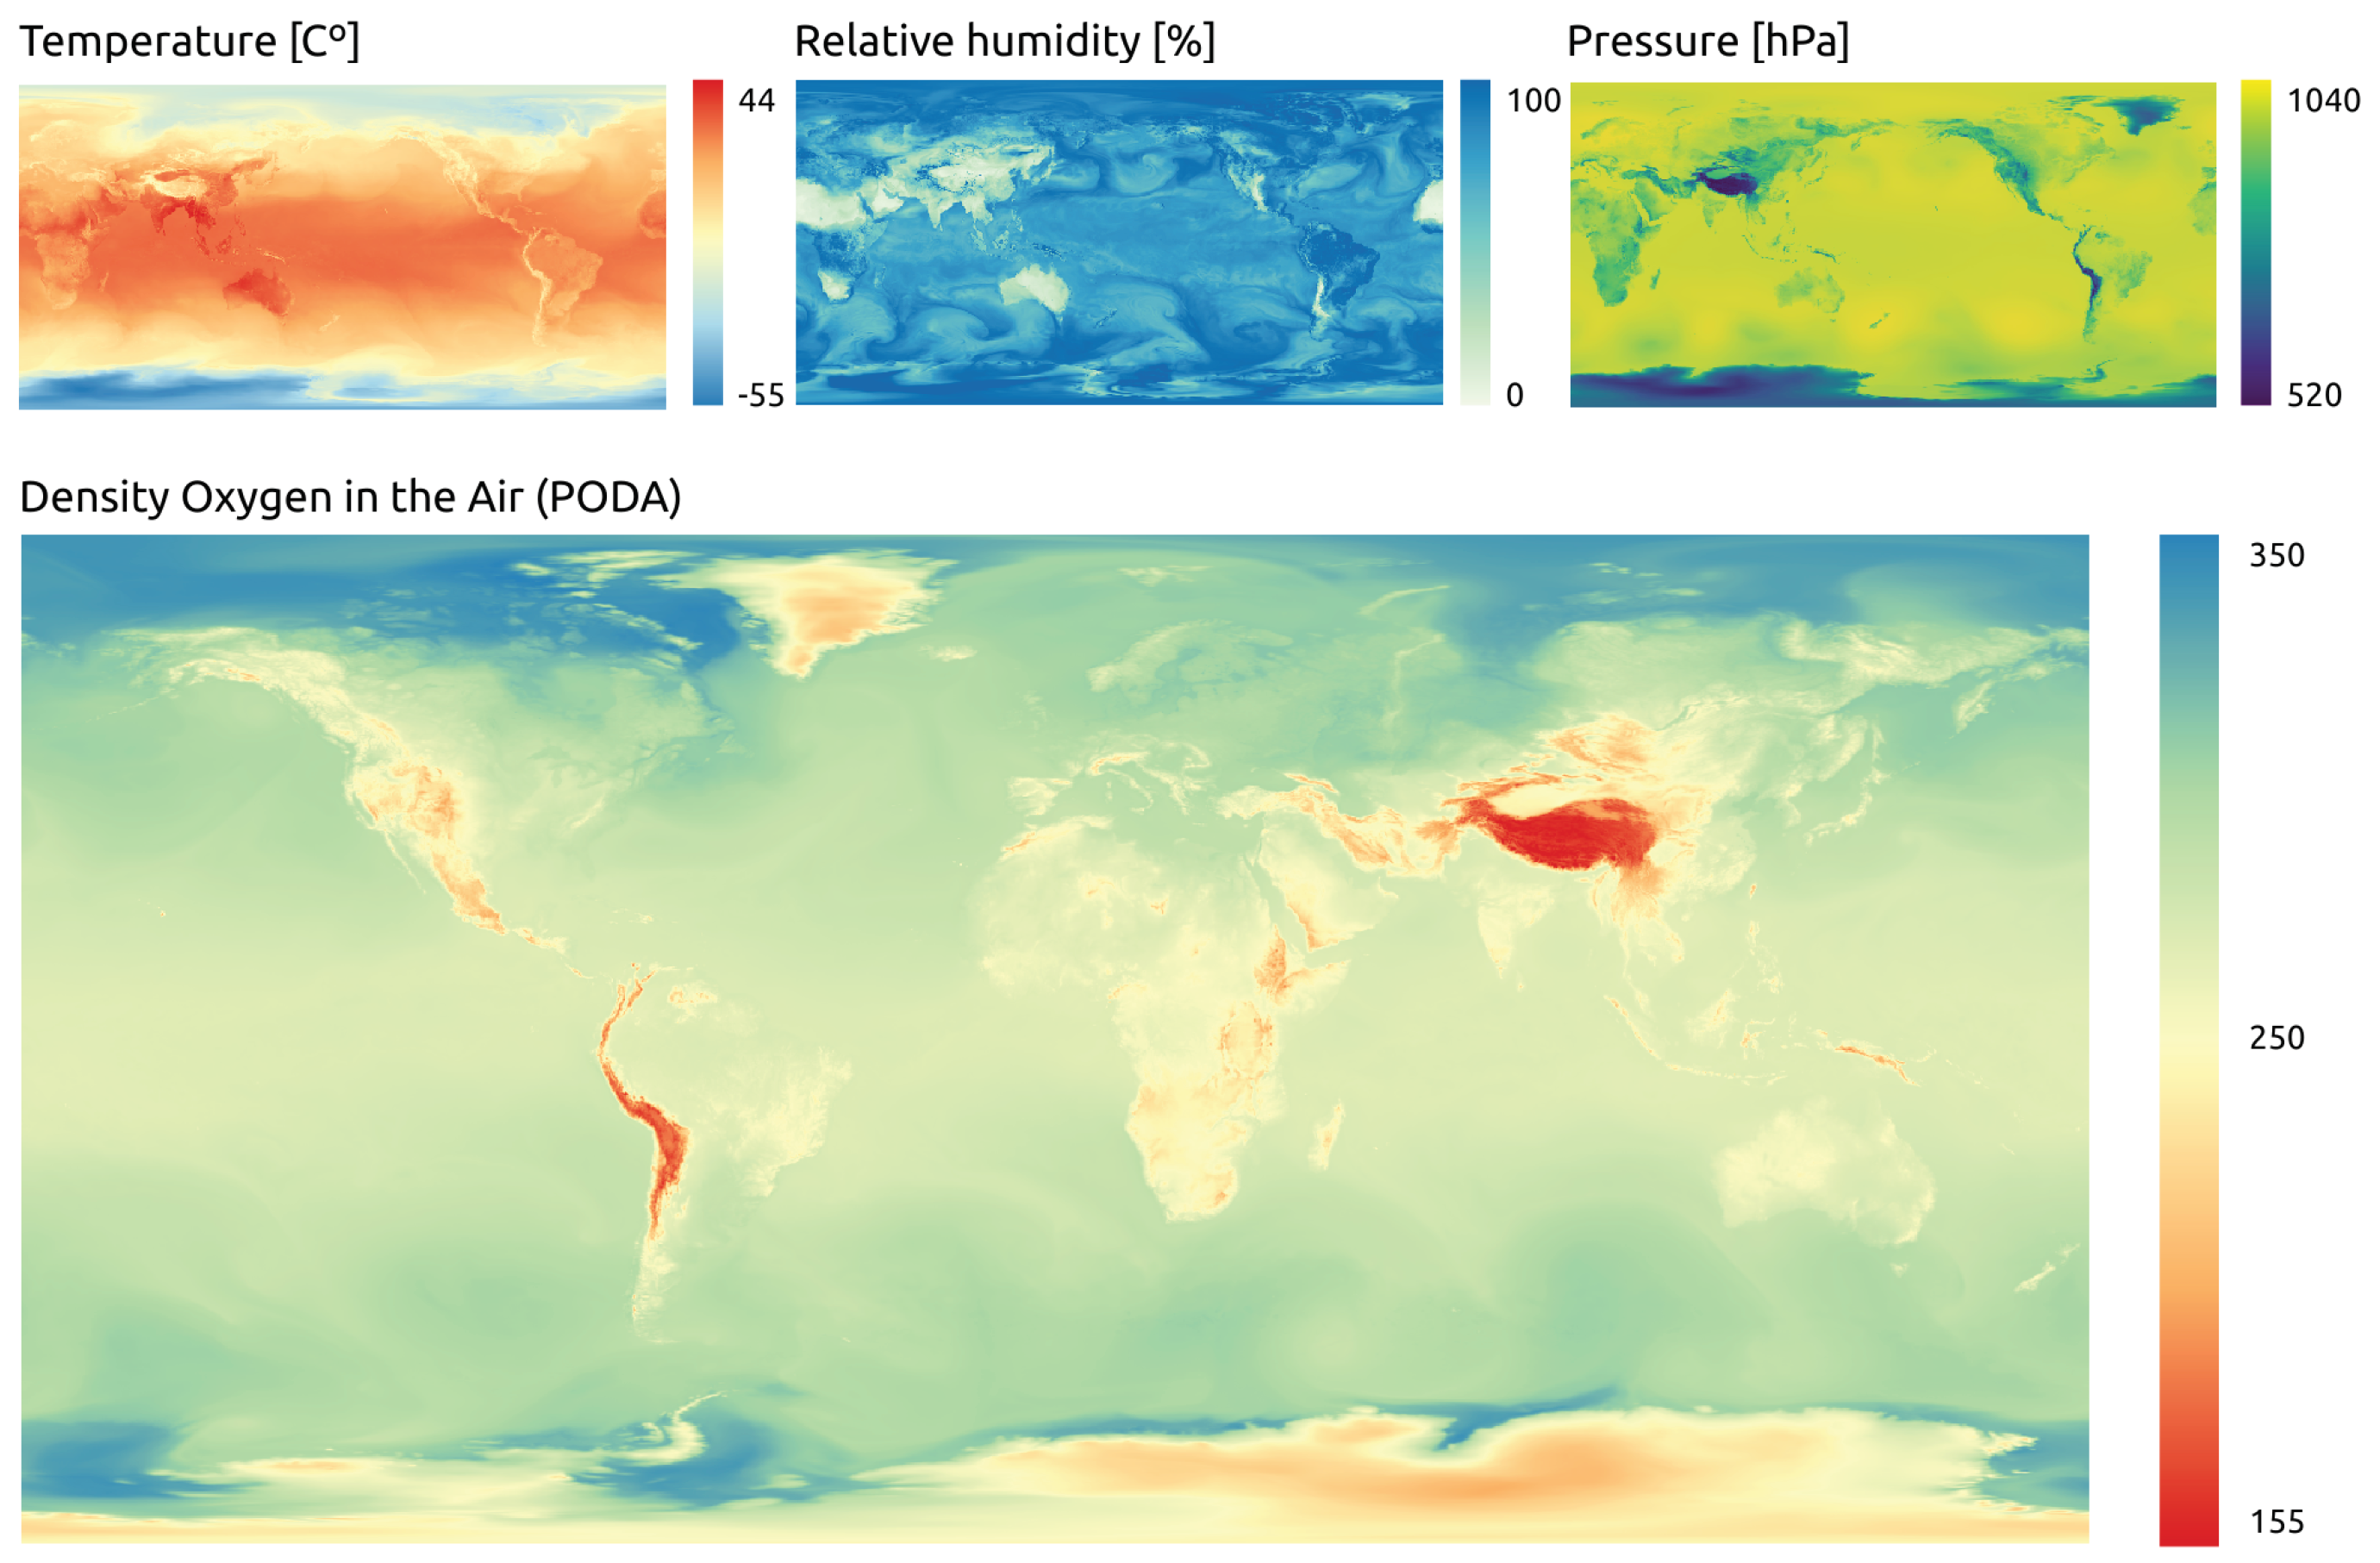
Once the data have been downloaded and pre-processed, the PODA (Partial Density of Oxygen in the Air) index is calculated with three input variables: humidity, pressure and temperature [
3,
6]. Usually, the input datasets are not available in structured formats such as tables in relational databases [
7]. Instead, the variables are presented in discrete formats in gridded data structures, i.e., raster files, where each element represents one or more values, depending on the number of bands stored in the files. For instance, with satellite images we can obtain different values for the different bands or regions of the radiometric spectrum depending on the sensor characteristics. Because of this, all that information is stored into a file system to ensure their persistence. In order to meet those technical requirements, we used the Anaconda Python framework [
8] to develop the data processing software, and the Python programming language for the complete elaboration of all the components of the system.
2.1. Sources of Information
In our study, the meteorological data came from services available at the National Oceanic and Atmospheric Administration (NOAA) web site, specifically the NOAA Operational Model Archive and Distribution System (NOMADS) data repository [
9], which includes the Global Climate Model created to encourage the use of meteorological models for research at global scale. This repository offers forecasts to hours and even several days of the three variables of interest. In our case, it was decided to download data from 24 hour forecast models. The data files are available in GRIB format, a specialised geoscientific format that OGR/GDAL can process and transform to regular numeric arrays or other raster types [
10].
2.2. Biometeorological Data Processing System
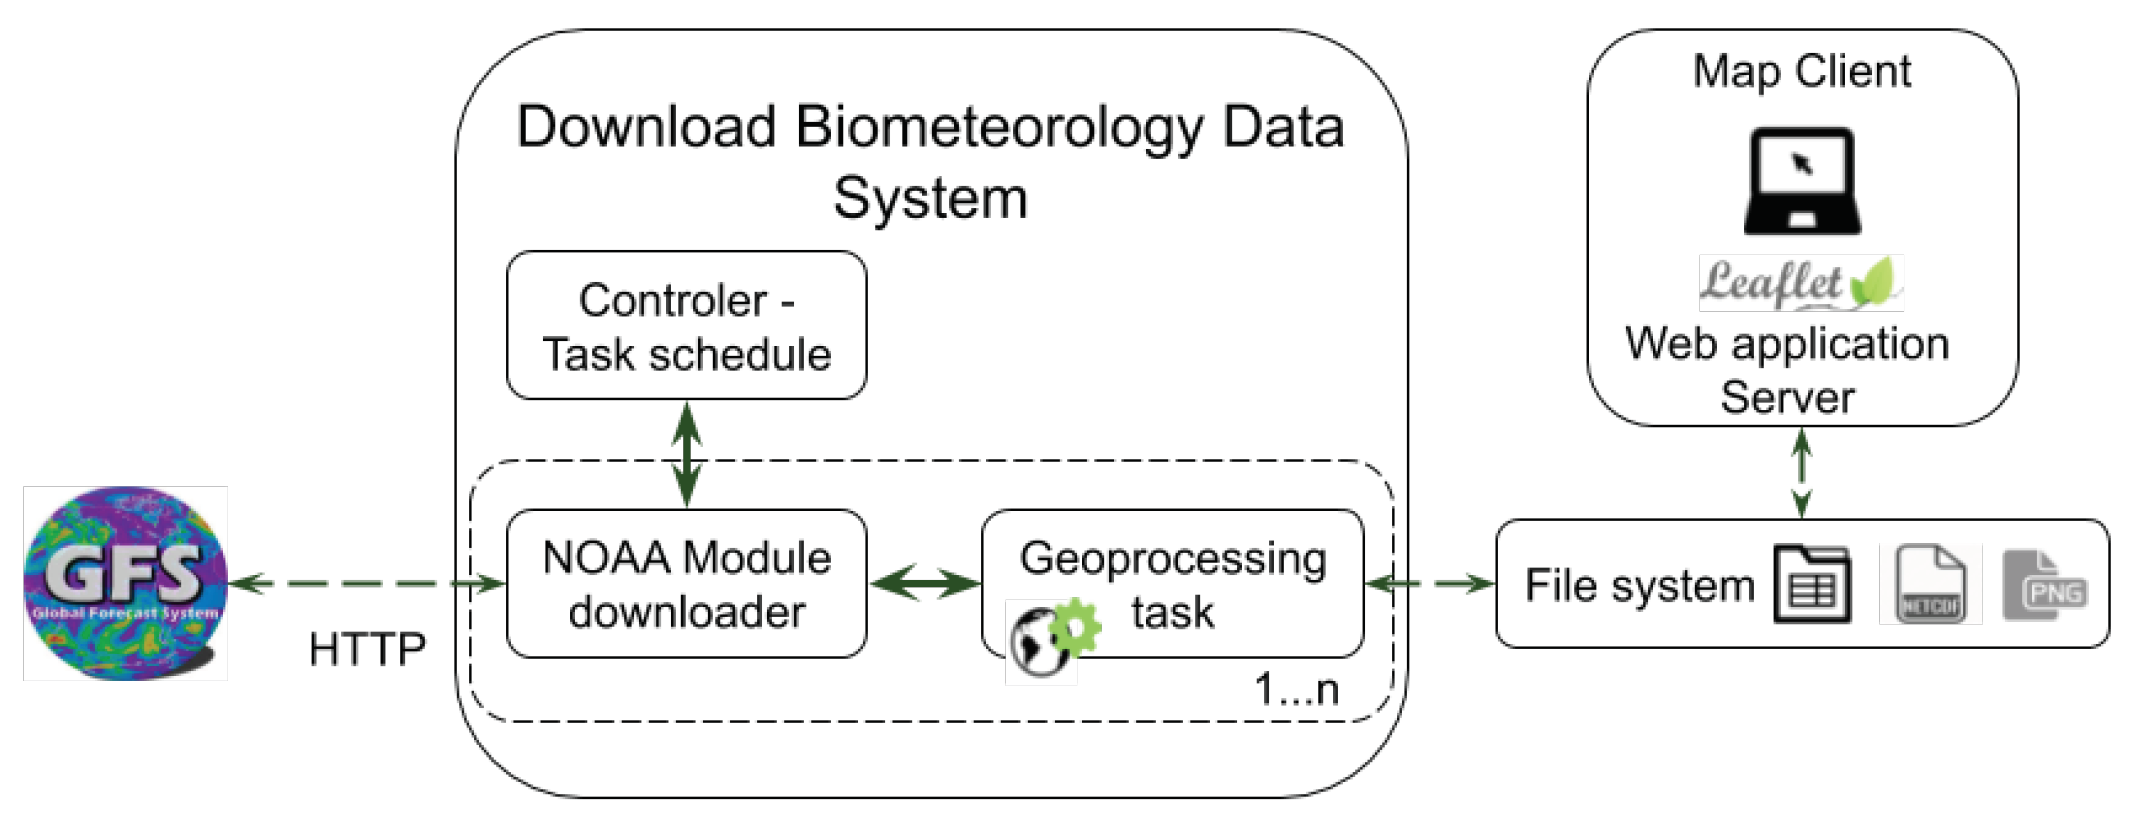
The system is based on three main components: Controller, Downloading and Geoprocessing (
Figure 1). The first component integrates and executes all processes in a systematic manner. The second module is responsible for carrying out specific functions with data, such as adding new data sources to download more data required in future analyses. Finally, the Geoprocessing element consists of a number of processing functions to transform all spatial datasets, including the calculation of PODA, the generation of new files, map reprojections and creation of new images.
First of all, the controller has a number of pre-defined tasks through Python dictionaries which contain specific hours (time of day) for data downloading as well as input parameters to those functions. When a download is about to start, the system creates an execution thread and performs the tasks of a function located within a specific module. In the case of the PODA and its three corresponding NOAA datasets, four daily downloads are programmed, one download every 6 hours starting at 00:00 UTC. Every module has different functions and a data source established for downloading and processing. Once the data are downloaded, they are read and stored into the main memory. This means an optimization in the process since there is no need to write and read disk files. After that, data are available in memory to be used in other tasks, particularly in the transformation and geoprocessing stages. In order to add new data from different sources, we can easily create new modules defining the data source and its processing functions as input parameters.
GDAL allows the programmer to read all that information in memory from the Internet and process the GRIB data structures to obtain the data array. This numeric array allows us to apply regular map algebra operations to compute the global PODA and obtain a resulting array that can be stored in the NetCDF format for persistence in the file system. As a requirement to store this result, a transformation function has been developed to convert the original files into NetCDF format, which is the most widely used format in the biometeorology community.
Finally, the system generates a PODA global raster map in PNG format for web visualisation purposes. In order to achieve this, the data array is reprojected to the Web Mercator Projection, which is the common standard in tile-based geospatial information systems [
11].
3. Discussion and Results
After defining the system requirements, a software was developed to conduct the whole process consisting of extracting specific datasets from the NOAA web site, transforming the datasets and obtaining a new, enriched product suitable for analysis in biometeorology.
The design of the system allows the inclusion of new indices to carry out the extraction and transformation processes in an automated way. An example result is shown with the PODA index, in which the entire process described above was applied.
Figure 2 contains the three input variables and the resulting PODA index, which helps in understanding the outcome of the geoprocessing during the development process. The resulting maps are suitable to be used within geographic information system (GIS) software as well as for the web application viewer. The design also takes into account the dynamic nature of the system, which generates new maps continuously (four times a day), in such a way that users can view the most recent map in the web graphical interface, but can access data (maps and time series) from past dates for downloading upon request.
4. Conclusions
The purpose of our system was to improve and facilitate the analysis of spatially distributed data together with environmental variables and meteorological indices such as the PODA. The operation of the system meets the goal, which is to bring those meteorological datasets closer to a wide range of scientists and practitioners, by transforming the raw data into standard, easy-to-use file formats ready for spatial and temporal analyses in the field of Biometeorology.
In summary, a process for data transformation and generation based on free and open source software was successfully developed, which proves the high potential of GDAL, Python and other similar tools to generate added value from freely available data in scientific applications.


